| Param | Original file | Final file |
|---|---|---|
| Filename | modeM0/AS1A10_065T03_9000004040_27992cztM0_level2.evt | modeM0/AS1A10_065T03_9000004040_27992cztM0_level2_quad_clean.evt |
| Size (bytes) | 502,770,240 | 68,031,360 |
| Size | 479.5 MB | 64.9 MB |
| Events in quadrant A | 3,354,117 | 416,558 |
| Events in quadrant B | 3,435,076 | 419,108 |
| Events in quadrant C | 3,663,702 | 395,799 |
| Events in quadrant D | 4,346,876 | 389,119 |
| Mode M9 | |||
|---|---|---|---|
| Quadrant | BADHDUFLAG | Total packets | Discarded packets |
| A | 0 | 14 | 0 |
| B | 0 | 15 | 0 |
| C | 0 | 15 | 0 |
| D | 0 | 15 | 0 |
| Mode M0 | |||
|---|---|---|---|
| Quadrant | BADHDUFLAG | Total packets | Discarded packets |
| A | 0 | 13835 | 0 |
| B | 0 | 14154 | 0 |
| C | 0 | 14957 | 0 |
| D | 0 | 17010 | 0 |
| Quadrant | Total seconds | Saturated seconds | Saturation percentage |
|---|---|---|---|
| A | 6290 | 42 | 0.667727% |
| B | 6290 | 65 | 1.033386% |
| C | 6290 | 157 | 2.496025% |
| D | 6290 | 252 | 4.006359% |
Noise dominated data is calculated using 1-second bins in cleaned event files. If a bin has >2000 counts, and if more than 50% of those come from <1% of pixels, then it is considered to be noise-dominated and hence unusable.
| Quadrant | # 1 sec bins | Bins with >0 counts | Bins with >2000 counts | High rate bins dominated by noise | Noise dominated (total time) | Noise dominated (detector-on time) | Marked lightcurve |
|---|---|---|---|---|---|---|---|
| A | 7495 | 6290 | 2 | 2 | 0.03% | 0.03% | 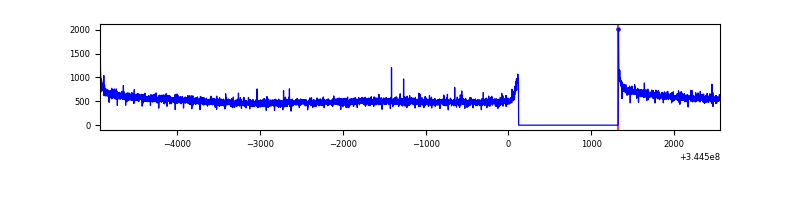 |
| B | 7495 | 6290 | 1 | 1 | 0.01% | 0.02% | 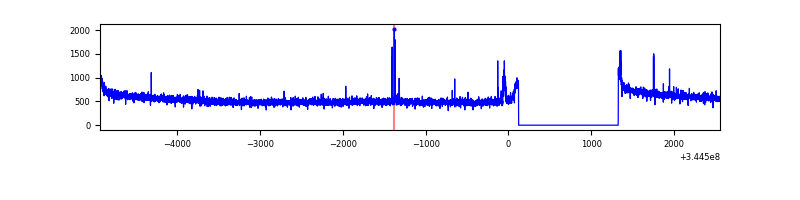 |
| C | 7495 | 6290 | 10 | 10 | 0.13% | 0.16% | 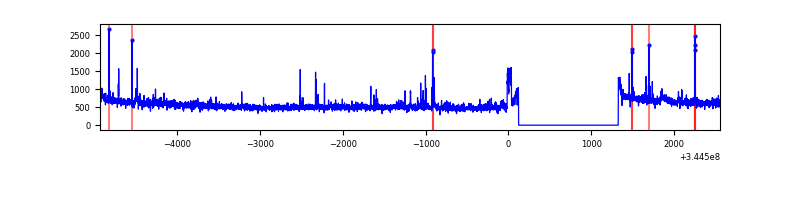 |
| D | 7495 | 6290 | 198 | 198 | 2.64% | 3.15% | 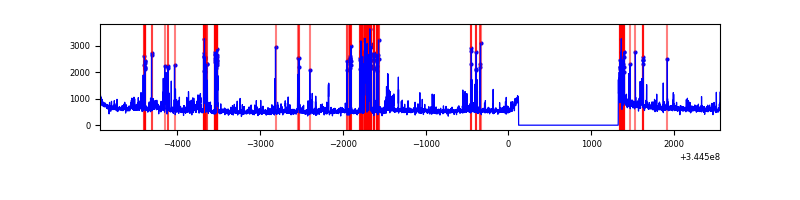 |
Top three noisy pixels from each quadrant. If the there are fewer than three noisy pixels in the level2.evt file, extra rows are filled as -1
| Pixel properties | Quadrant properties | ||||||
|---|---|---|---|---|---|---|---|
| Quadrant | DetID | PixID | Counts | Sigma | Mean | Median | Sigma |
| A | 8 | 192 | 10295 | 55.43 | 866 | 853 | 170.3 |
| A | 13 | 254 | 8481 | 44.78 | 866 | 853 | 170.3 |
| A | 3 | 137 | 7923 | 41.51 | 866 | 853 | 170.3 |
| B | 10 | 245 | 21908 | 128.91 | 867 | 848 | 163.4 |
| B | 12 | 111 | 20168 | 118.26 | 867 | 848 | 163.4 |
| B | 11 | 111 | 18157 | 105.95 | 867 | 848 | 163.4 |
| C | 3 | 233 | 169696 | 861.25 | 844 | 853 | 196.0 |
| C | 14 | 238 | 137335 | 696.18 | 844 | 853 | 196.0 |
| C | 2 | 16 | 64465 | 324.48 | 844 | 853 | 196.0 |
| D | 1 | 52 | 932464 | 4743.36 | 834 | 817 | 196.4 |
| D | 8 | 195 | 228929 | 1161.4 | 834 | 817 | 196.4 |
| D | 7 | 223 | 45194 | 225.94 | 834 | 817 | 196.4 |
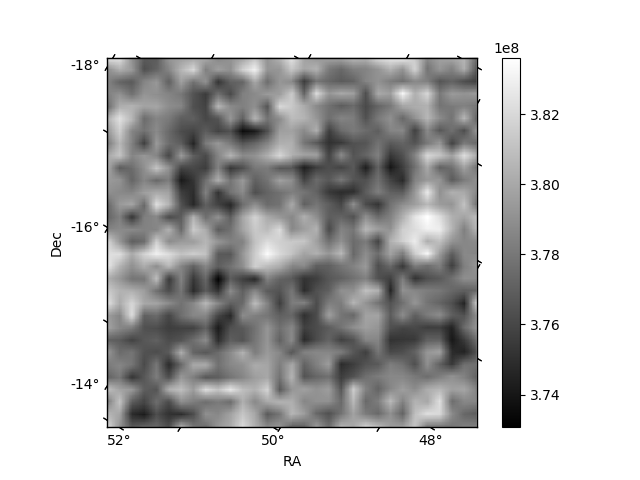
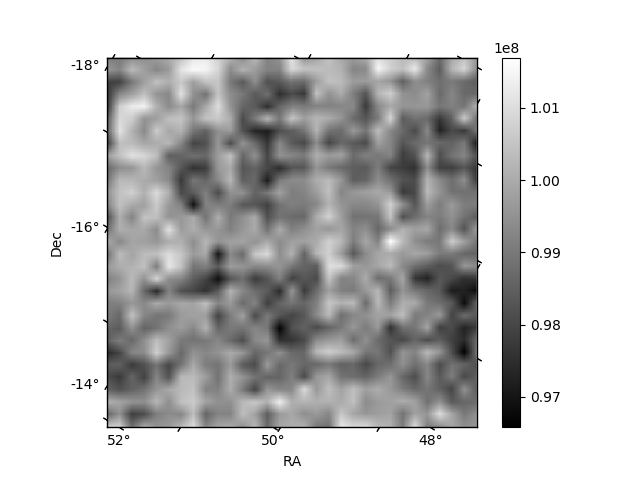
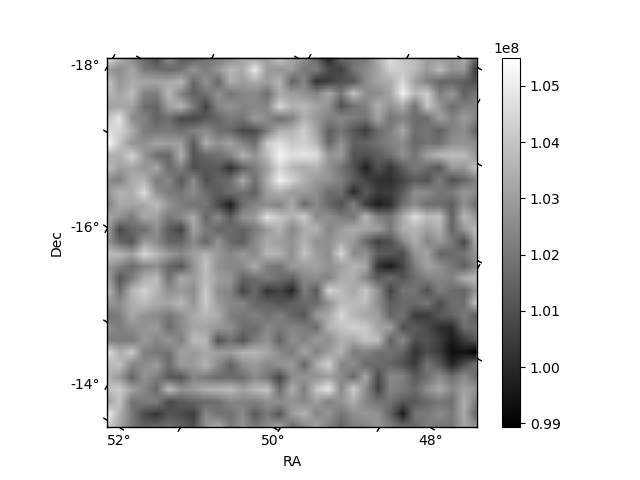
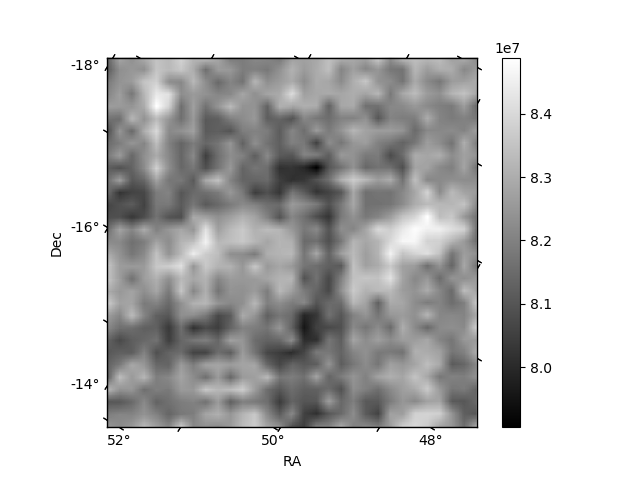
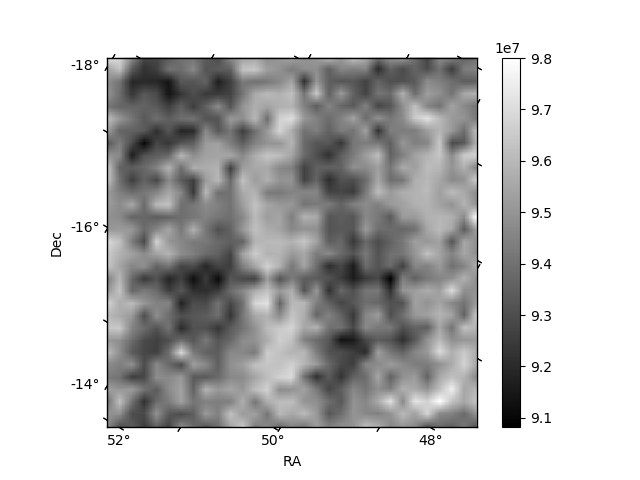
Histogram calculated using DETX and DETY for each event in the final _common_clean file
| Quadrant A | 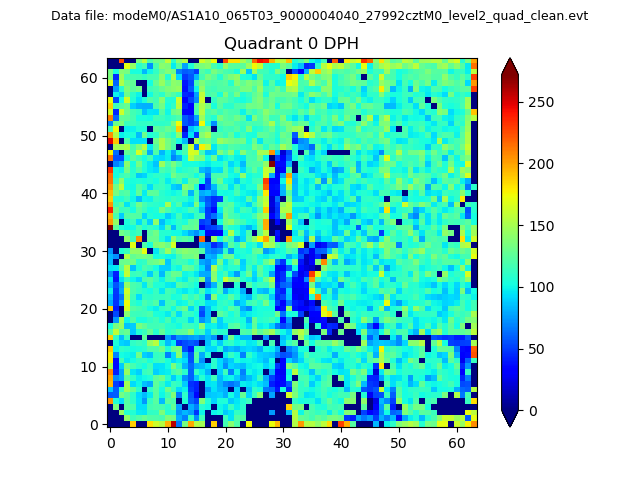 |
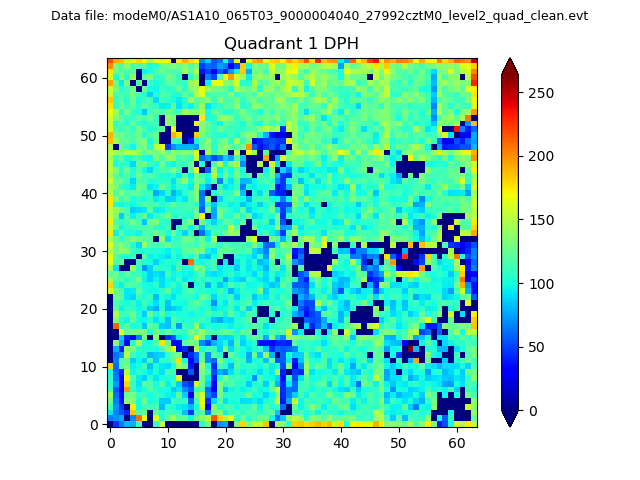 |
Quadrant B |
|---|---|---|---|
| Quadrant D | 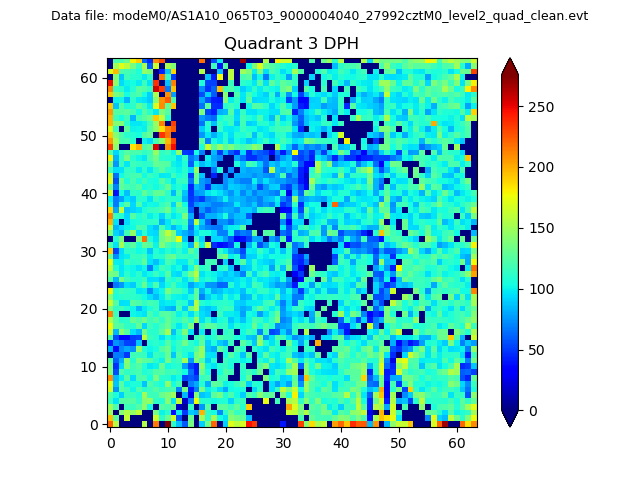 |
 |
Quadrant C |
| Plot type | Count rate plots | Images |
|---|---|---|
| Comparison with Poisson distribution Blue bars denote a histogram of data divided into 1 sec bins. Red curve is a Poisson curve with rate = median count rate of data. |
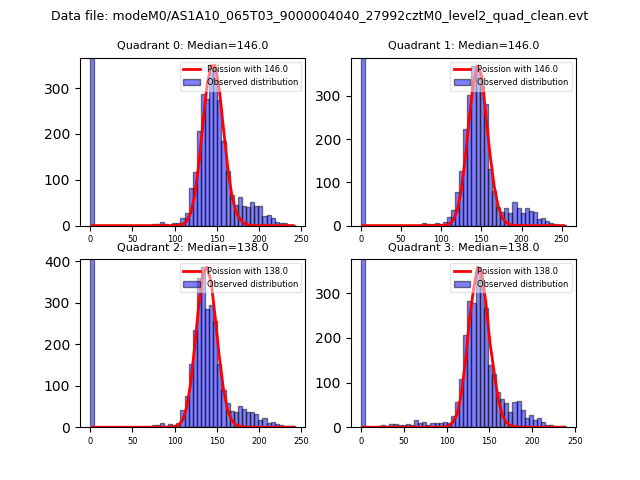 |
 |
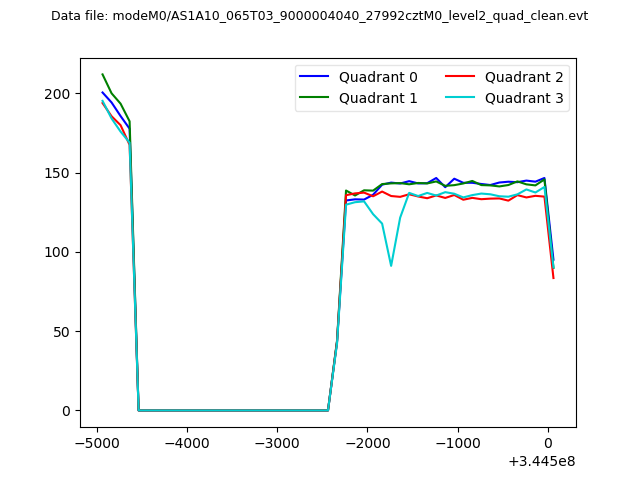
| Quadrant-wise count rates Data is divided into 100 sec bins |
 |
|
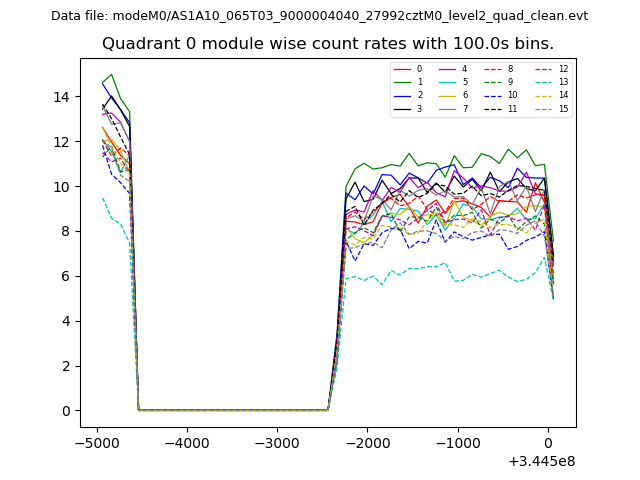
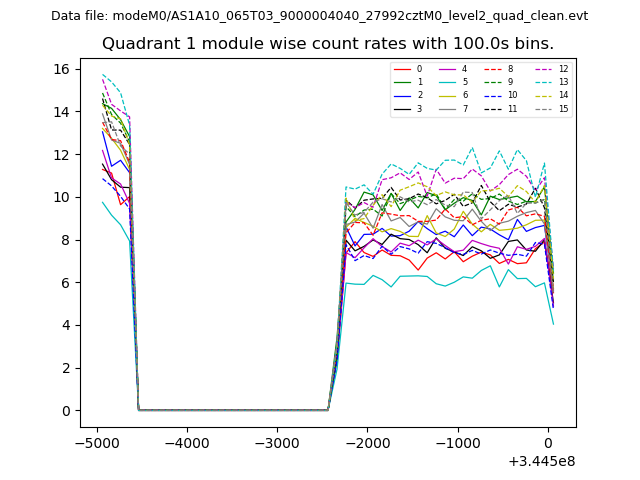
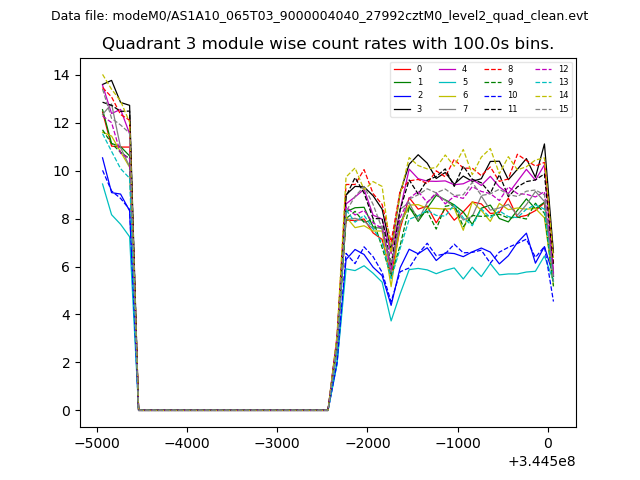
| Module-wise count rates for Quadrant A Data is divided into 100 sec bins |
 |
 |
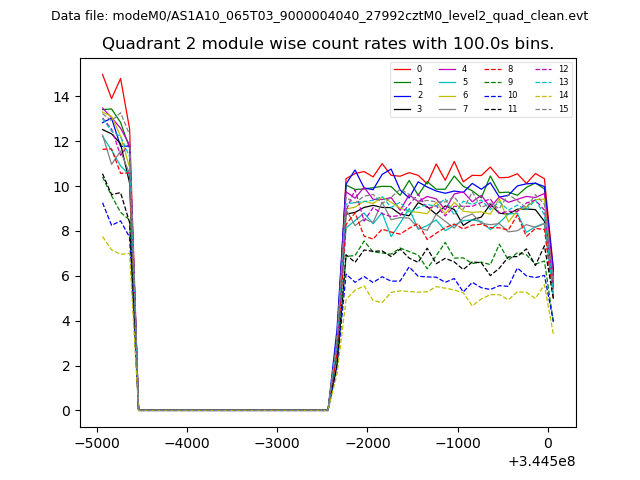
| Module-wise count rates for Quadrant B Data is divided into 100 sec bins |
 |
 |
| Module-wise count rates for Quadrant C Data is divided into 100 sec bins |
 |
 |
| Module-wise count rates for Quadrant D Data is divided into 100 sec bins |
 |
 |
| Parameter | Plot |
|---|---|
| CZT HV Monitor | 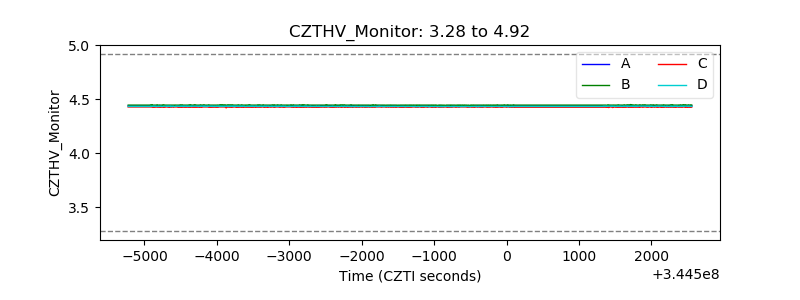 |
| D_VDD | 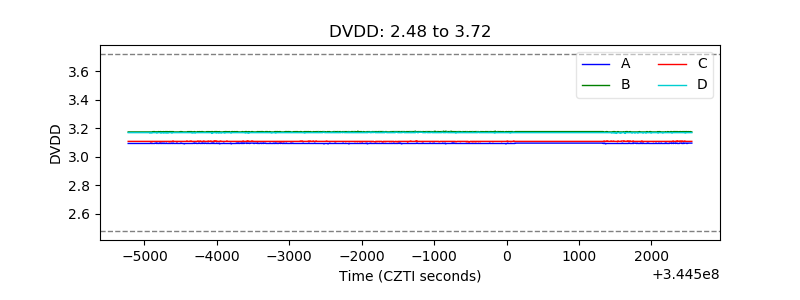 |
| Temperature 1 | 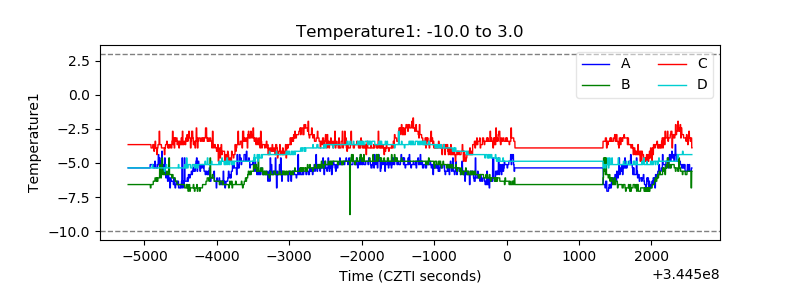 |
| Veto HV Monitor |  |
| Veto LLD | 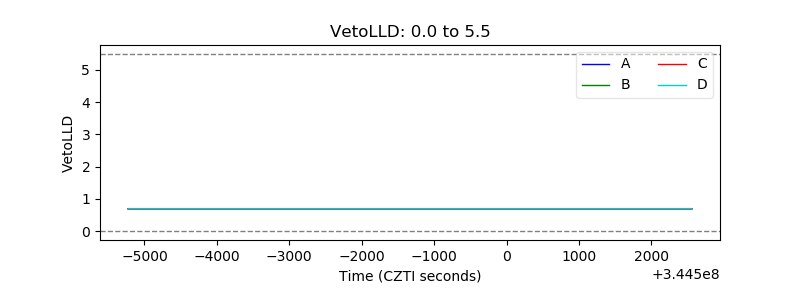 |
| Alpha Counter | 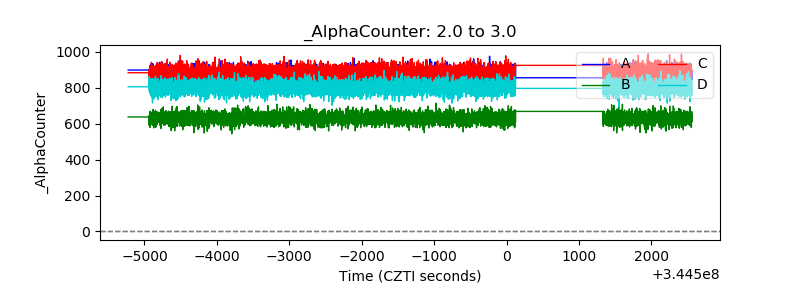 |
| _CPM_Rate | 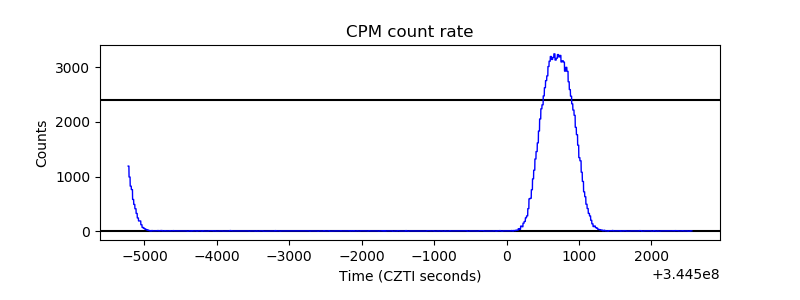 |
| CZT Counter | 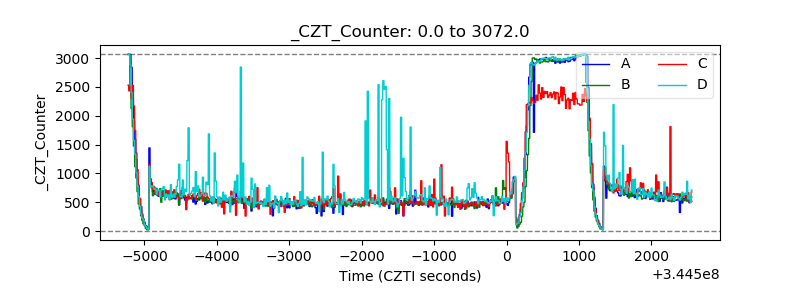 |
| +2.5 Volts monitor | 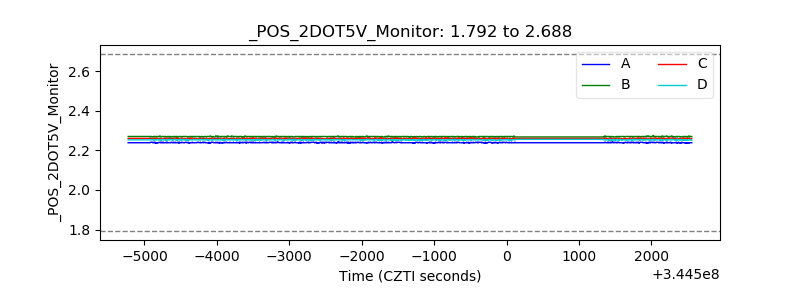 |
| +5 Volts monitor |  |
| _ROLL_ROT | 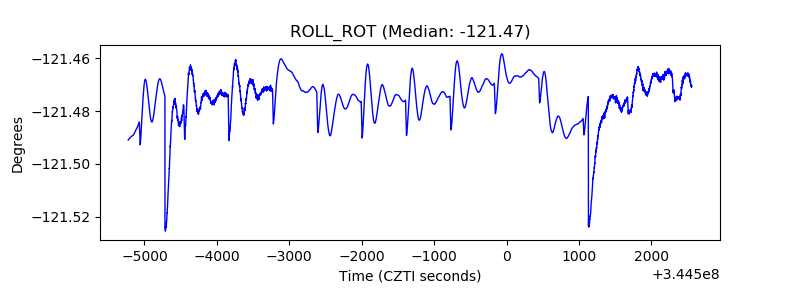 |
| _Roll_DEC | 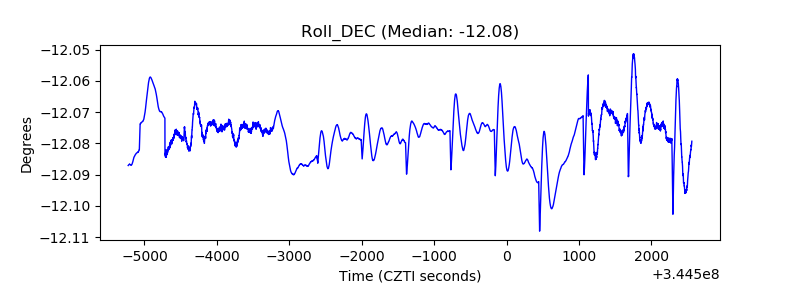 |
| _Roll_RA | 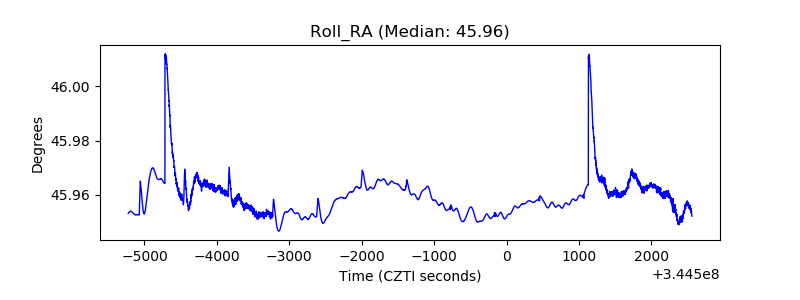 |
| Veto Counter | 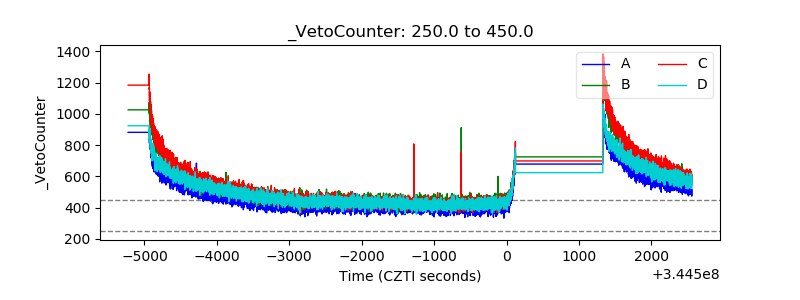 |