| Param | Original file | Final file |
|---|---|---|
| Filename | modeM0/AS1A10_065T03_9000004040_27993cztM0_level2.evt | modeM0/AS1A10_065T03_9000004040_27993cztM0_level2_quad_clean.evt |
| Size (bytes) | 534,026,880 | 66,899,520 |
| Size | 509.3 MB | 63.8 MB |
| Events in quadrant A | 3,504,574 | 410,240 |
| Events in quadrant B | 3,726,286 | 408,506 |
| Events in quadrant C | 3,905,988 | 387,979 |
| Events in quadrant D | 4,615,207 | 384,993 |
| Mode M9 | |||
|---|---|---|---|
| Quadrant | BADHDUFLAG | Total packets | Discarded packets |
| A | 0 | 13 | 0 |
| B | 0 | 14 | 0 |
| C | 0 | 14 | 0 |
| D | 0 | 14 | 0 |
| Mode M0 | |||
|---|---|---|---|
| Quadrant | BADHDUFLAG | Total packets | Discarded packets |
| A | 0 | 14285 | 0 |
| B | 0 | 15080 | 0 |
| C | 0 | 15824 | 0 |
| D | 0 | 18266 | 0 |
| Quadrant | Total seconds | Saturated seconds | Saturation percentage |
|---|---|---|---|
| A | 6217 | 49 | 0.788161% |
| B | 6216 | 102 | 1.640927% |
| C | 6216 | 173 | 2.783140% |
| D | 6216 | 145 | 2.332690% |
Noise dominated data is calculated using 1-second bins in cleaned event files. If a bin has >2000 counts, and if more than 50% of those come from <1% of pixels, then it is considered to be noise-dominated and hence unusable.
| Quadrant | # 1 sec bins | Bins with >0 counts | Bins with >2000 counts | High rate bins dominated by noise | Noise dominated (total time) | Noise dominated (detector-on time) | Marked lightcurve |
|---|---|---|---|---|---|---|---|
| A | 7532 | 6217 | 2 | 2 | 0.03% | 0.03% | 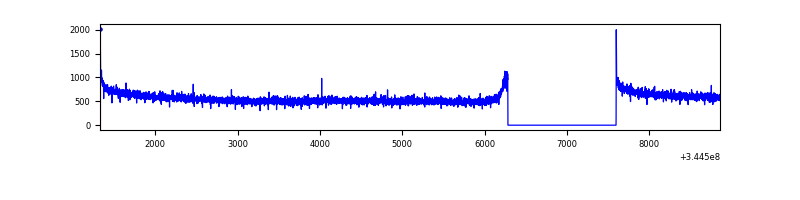 |
| B | 7531 | 6216 | 23 | 23 | 0.31% | 0.37% | 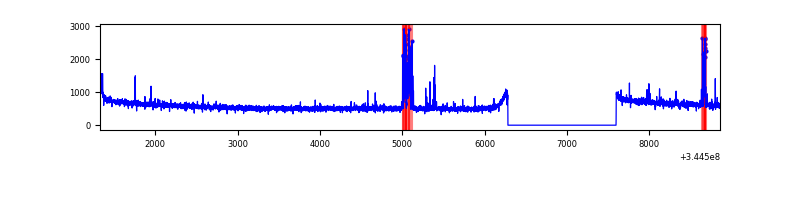 |
| C | 7531 | 6216 | 26 | 26 | 0.35% | 0.42% | 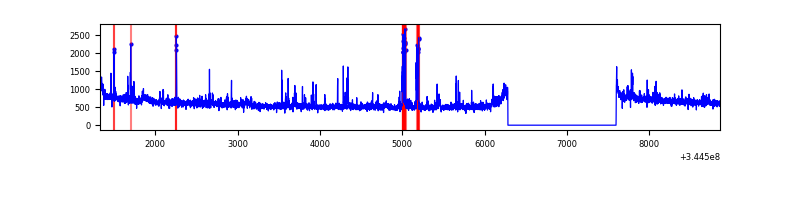 |
| D | 7531 | 6216 | 85 | 85 | 1.13% | 1.37% | 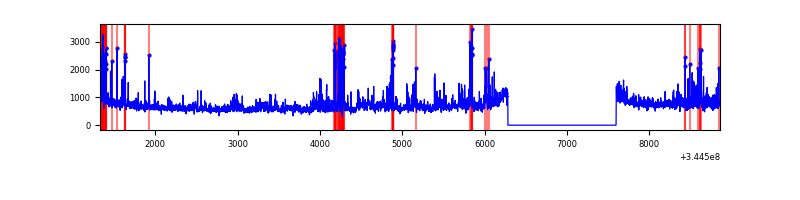 |
Top three noisy pixels from each quadrant. If the there are fewer than three noisy pixels in the level2.evt file, extra rows are filled as -1
| Pixel properties | Quadrant properties | ||||||
|---|---|---|---|---|---|---|---|
| Quadrant | DetID | PixID | Counts | Sigma | Mean | Median | Sigma |
| A | 8 | 192 | 11463 | 59.44 | 907 | 893 | 177.8 |
| A | 13 | 254 | 8921 | 45.14 | 907 | 893 | 177.8 |
| A | 3 | 137 | 7787 | 38.77 | 907 | 893 | 177.8 |
| B | 10 | 245 | 173815 | 1032.66 | 905 | 885 | 167.5 |
| B | 12 | 111 | 20338 | 116.16 | 905 | 885 | 167.5 |
| B | 11 | 111 | 18253 | 103.71 | 905 | 885 | 167.5 |
| C | 3 | 233 | 251405 | 1236.06 | 878 | 888 | 202.7 |
| C | 14 | 238 | 143840 | 705.33 | 878 | 888 | 202.7 |
| C | 2 | 16 | 52666 | 255.48 | 878 | 888 | 202.7 |
| D | 1 | 52 | 653918 | 3247.03 | 872 | 855 | 201.1 |
| D | 8 | 195 | 348411 | 1728.05 | 872 | 855 | 201.1 |
| D | 6 | 112 | 99657 | 491.24 | 872 | 855 | 201.1 |
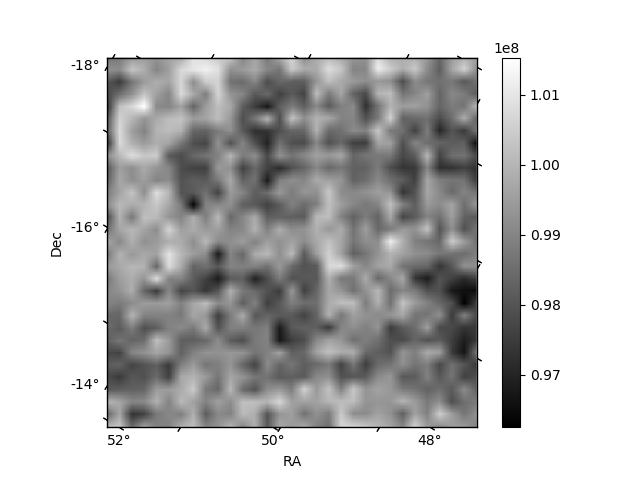
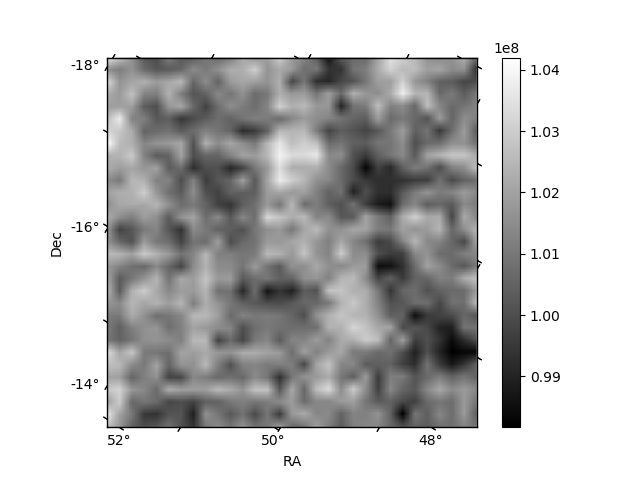
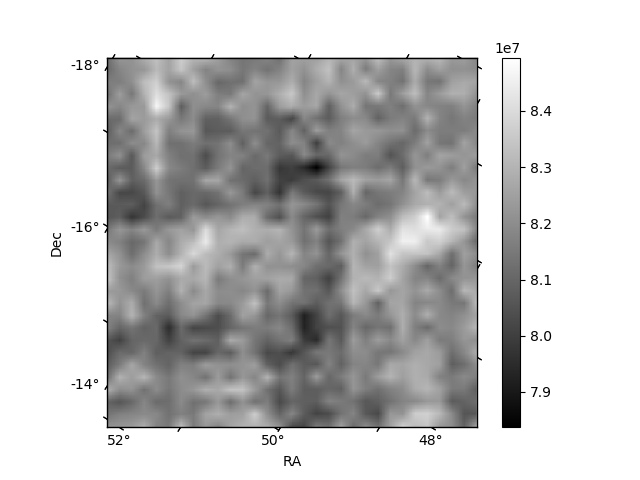
Histogram calculated using DETX and DETY for each event in the final _common_clean file
| Quadrant A |  |
 |
Quadrant B |
|---|---|---|---|
| Quadrant D | 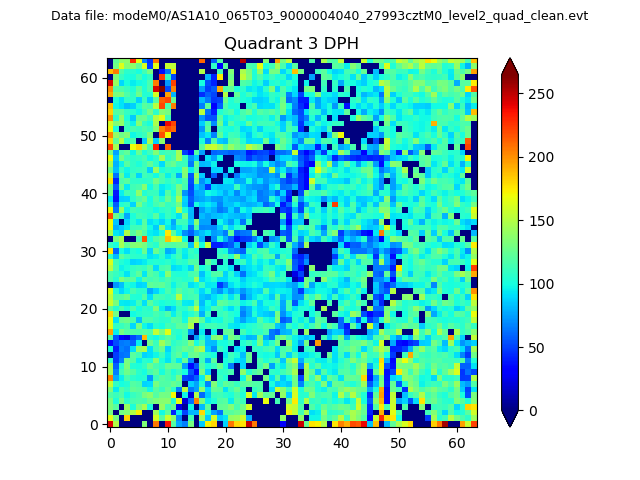 |
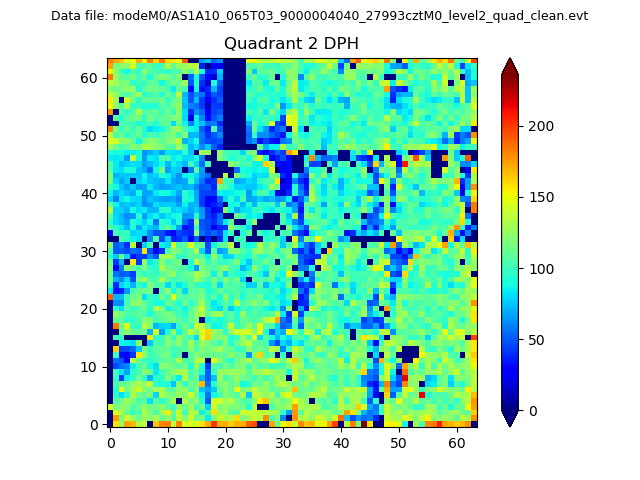 |
Quadrant C |
| Plot type | Count rate plots | Images |
|---|---|---|
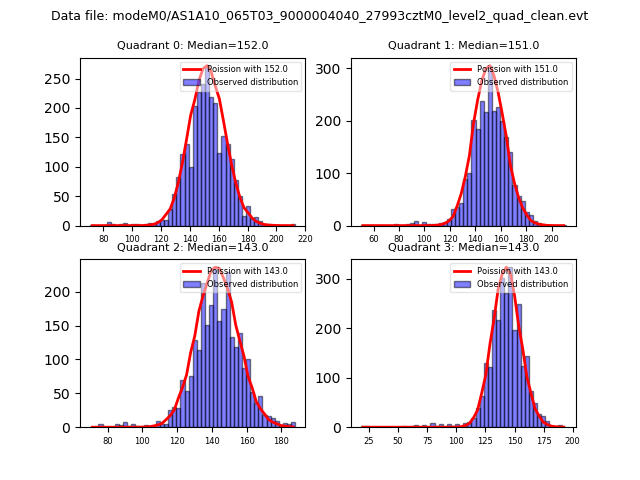
| Comparison with Poisson distribution Blue bars denote a histogram of data divided into 1 sec bins. Red curve is a Poisson curve with rate = median count rate of data. |
 |
 |
| Quadrant-wise count rates Data is divided into 100 sec bins |
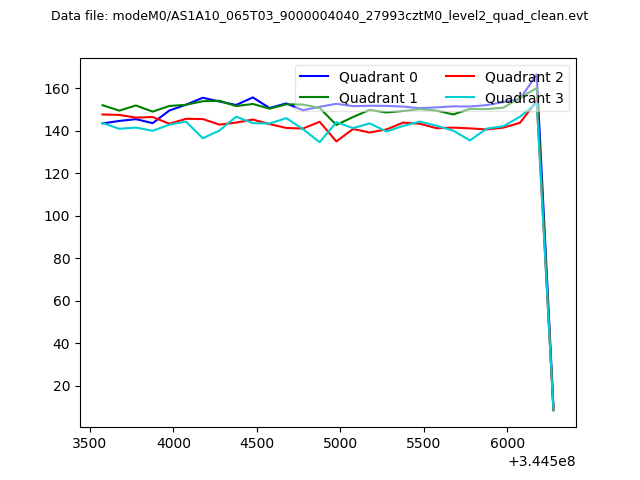 |
|
| Module-wise count rates for Quadrant A Data is divided into 100 sec bins |
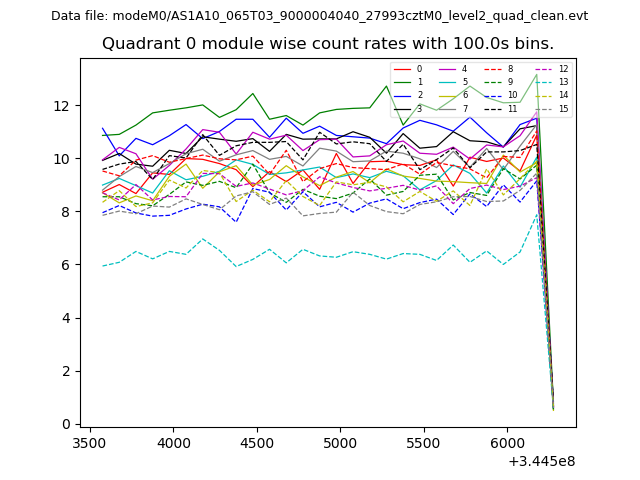 |
 |
| Module-wise count rates for Quadrant B Data is divided into 100 sec bins |
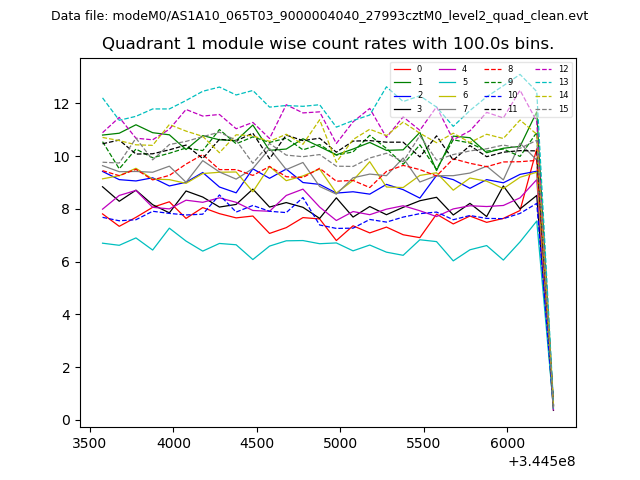 |
 |
| Module-wise count rates for Quadrant C Data is divided into 100 sec bins |
 |
 |
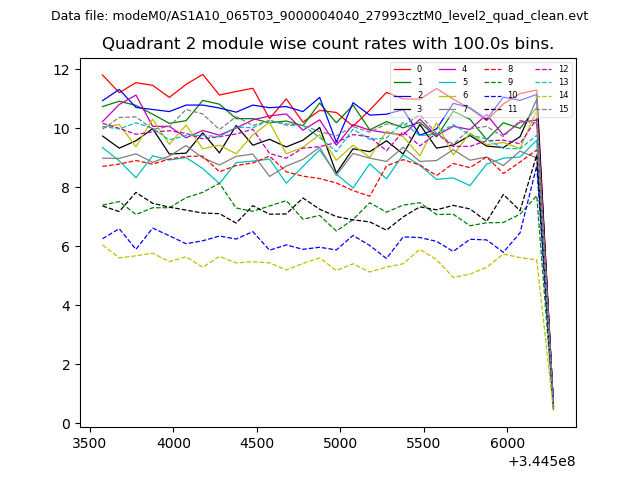
| Module-wise count rates for Quadrant D Data is divided into 100 sec bins |
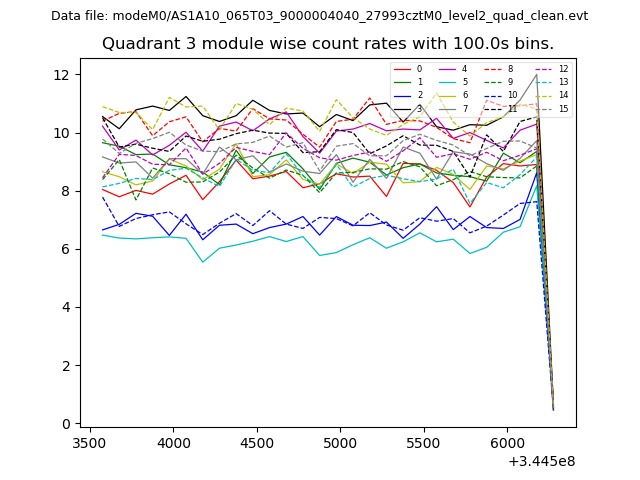 |
 |
| Parameter | Plot |
|---|---|
| CZT HV Monitor | 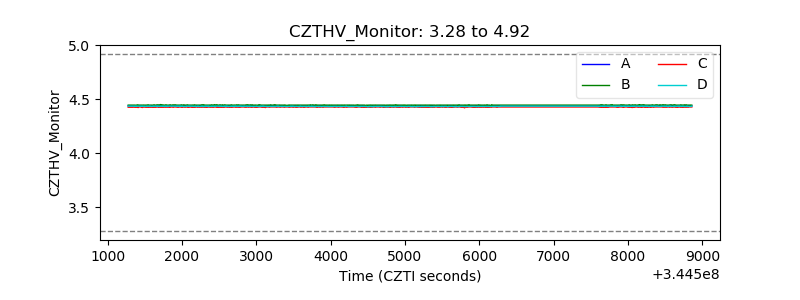 |
| D_VDD | 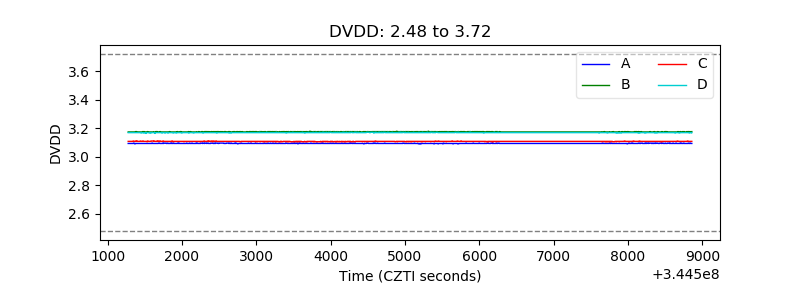 |
| Temperature 1 | 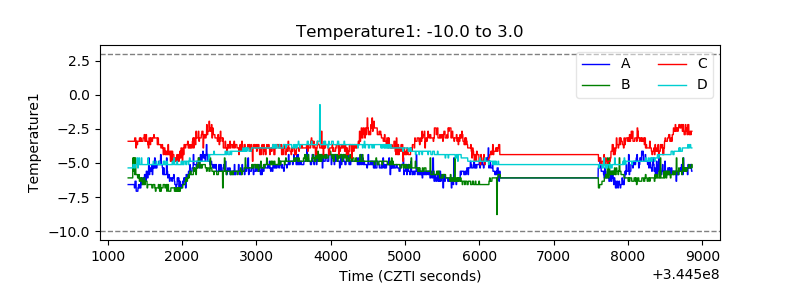 |
| Veto HV Monitor |  |
| Veto LLD | 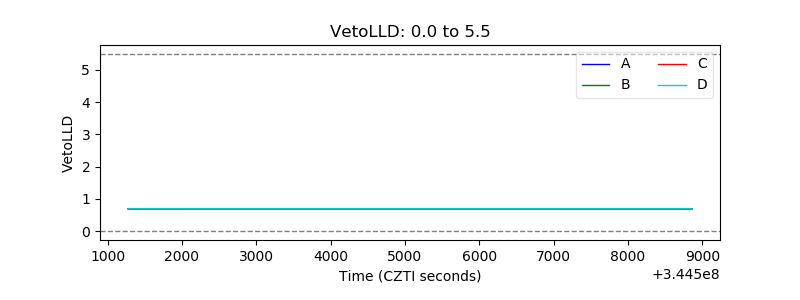 |
| Alpha Counter | 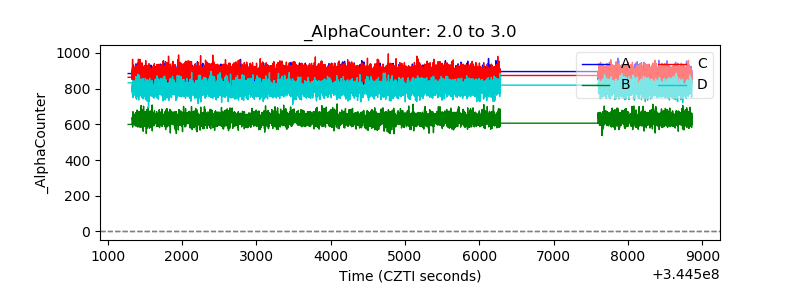 |
| _CPM_Rate |  |
| CZT Counter | 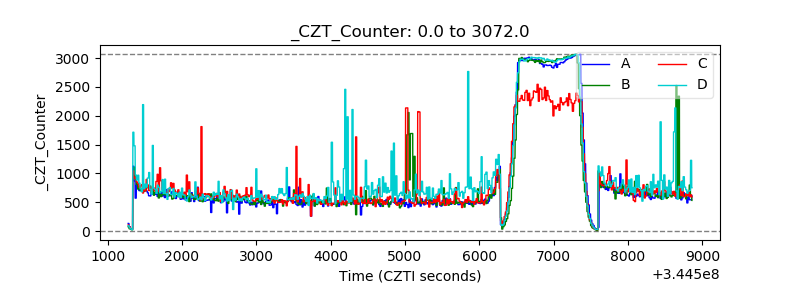 |
| +2.5 Volts monitor | 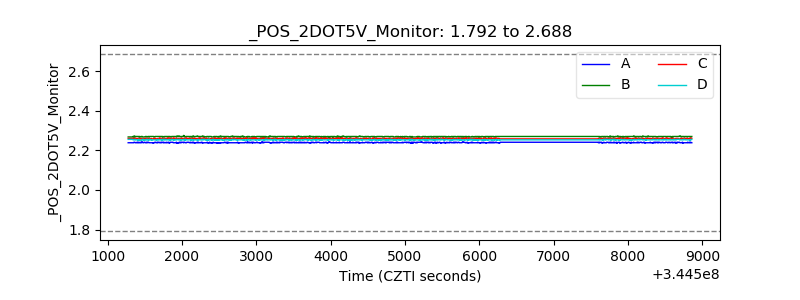 |
| +5 Volts monitor | 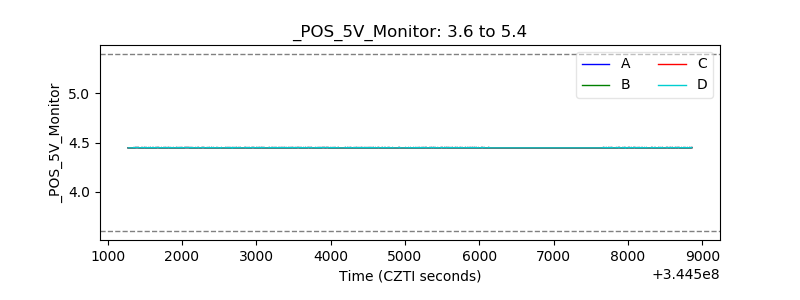 |
| _ROLL_ROT | 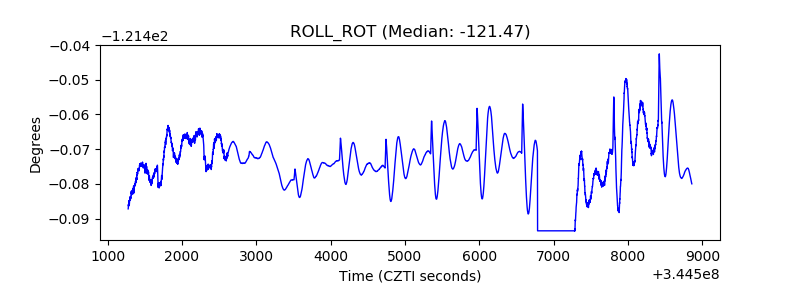 |
| _Roll_DEC |  |
| _Roll_RA | 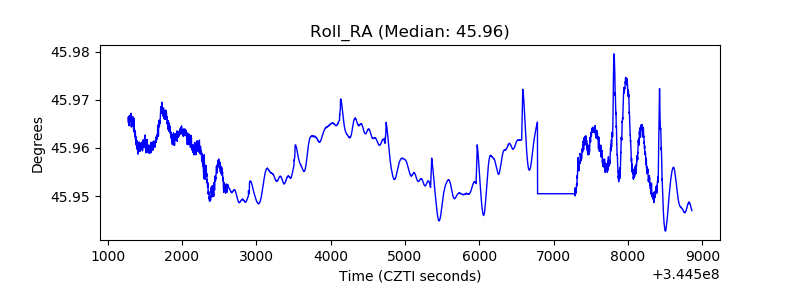 |
| Veto Counter | 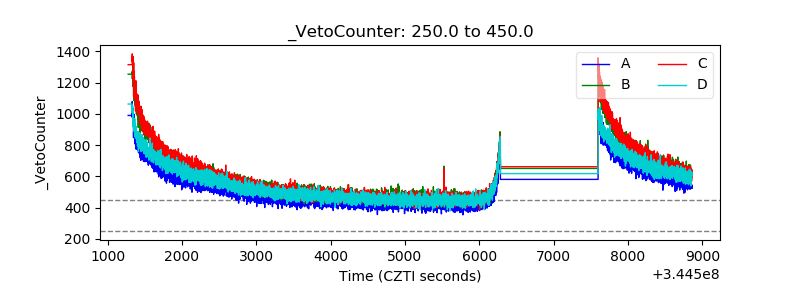 |