| Param | Original file | Final file |
|---|---|---|
| Filename | modeM0/AS1A10_065T03_9000004040_27994cztM0_level2.evt | modeM0/AS1A10_065T03_9000004040_27994cztM0_level2_quad_clean.evt |
| Size (bytes) | 522,515,520 | 76,789,440 |
| Size | 498.3 MB | 73.2 MB |
| Events in quadrant A | 3,492,972 | 488,644 |
| Events in quadrant B | 3,634,558 | 489,983 |
| Events in quadrant C | 3,786,659 | 462,914 |
| Events in quadrant D | 4,500,606 | 461,251 |
| Mode M9 | |||
|---|---|---|---|
| Quadrant | BADHDUFLAG | Total packets | Discarded packets |
| A | 0 | 8 | 0 |
| B | 0 | 9 | 0 |
| C | 0 | 9 | 0 |
| D | 0 | 9 | 0 |
| Mode M0 | |||
|---|---|---|---|
| Quadrant | BADHDUFLAG | Total packets | Discarded packets |
| A | 0 | 14196 | 0 |
| B | 0 | 14784 | 0 |
| C | 0 | 15373 | 0 |
| D | 0 | 18213 | 0 |
| Quadrant | Total seconds | Saturated seconds | Saturation percentage |
|---|---|---|---|
| A | 6038 | 101 | 1.672739% |
| B | 6036 | 139 | 2.302850% |
| C | 6037 | 201 | 3.329468% |
| D | 6036 | 106 | 1.756130% |
Noise dominated data is calculated using 1-second bins in cleaned event files. If a bin has >2000 counts, and if more than 50% of those come from <1% of pixels, then it is considered to be noise-dominated and hence unusable.
| Quadrant | # 1 sec bins | Bins with >0 counts | Bins with >2000 counts | High rate bins dominated by noise | Noise dominated (total time) | Noise dominated (detector-on time) | Marked lightcurve |
|---|---|---|---|---|---|---|---|
| A | 7498 | 6061 | 0 | 0 | 0.00% | 0.00% | 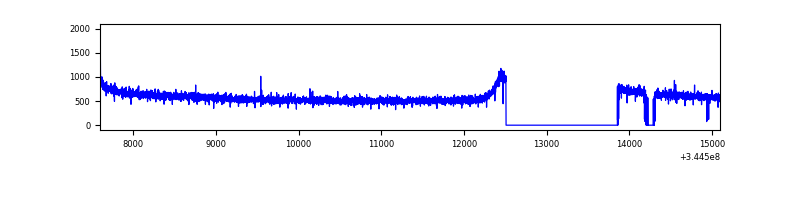 |
| B | 7497 | 6055 | 16 | 16 | 0.21% | 0.26% | 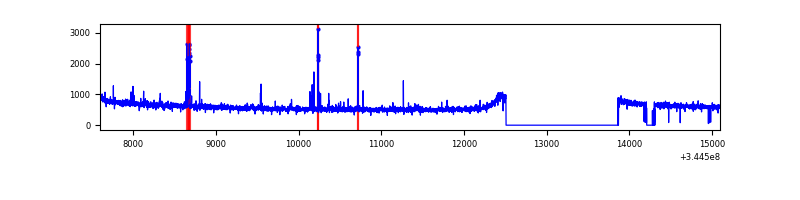 |
| C | 7497 | 6054 | 6 | 6 | 0.08% | 0.10% | 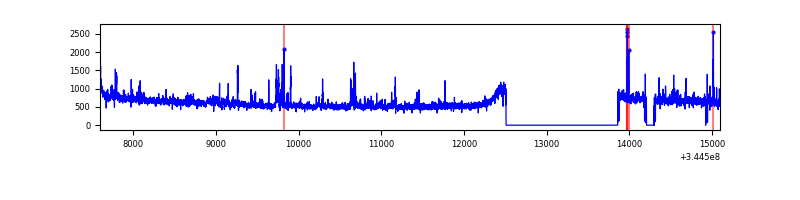 |
| D | 7497 | 6054 | 19 | 19 | 0.25% | 0.31% | 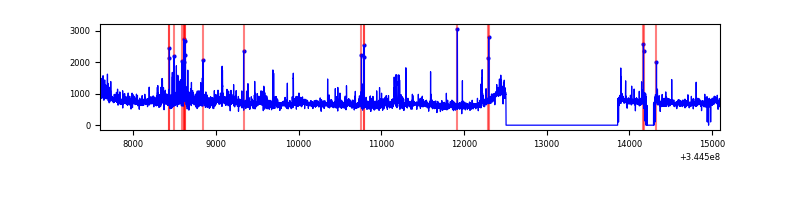 |
Top three noisy pixels from each quadrant. If the there are fewer than three noisy pixels in the level2.evt file, extra rows are filled as -1
| Pixel properties | Quadrant properties | ||||||
|---|---|---|---|---|---|---|---|
| Quadrant | DetID | PixID | Counts | Sigma | Mean | Median | Sigma |
| A | 13 | 254 | 8721 | 43.99 | 905 | 891 | 178.0 |
| A | 3 | 137 | 7799 | 38.81 | 905 | 891 | 178.0 |
| A | 0 | 226 | 7643 | 37.93 | 905 | 891 | 178.0 |
| B | 10 | 245 | 90224 | 530.63 | 899 | 879 | 168.4 |
| B | 12 | 111 | 19862 | 112.74 | 899 | 879 | 168.4 |
| B | 4 | 52 | 18418 | 104.16 | 899 | 879 | 168.4 |
| C | 3 | 233 | 194544 | 976.74 | 865 | 874 | 198.3 |
| C | 14 | 238 | 141698 | 710.22 | 865 | 874 | 198.3 |
| C | 2 | 16 | 56790 | 282.0 | 865 | 874 | 198.3 |
| D | 1 | 52 | 596747 | 2935.46 | 870 | 851 | 203.0 |
| D | 8 | 195 | 376345 | 1849.73 | 870 | 851 | 203.0 |
| D | 7 | 80 | 101222 | 494.44 | 870 | 851 | 203.0 |
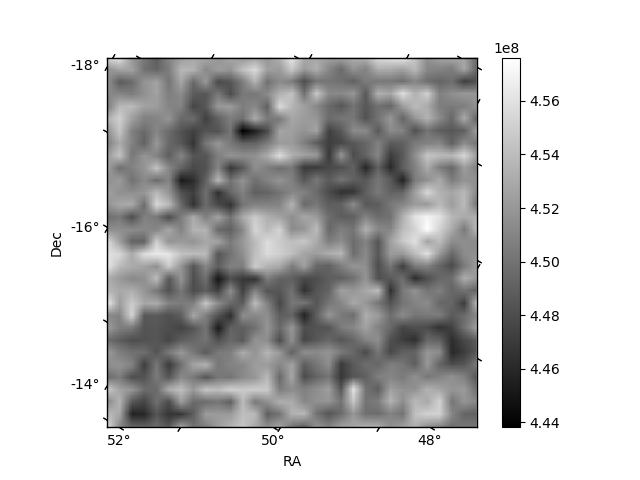
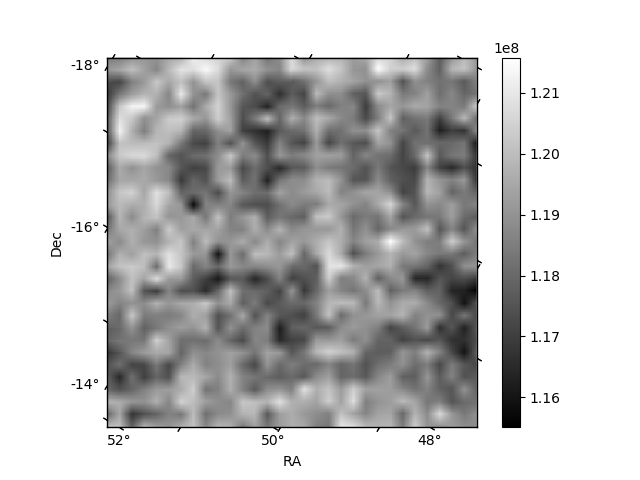
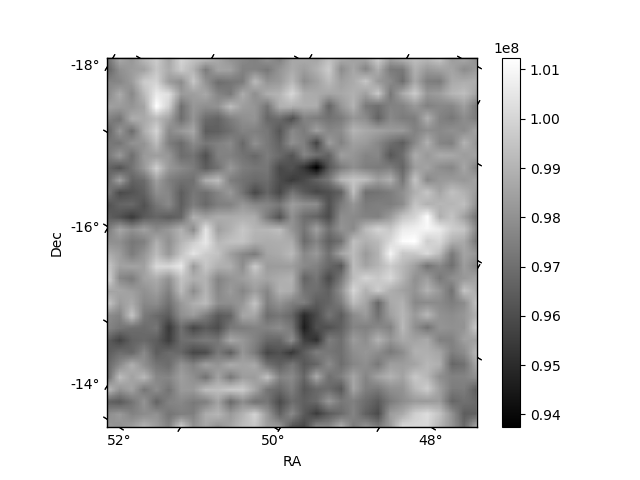
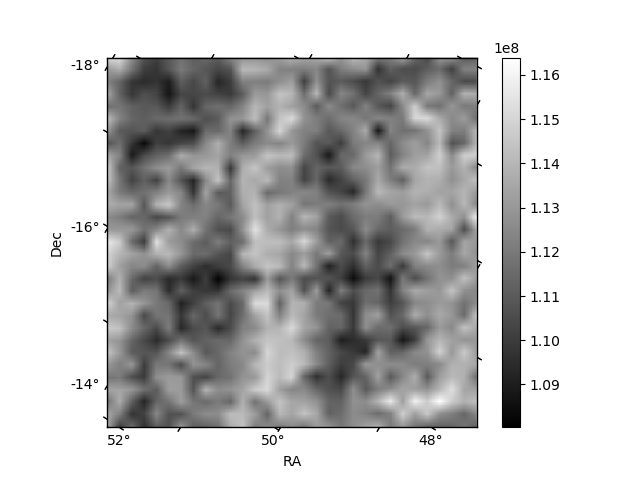
Histogram calculated using DETX and DETY for each event in the final _common_clean file
| Quadrant A | 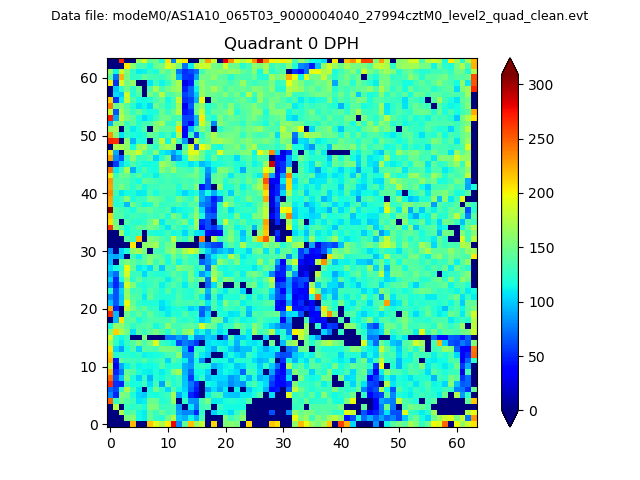 |
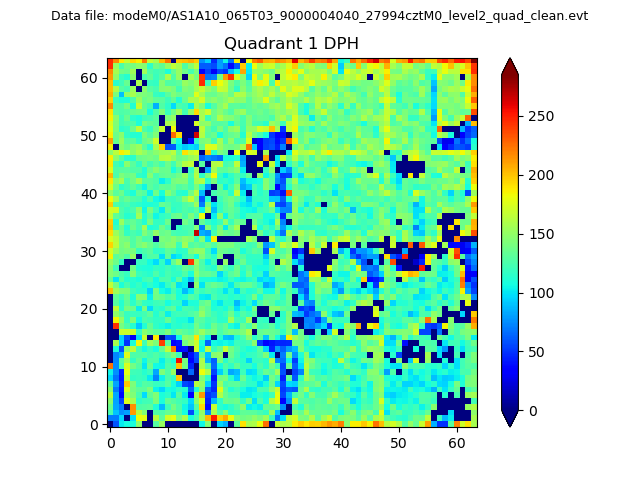 |
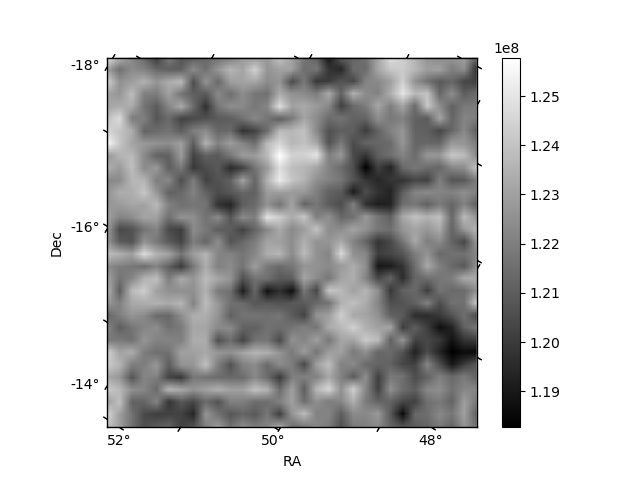
Quadrant B |
|---|---|---|---|
| Quadrant D | 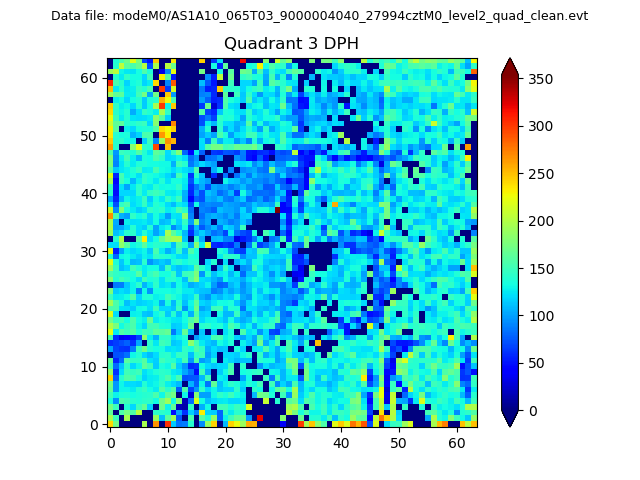 |
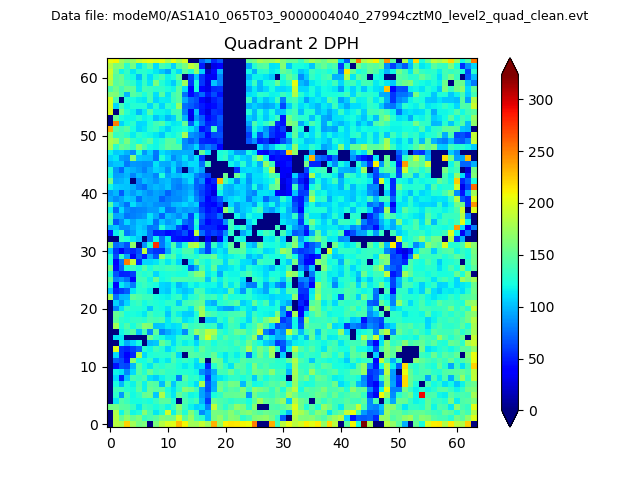 |
Quadrant C |
| Plot type | Count rate plots | Images |
|---|---|---|
| Comparison with Poisson distribution Blue bars denote a histogram of data divided into 1 sec bins. Red curve is a Poisson curve with rate = median count rate of data. |
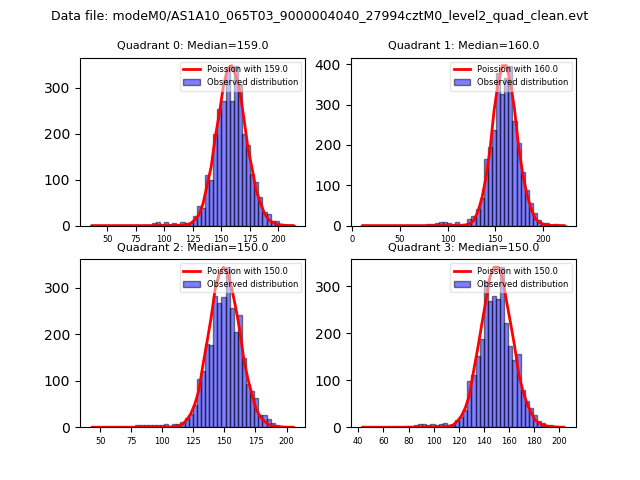 |
 |
| Quadrant-wise count rates Data is divided into 100 sec bins |
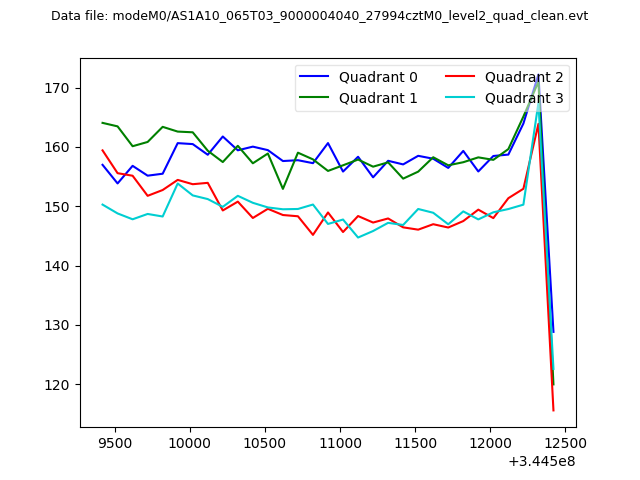 |
|
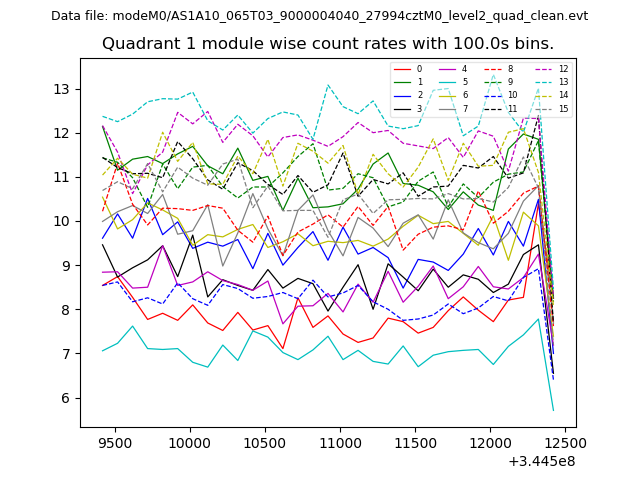
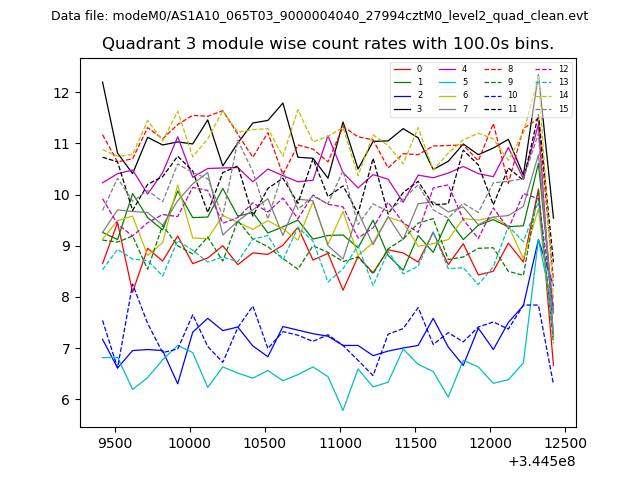
| Module-wise count rates for Quadrant A Data is divided into 100 sec bins |
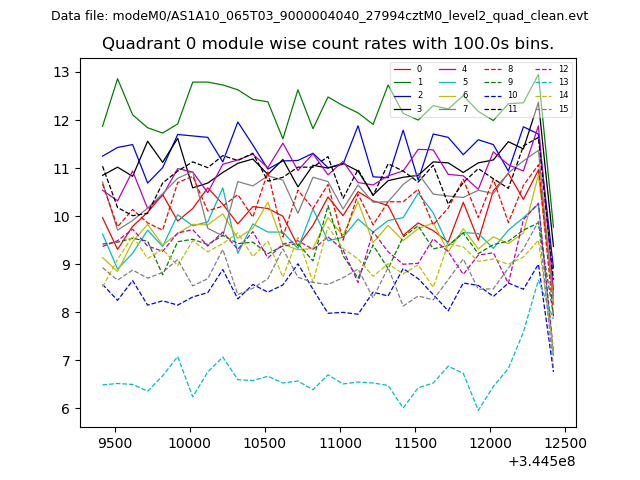 |
 |
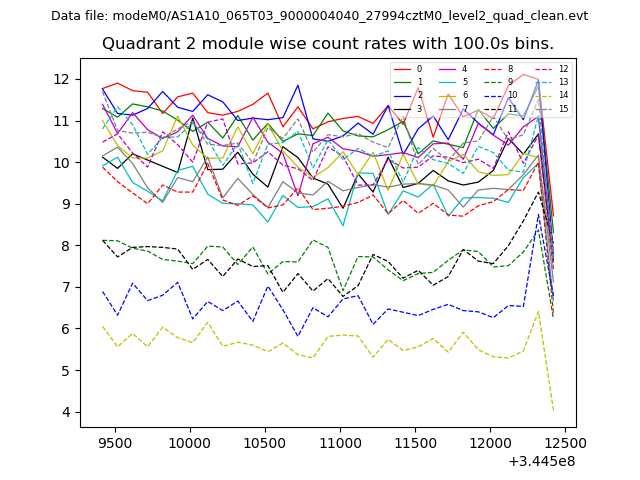
| Module-wise count rates for Quadrant B Data is divided into 100 sec bins |
 |
 |
| Module-wise count rates for Quadrant C Data is divided into 100 sec bins |
 |
 |
| Module-wise count rates for Quadrant D Data is divided into 100 sec bins |
 |
 |
| Parameter | Plot |
|---|---|
| CZT HV Monitor | 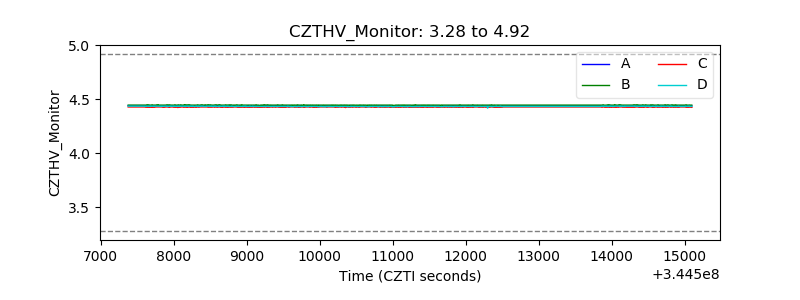 |
| D_VDD | 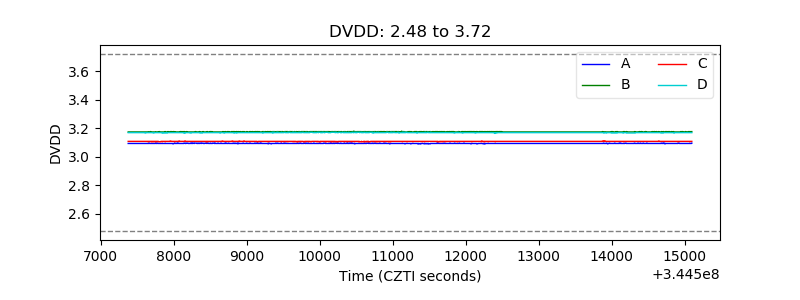 |
| Temperature 1 | 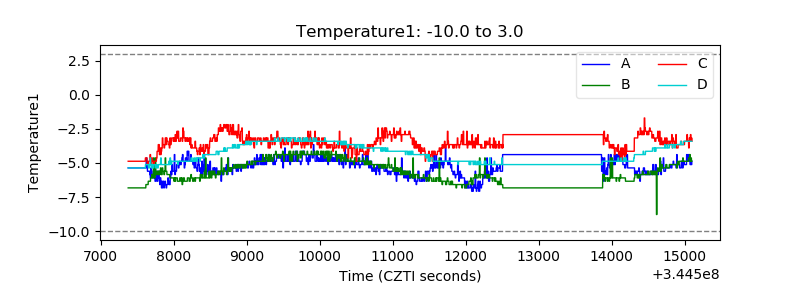 |
| Veto HV Monitor | 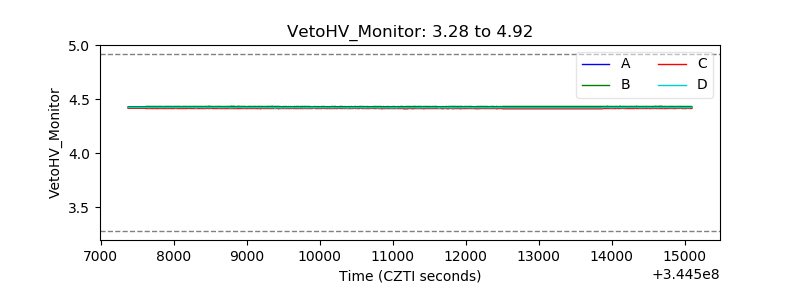 |
| Veto LLD | 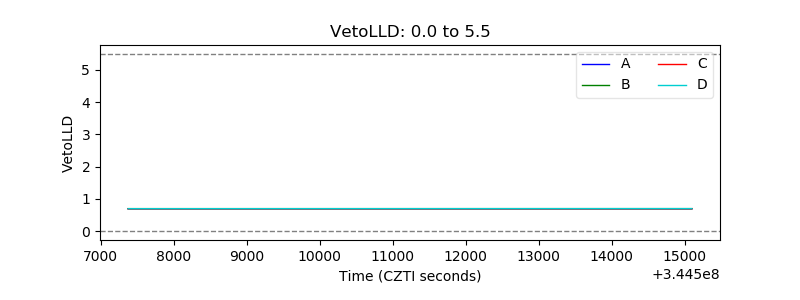 |
| Alpha Counter | 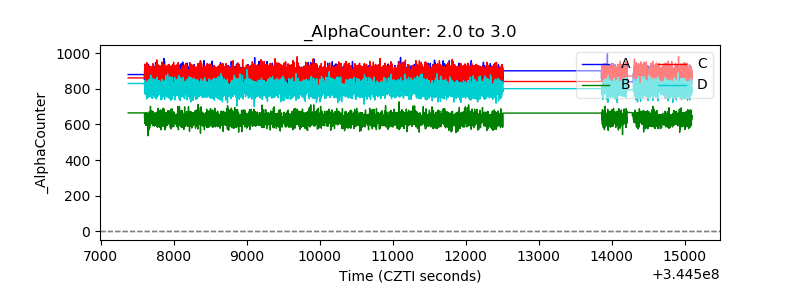 |
| _CPM_Rate | 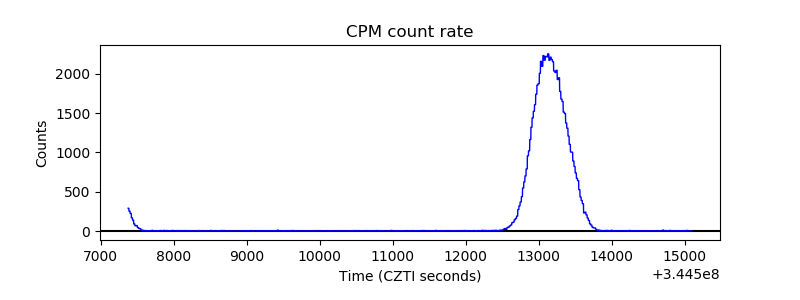 |
| CZT Counter | 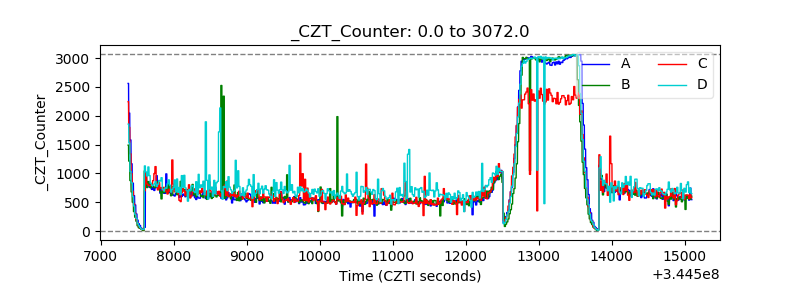 |
| +2.5 Volts monitor |  |
| +5 Volts monitor |  |
| _ROLL_ROT | 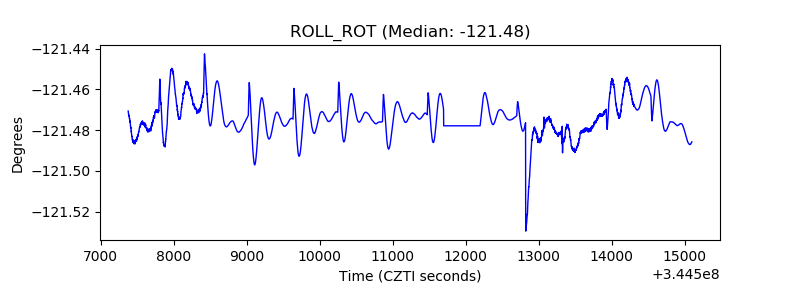 |
| _Roll_DEC | 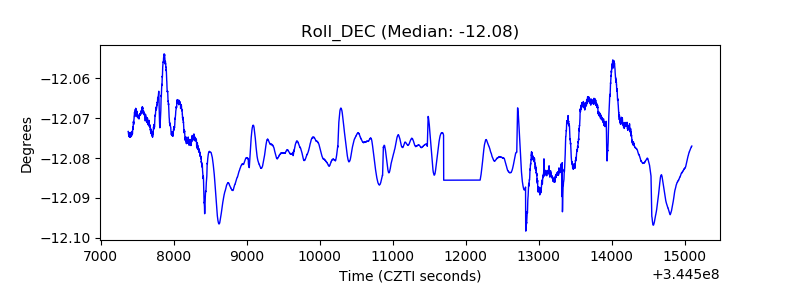 |
| _Roll_RA | 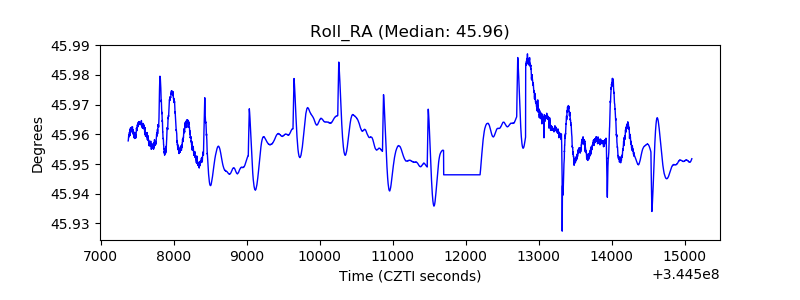 |
| Veto Counter | 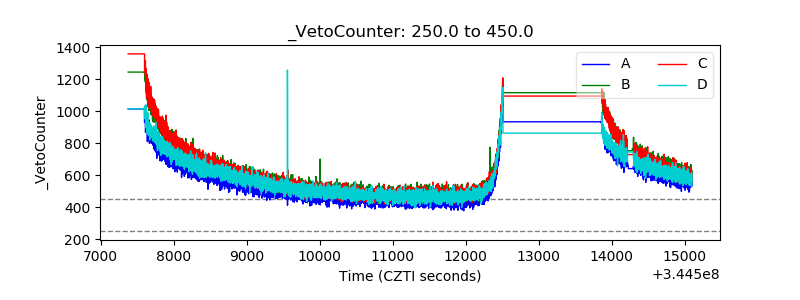 |