| Param | Original file | Final file |
|---|---|---|
| Filename | modeM0/AS1A10_065T03_9000004040_27995cztM0_level2.evt | modeM0/AS1A10_065T03_9000004040_27995cztM0_level2_quad_clean.evt |
| Size (bytes) | 587,047,680 | 98,691,840 |
| Size | 559.9 MB | 94.1 MB |
| Events in quadrant A | 3,840,331 | 657,280 |
| Events in quadrant B | 3,966,748 | 653,169 |
| Events in quadrant C | 4,263,943 | 611,124 |
| Events in quadrant D | 5,261,467 | 607,132 |
| Mode M9 | |||
|---|---|---|---|
| Quadrant | BADHDUFLAG | Total packets | Discarded packets |
| A | 0 | 26 | 0 |
| B | 0 | 26 | 0 |
| C | 0 | 26 | 0 |
| D | 0 | 26 | 0 |
| Mode M0 | |||
|---|---|---|---|
| Quadrant | BADHDUFLAG | Total packets | Discarded packets |
| A | 0 | 15675 | 0 |
| B | 0 | 16064 | 0 |
| C | 0 | 17259 | 0 |
| D | 0 | 20763 | 0 |
| Quadrant | Total seconds | Saturated seconds | Saturation percentage |
|---|---|---|---|
| A | 6594 | 185 | 2.805581% |
| B | 6594 | 255 | 3.867152% |
| C | 6594 | 349 | 5.292690% |
| D | 6594 | 222 | 3.366697% |
Noise dominated data is calculated using 1-second bins in cleaned event files. If a bin has >2000 counts, and if more than 50% of those come from <1% of pixels, then it is considered to be noise-dominated and hence unusable.
| Quadrant | # 1 sec bins | Bins with >0 counts | Bins with >2000 counts | High rate bins dominated by noise | Noise dominated (total time) | Noise dominated (detector-on time) | Marked lightcurve |
|---|---|---|---|---|---|---|---|
| A | 9234 | 6594 | 0 | 0 | 0.00% | 0.00% | 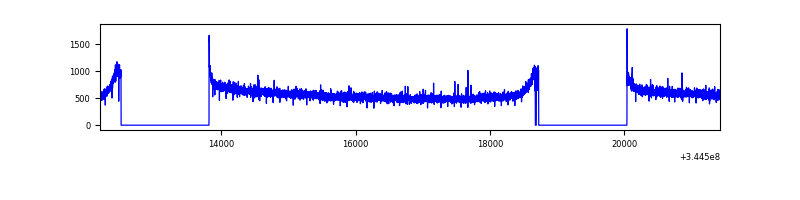 |
| B | 9234 | 6594 | 7 | 7 | 0.08% | 0.11% | 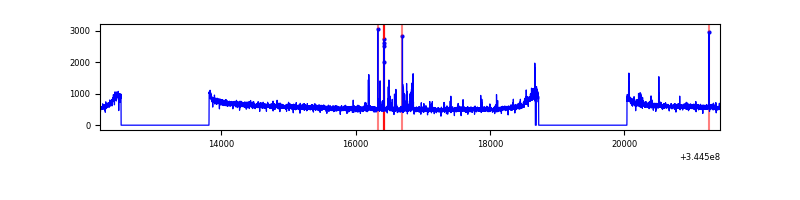 |
| C | 9234 | 6594 | 21 | 21 | 0.23% | 0.32% | 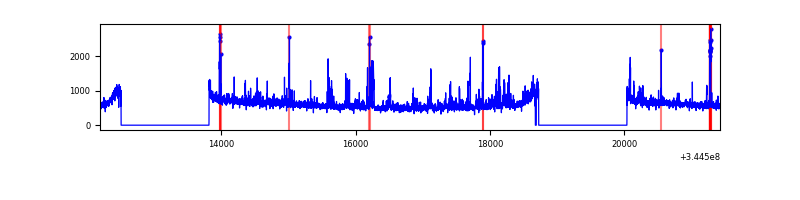 |
| D | 9234 | 6594 | 62 | 62 | 0.67% | 0.94% | 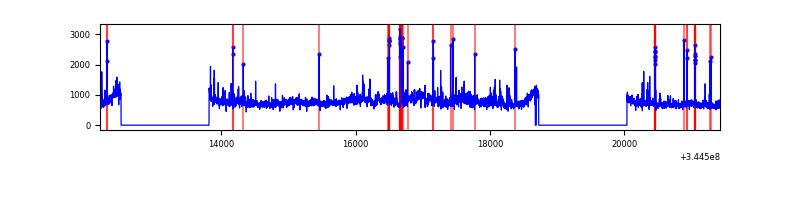 |
Top three noisy pixels from each quadrant. If the there are fewer than three noisy pixels in the level2.evt file, extra rows are filled as -1
| Pixel properties | Quadrant properties | ||||||
|---|---|---|---|---|---|---|---|
| Quadrant | DetID | PixID | Counts | Sigma | Mean | Median | Sigma |
| A | 13 | 254 | 9423 | 42.99 | 994 | 976 | 196.5 |
| A | 8 | 192 | 9381 | 42.78 | 994 | 976 | 196.5 |
| A | 3 | 137 | 8827 | 39.96 | 994 | 976 | 196.5 |
| B | 10 | 245 | 120895 | 648.93 | 978 | 955 | 184.8 |
| B | 12 | 111 | 22148 | 114.66 | 978 | 955 | 184.8 |
| B | 11 | 111 | 20252 | 104.4 | 978 | 955 | 184.8 |
| C | 3 | 233 | 307674 | 1426.05 | 935 | 945 | 215.1 |
| C | 14 | 238 | 152373 | 704.02 | 935 | 945 | 215.1 |
| C | 10 | 22 | 103304 | 475.89 | 935 | 945 | 215.1 |
| D | 1 | 52 | 648838 | 2923.83 | 948 | 927 | 221.6 |
| D | 7 | 80 | 516137 | 2324.99 | 948 | 927 | 221.6 |
| D | 8 | 195 | 464976 | 2094.11 | 948 | 927 | 221.6 |
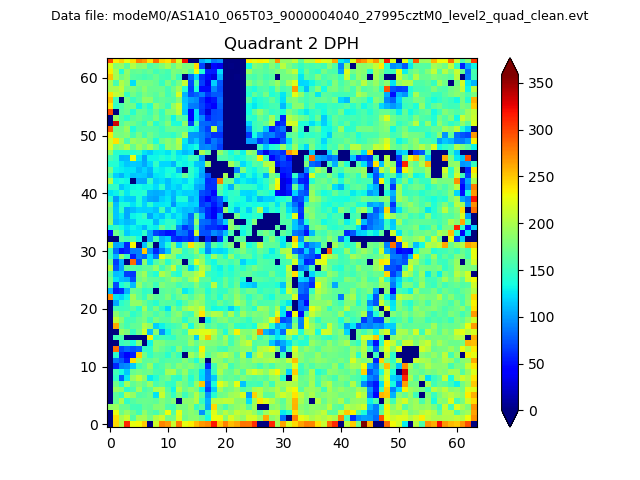
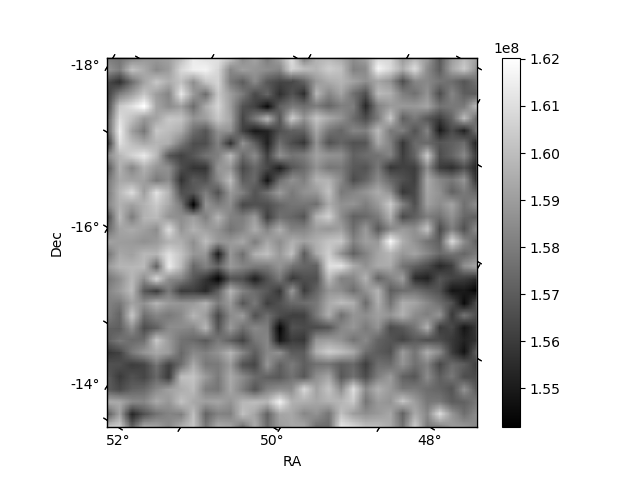
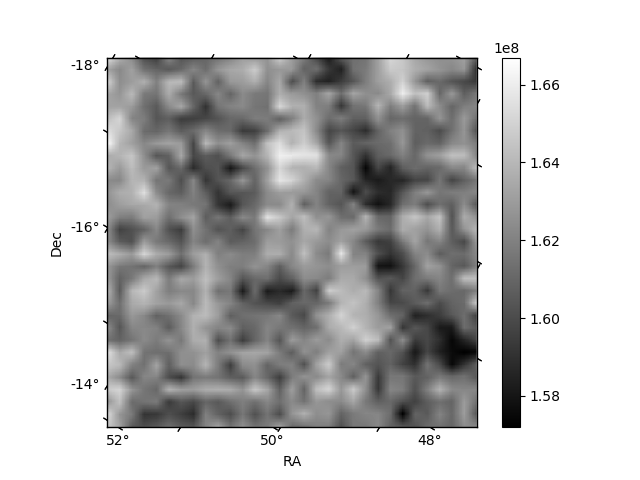
Histogram calculated using DETX and DETY for each event in the final _common_clean file
| Quadrant A | 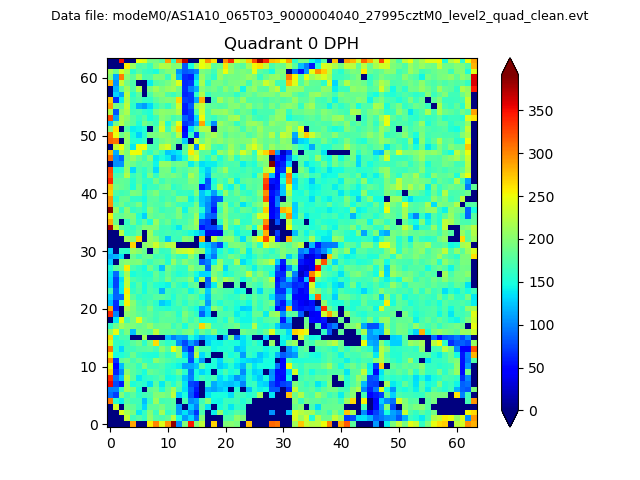 |
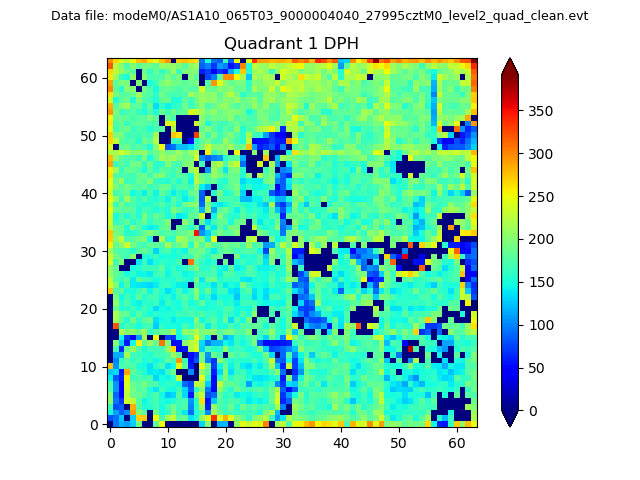 |
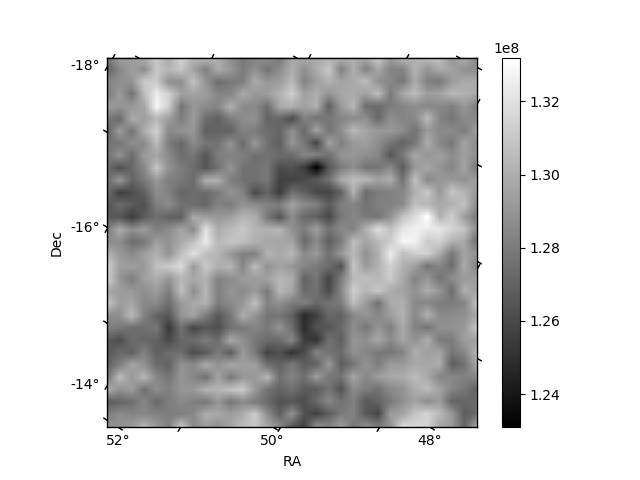
Quadrant B |
|---|---|---|---|
| Quadrant D | 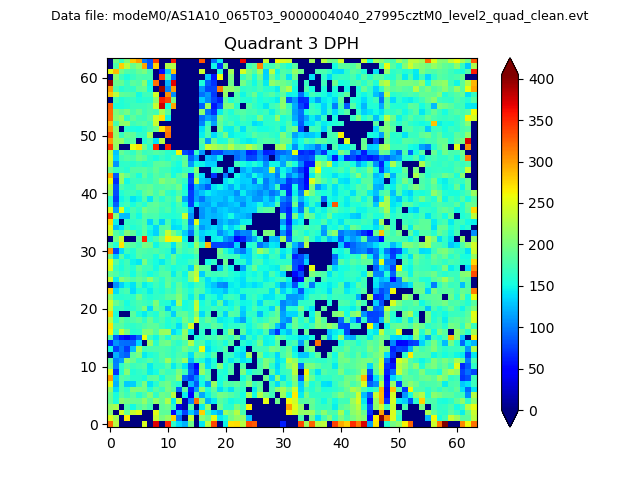 |
 |
Quadrant C |
| Plot type | Count rate plots | Images |
|---|---|---|
| Comparison with Poisson distribution Blue bars denote a histogram of data divided into 1 sec bins. Red curve is a Poisson curve with rate = median count rate of data. |
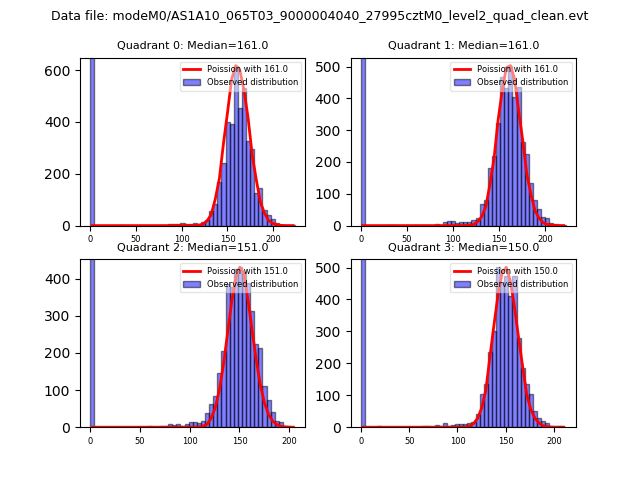 |
 |
| Quadrant-wise count rates Data is divided into 100 sec bins |
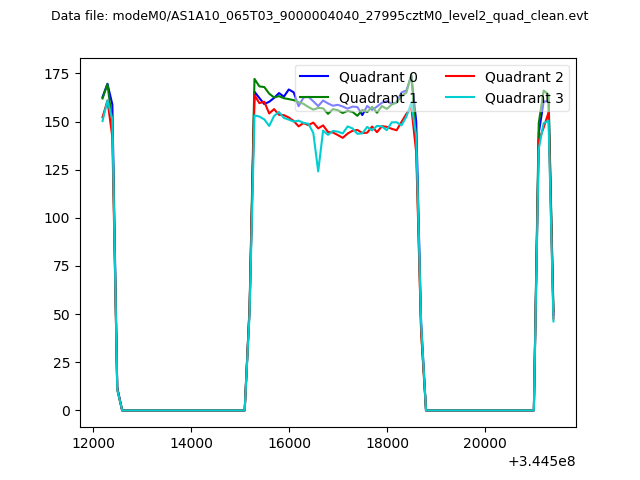 |
|
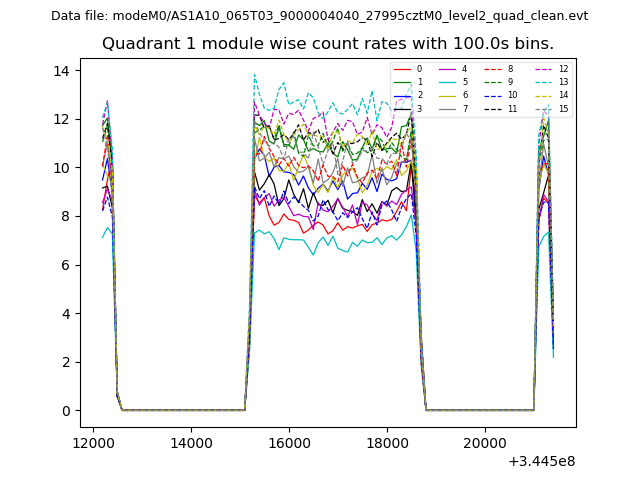
| Module-wise count rates for Quadrant A Data is divided into 100 sec bins |
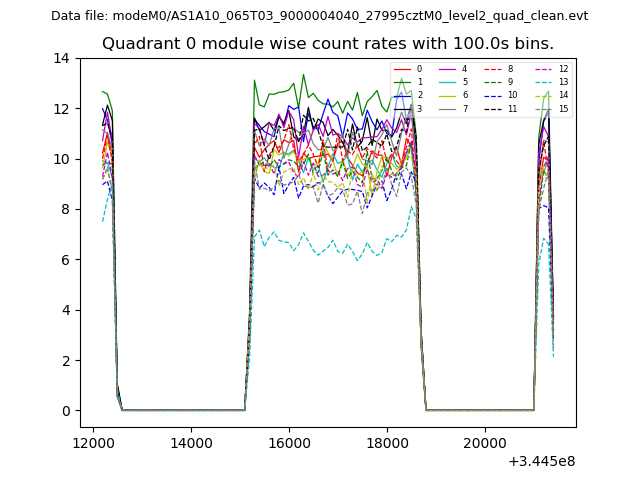 |
 |
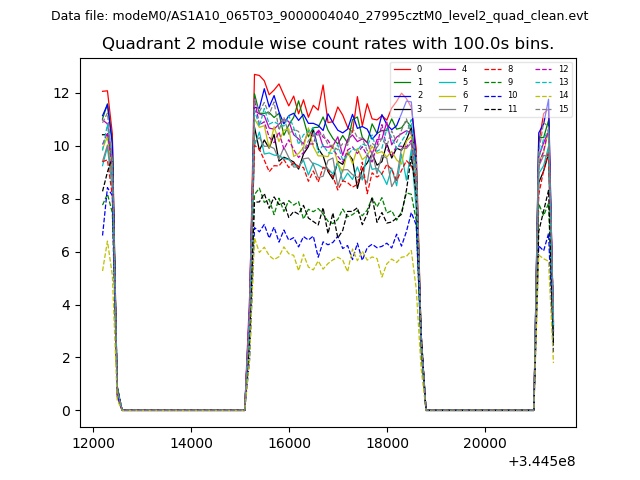
| Module-wise count rates for Quadrant B Data is divided into 100 sec bins |
 |
 |
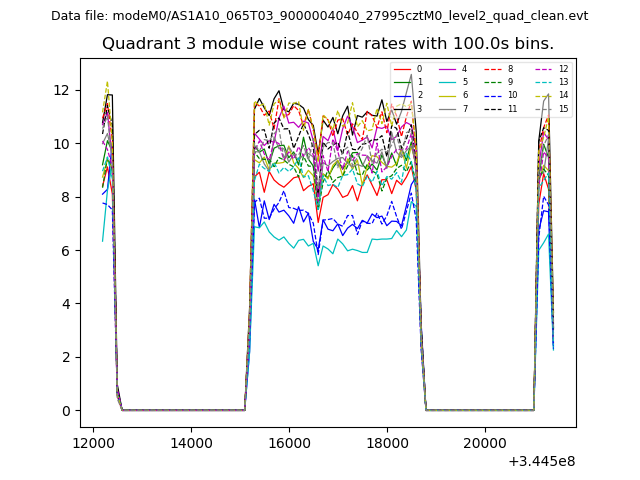
| Module-wise count rates for Quadrant C Data is divided into 100 sec bins |
 |
 |
| Module-wise count rates for Quadrant D Data is divided into 100 sec bins |
 |
 |
| Parameter | Plot |
|---|---|
| CZT HV Monitor | 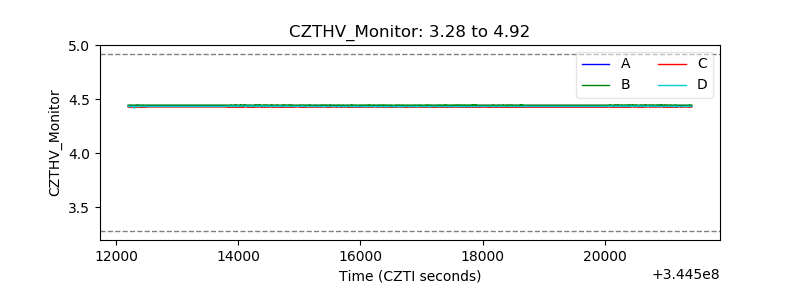 |
| D_VDD | 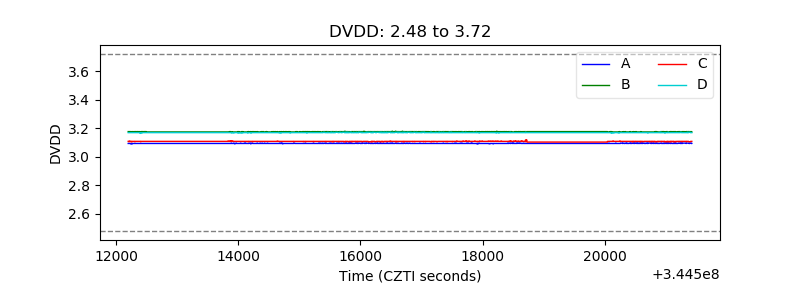 |
| Temperature 1 | 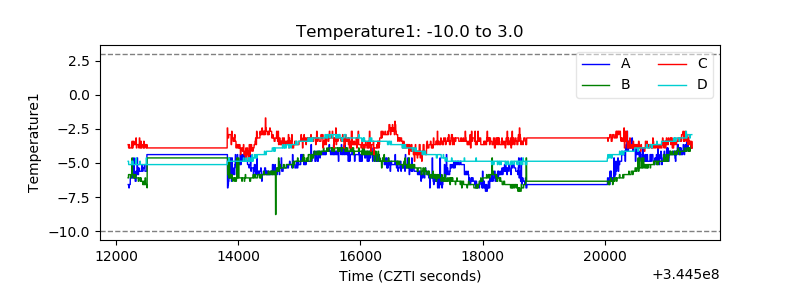 |
| Veto HV Monitor | 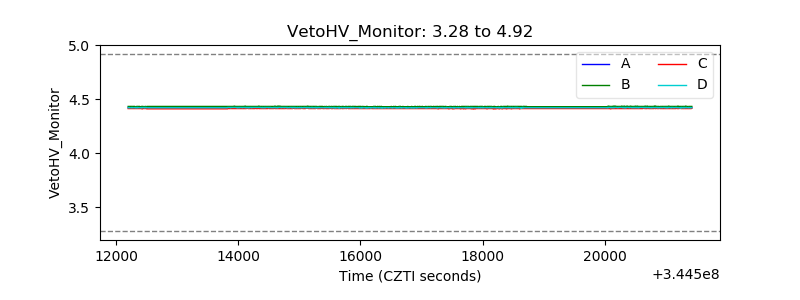 |
| Veto LLD | 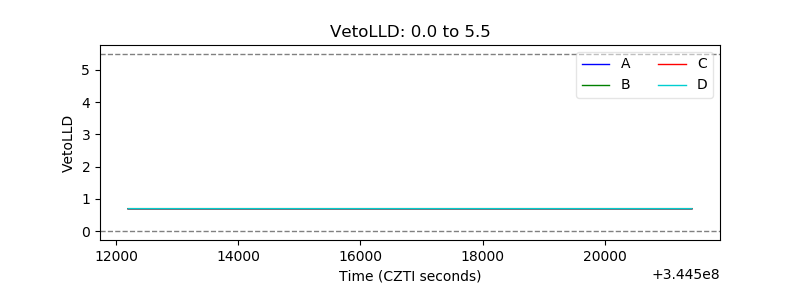 |
| Alpha Counter | 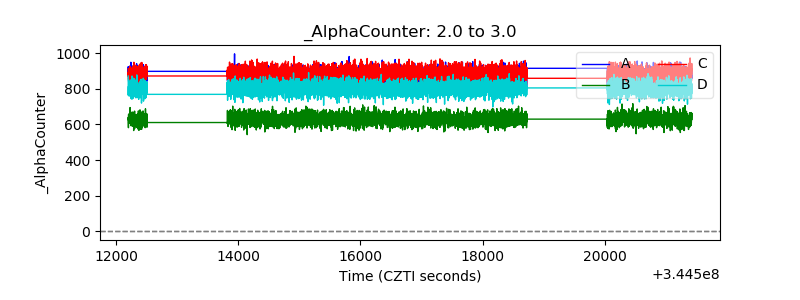 |
| _CPM_Rate | 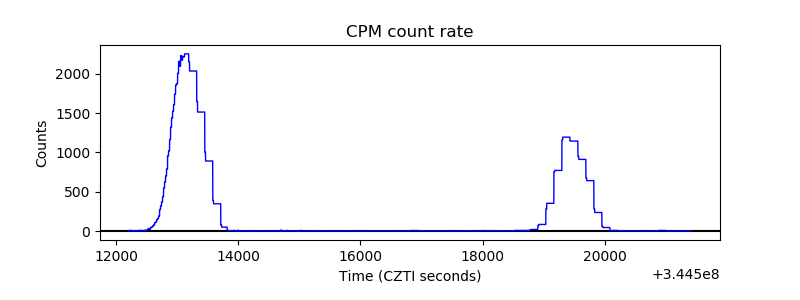 |
| CZT Counter |  |
| +2.5 Volts monitor |  |
| +5 Volts monitor |  |
| _ROLL_ROT | 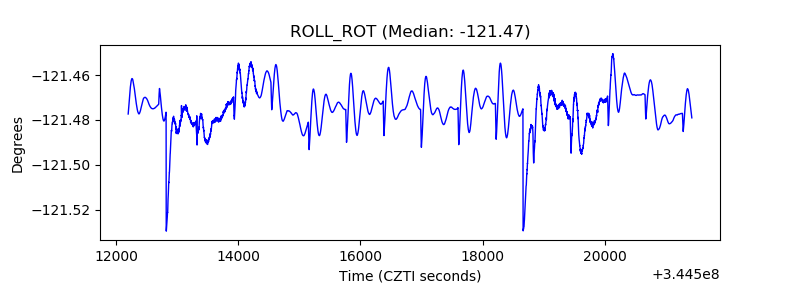 |
| _Roll_DEC |  |
| _Roll_RA | 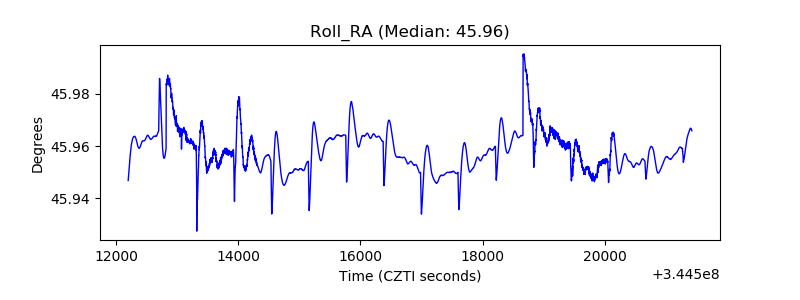 |
| Veto Counter | 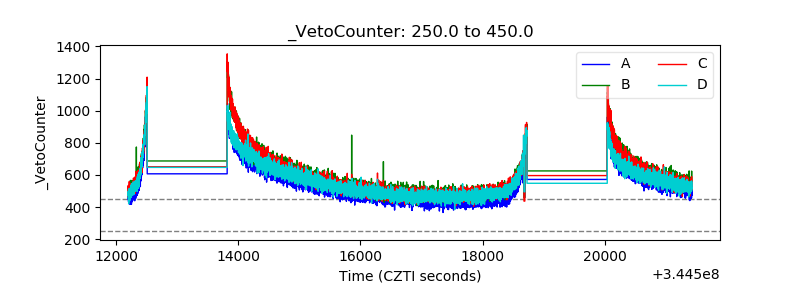 |