| Param | Original file | Final file |
|---|---|---|
| Filename | modeM0/AS1A10_065T03_9000004040_27996cztM0_level2.evt | modeM0/AS1A10_065T03_9000004040_27996cztM0_level2_quad_clean.evt |
| Size (bytes) | 515,119,680 | 97,839,360 |
| Size | 491.3 MB | 93.3 MB |
| Events in quadrant A | 3,504,162 | 652,977 |
| Events in quadrant B | 3,569,999 | 652,644 |
| Events in quadrant C | 3,764,860 | 604,614 |
| Events in quadrant D | 4,330,247 | 609,247 |
| Mode M9 | |||
|---|---|---|---|
| Quadrant | BADHDUFLAG | Total packets | Discarded packets |
| A | 0 | 23 | 0 |
| B | 0 | 24 | 0 |
| C | 0 | 24 | 0 |
| D | 0 | 24 | 0 |
| Mode M0 | |||
|---|---|---|---|
| Quadrant | BADHDUFLAG | Total packets | Discarded packets |
| A | 0 | 14248 | 0 |
| B | 0 | 14571 | 0 |
| C | 0 | 15263 | 0 |
| D | 0 | 17379 | 0 |
| Quadrant | Total seconds | Saturated seconds | Saturation percentage |
|---|---|---|---|
| A | 6355 | 107 | 1.683714% |
| B | 6355 | 155 | 2.439024% |
| C | 6355 | 222 | 3.493312% |
| D | 6354 | 121 | 1.904312% |
Noise dominated data is calculated using 1-second bins in cleaned event files. If a bin has >2000 counts, and if more than 50% of those come from <1% of pixels, then it is considered to be noise-dominated and hence unusable.
| Quadrant | # 1 sec bins | Bins with >0 counts | Bins with >2000 counts | High rate bins dominated by noise | Noise dominated (total time) | Noise dominated (detector-on time) | Marked lightcurve |
|---|---|---|---|---|---|---|---|
| A | 7565 | 6355 | 2 | 2 | 0.03% | 0.03% | 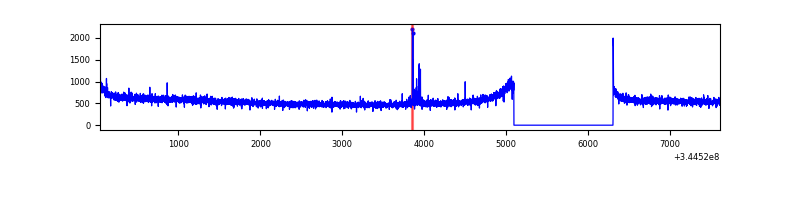 |
| B | 7565 | 6355 | 5 | 5 | 0.07% | 0.08% | 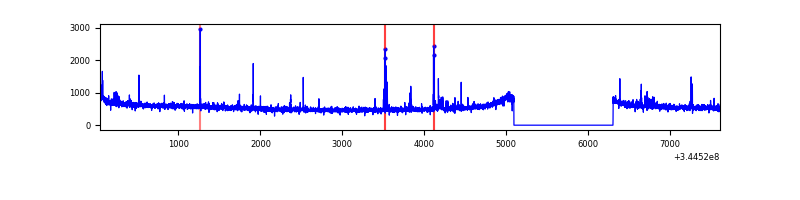 |
| C | 7565 | 6355 | 25 | 25 | 0.33% | 0.39% | 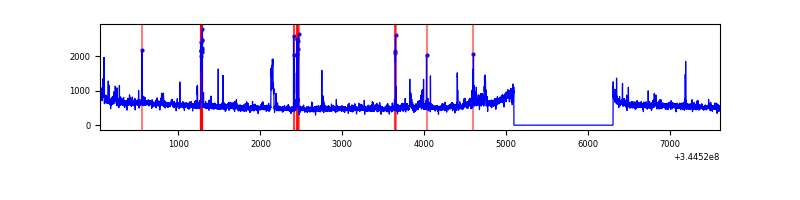 |
| D | 7564 | 6354 | 100 | 100 | 1.32% | 1.57% | 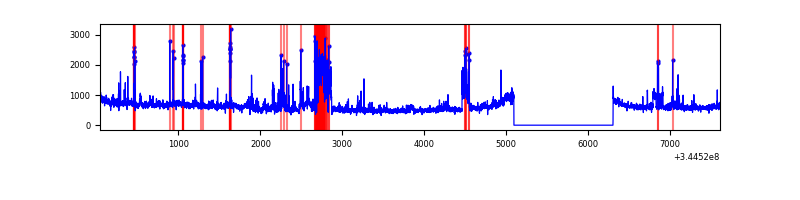 |
Top three noisy pixels from each quadrant. If the there are fewer than three noisy pixels in the level2.evt file, extra rows are filled as -1
| Pixel properties | Quadrant properties | ||||||
|---|---|---|---|---|---|---|---|
| Quadrant | DetID | PixID | Counts | Sigma | Mean | Median | Sigma |
| A | 4 | 2 | 28103 | 152.38 | 899 | 883 | 178.6 |
| A | 8 | 192 | 10218 | 52.26 | 899 | 883 | 178.6 |
| A | 13 | 254 | 9090 | 45.94 | 899 | 883 | 178.6 |
| B | 10 | 245 | 101594 | 600.83 | 882 | 861 | 167.7 |
| B | 12 | 111 | 20540 | 117.38 | 882 | 861 | 167.7 |
| B | 11 | 111 | 18759 | 106.75 | 882 | 861 | 167.7 |
| C | 3 | 233 | 252322 | 1281.06 | 841 | 848 | 196.3 |
| C | 14 | 238 | 136528 | 691.18 | 841 | 848 | 196.3 |
| C | 10 | 22 | 67558 | 339.83 | 841 | 848 | 196.3 |
| D | 1 | 52 | 585046 | 2890.73 | 857 | 839 | 202.1 |
| D | 8 | 195 | 364056 | 1797.25 | 857 | 839 | 202.1 |
| D | 7 | 223 | 70055 | 342.49 | 857 | 839 | 202.1 |
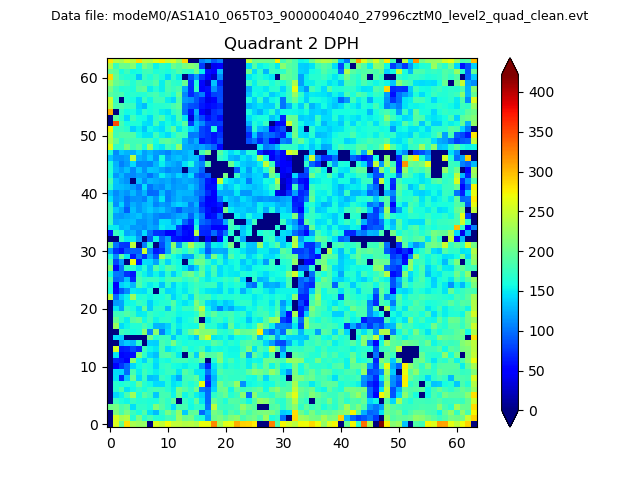
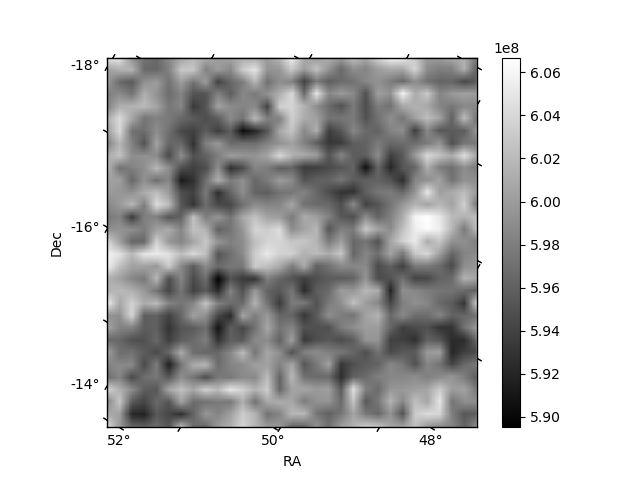
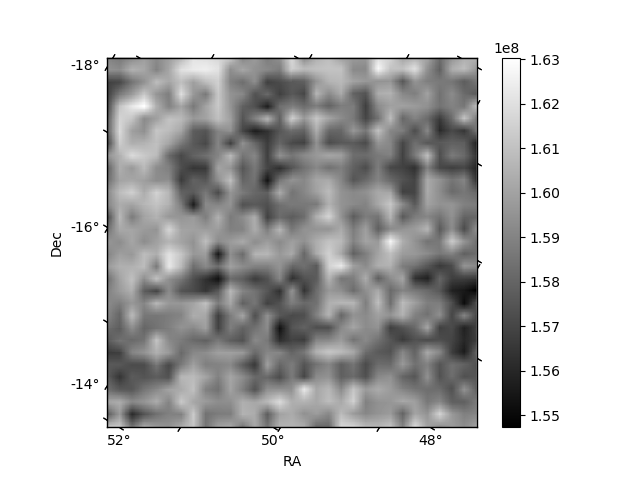
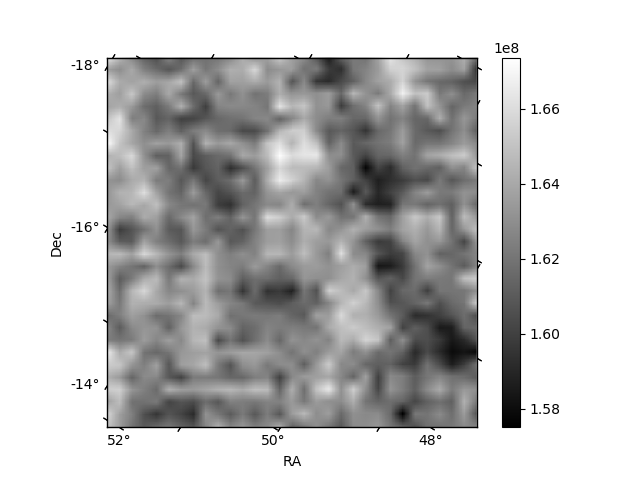
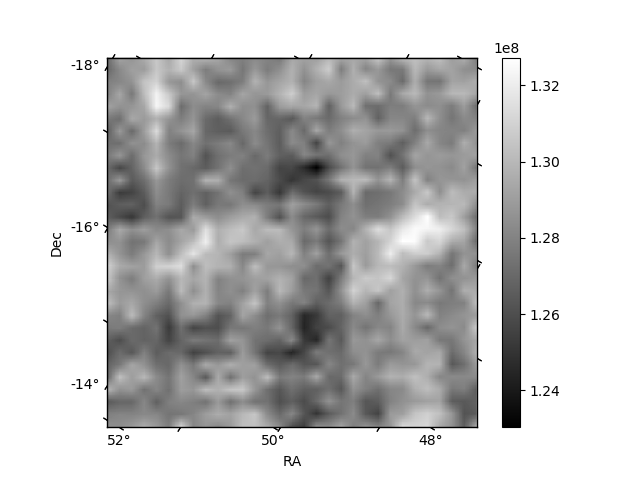
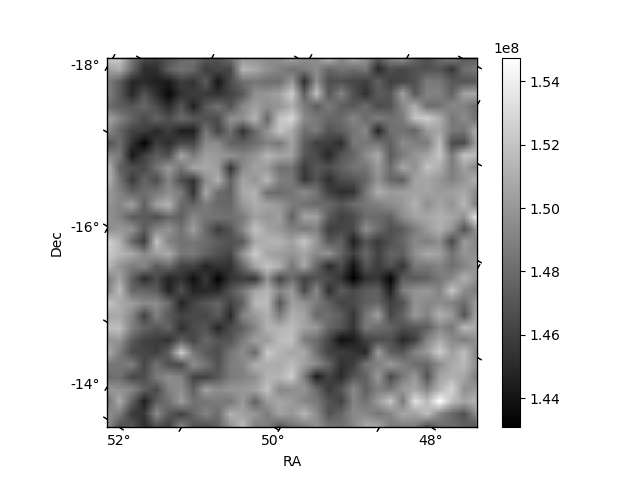
Histogram calculated using DETX and DETY for each event in the final _common_clean file
| Quadrant A | 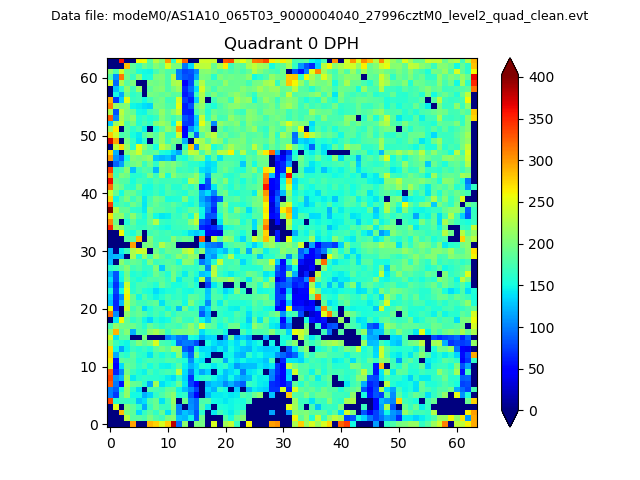 |
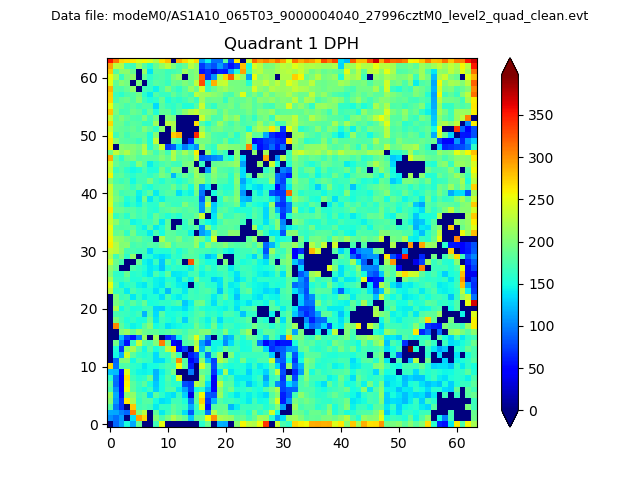 |
Quadrant B |
|---|---|---|---|
| Quadrant D | 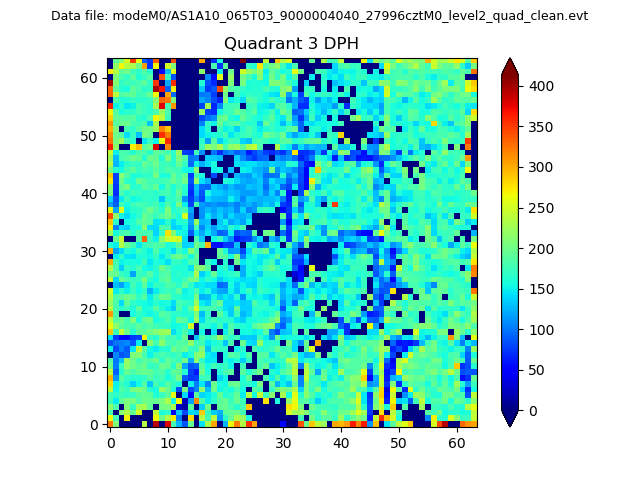 |
 |
Quadrant C |
| Plot type | Count rate plots | Images |
|---|---|---|
| Comparison with Poisson distribution Blue bars denote a histogram of data divided into 1 sec bins. Red curve is a Poisson curve with rate = median count rate of data. |
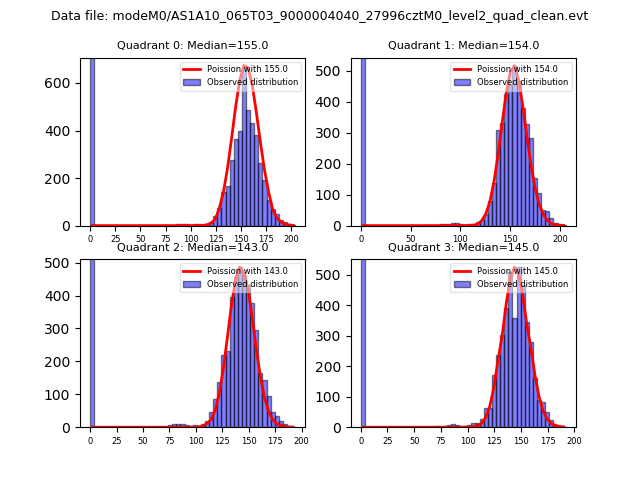 |
 |
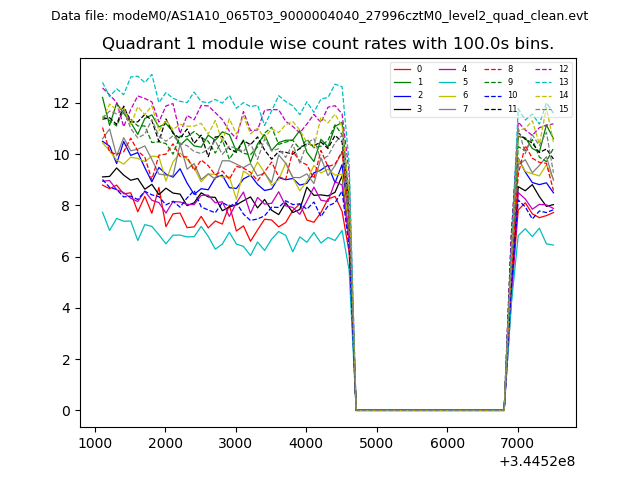
| Quadrant-wise count rates Data is divided into 100 sec bins |
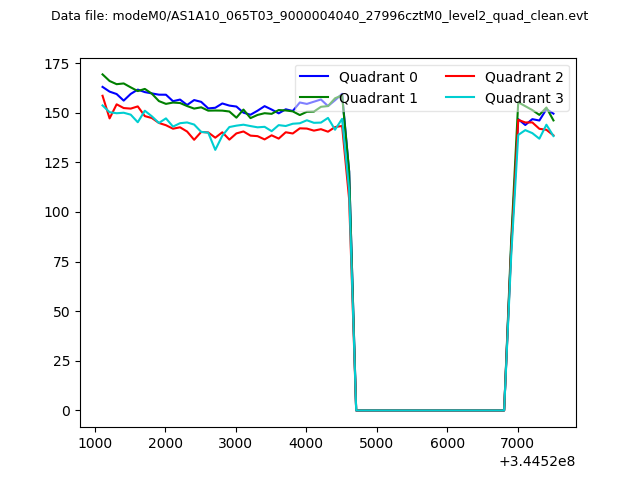 |
|
| Module-wise count rates for Quadrant A Data is divided into 100 sec bins |
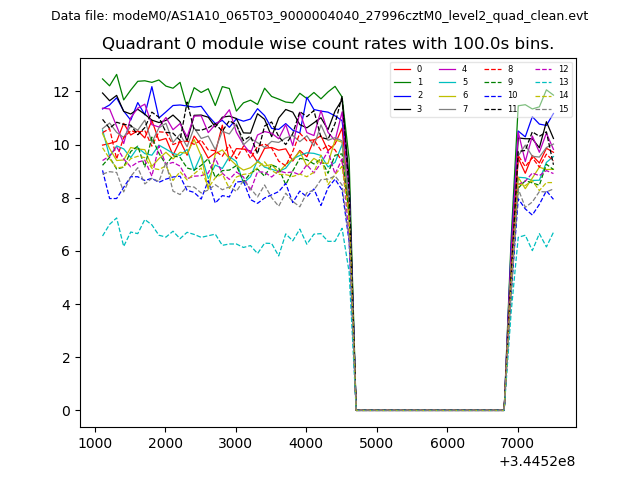 |
 |
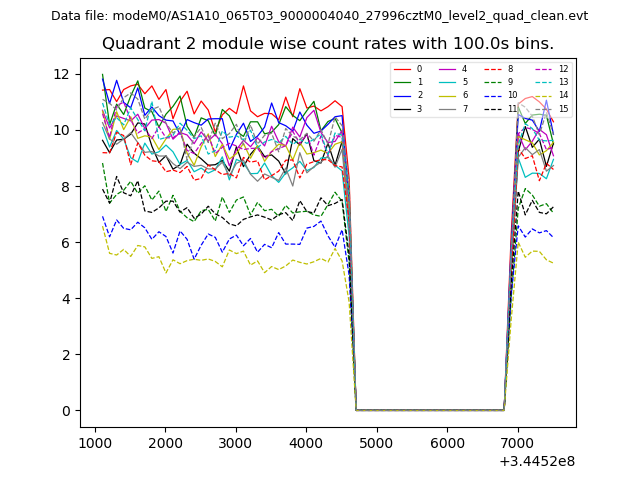
| Module-wise count rates for Quadrant B Data is divided into 100 sec bins |
 |
 |
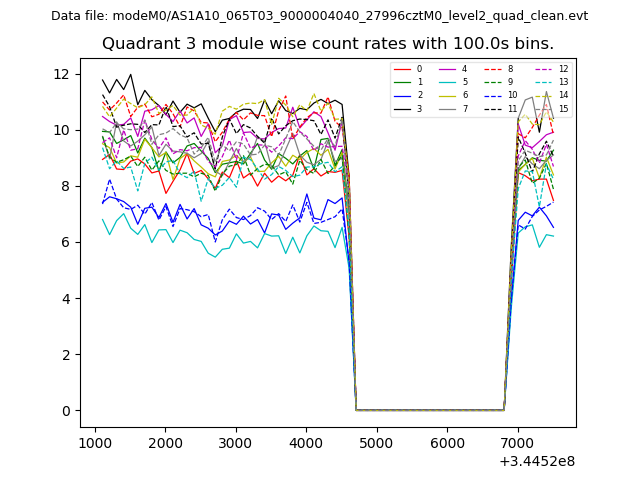
| Module-wise count rates for Quadrant C Data is divided into 100 sec bins |
 |
 |
| Module-wise count rates for Quadrant D Data is divided into 100 sec bins |
 |
 |
| Parameter | Plot |
|---|---|
| CZT HV Monitor | 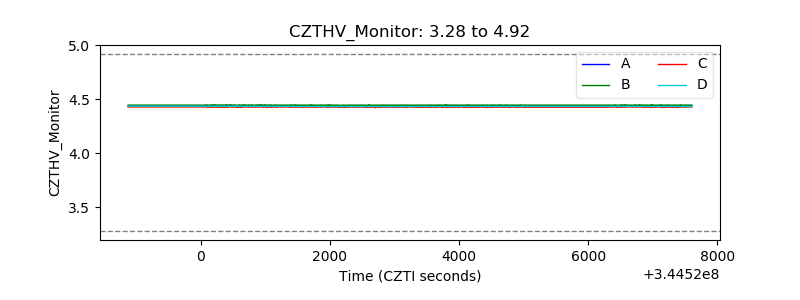 |
| D_VDD | 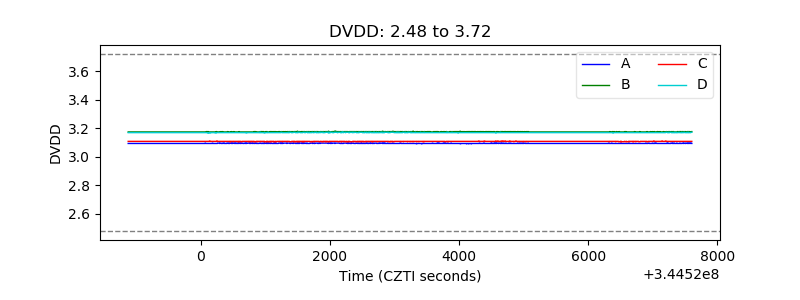 |
| Temperature 1 | 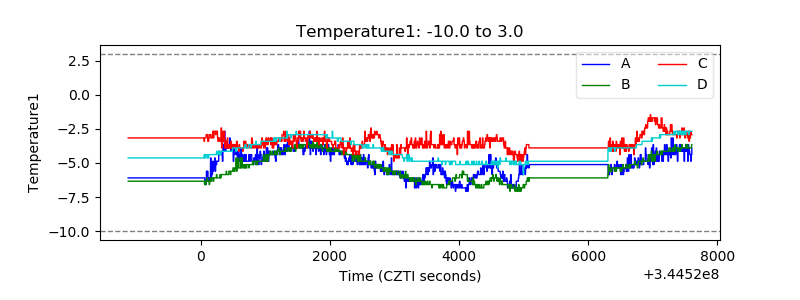 |
| Veto HV Monitor |  |
| Veto LLD | 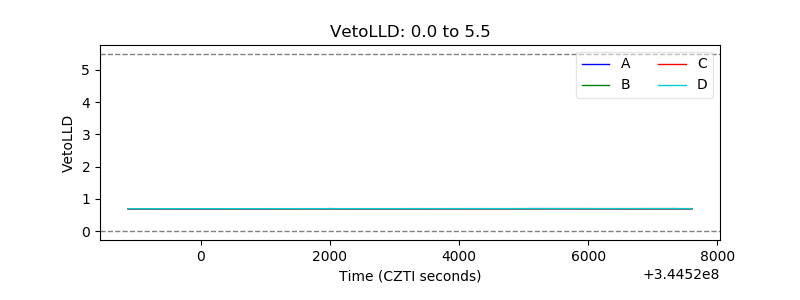 |
| Alpha Counter | 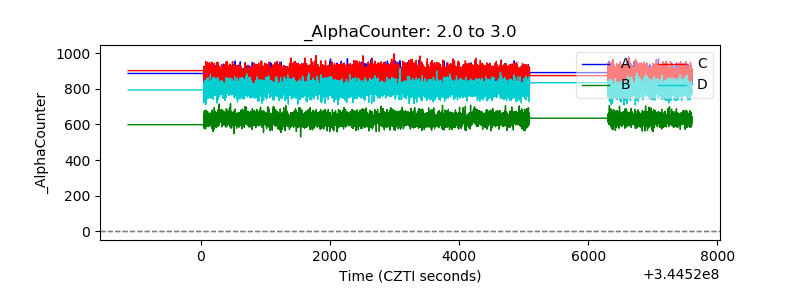 |
| _CPM_Rate | 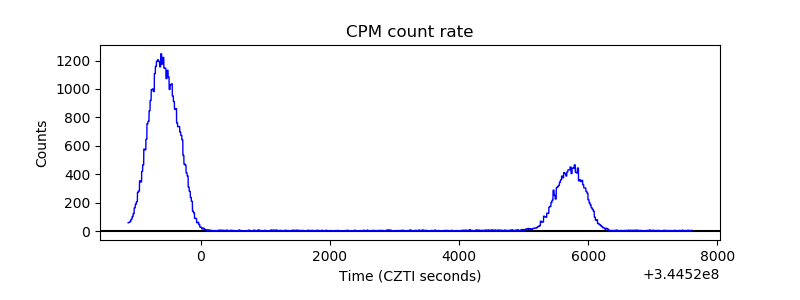 |
| CZT Counter |  |
| +2.5 Volts monitor |  |
| +5 Volts monitor | 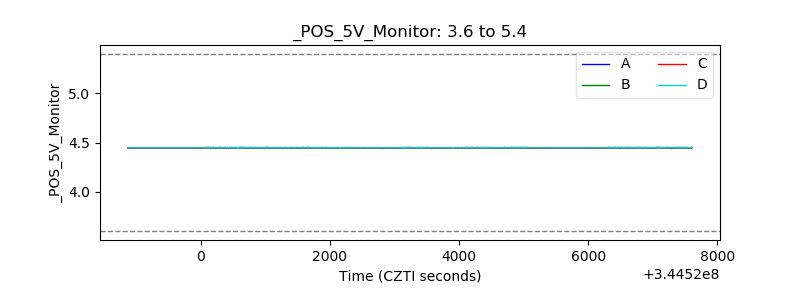 |
| _ROLL_ROT | 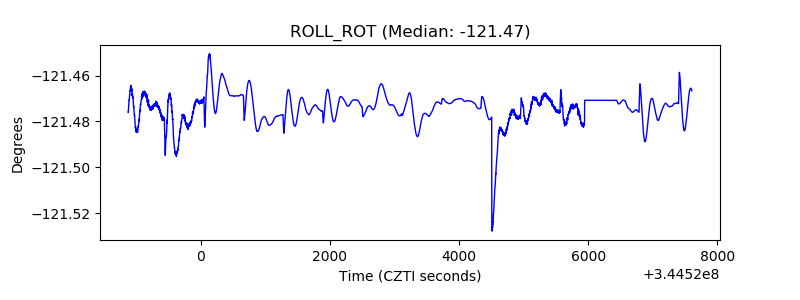 |
| _Roll_DEC |  |
| _Roll_RA |  |
| Veto Counter | 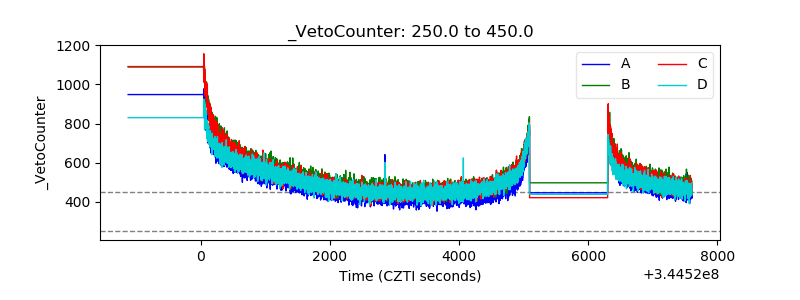 |