| Param | Original file | Final file |
|---|---|---|
| Filename | modeM0/AS1A10_065T03_9000004040_27997cztM0_level2.evt | modeM0/AS1A10_065T03_9000004040_27997cztM0_level2_quad_clean.evt |
| Size (bytes) | 507,107,520 | 99,990,720 |
| Size | 483.6 MB | 95.4 MB |
| Events in quadrant A | 3,332,546 | 667,367 |
| Events in quadrant B | 3,897,639 | 657,374 |
| Events in quadrant C | 3,623,675 | 617,509 |
| Events in quadrant D | 4,059,581 | 629,437 |
| Mode M9 | |||
|---|---|---|---|
| Quadrant | BADHDUFLAG | Total packets | Discarded packets |
| A | 0 | 9 | 0 |
| B | 0 | 9 | 0 |
| C | 0 | 9 | 0 |
| D | 0 | 9 | 0 |
| Mode M0 | |||
|---|---|---|---|
| Quadrant | BADHDUFLAG | Total packets | Discarded packets |
| A | 0 | 13721 | 0 |
| B | 0 | 15604 | 0 |
| C | 0 | 14791 | 0 |
| D | 0 | 16211 | 0 |
| Quadrant | Total seconds | Saturated seconds | Saturation percentage |
|---|---|---|---|
| A | 6550 | 91 | 1.389313% |
| B | 6551 | 196 | 2.991910% |
| C | 6551 | 172 | 2.625553% |
| D | 6550 | 206 | 3.145038% |
Noise dominated data is calculated using 1-second bins in cleaned event files. If a bin has >2000 counts, and if more than 50% of those come from <1% of pixels, then it is considered to be noise-dominated and hence unusable.
| Quadrant | # 1 sec bins | Bins with >0 counts | Bins with >2000 counts | High rate bins dominated by noise | Noise dominated (total time) | Noise dominated (detector-on time) | Marked lightcurve |
|---|---|---|---|---|---|---|---|
| A | 7400 | 6550 | 0 | 0 | 0.00% | 0.00% | 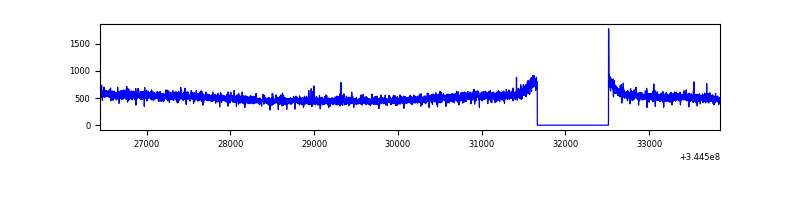 |
| B | 7401 | 6551 | 64 | 64 | 0.86% | 0.98% | 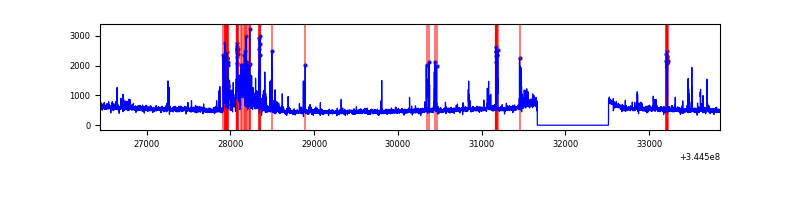 |
| C | 7401 | 6551 | 38 | 38 | 0.51% | 0.58% | 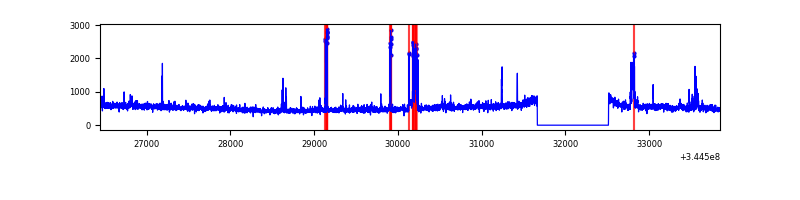 |
| D | 7400 | 6550 | 126 | 126 | 1.70% | 1.92% | 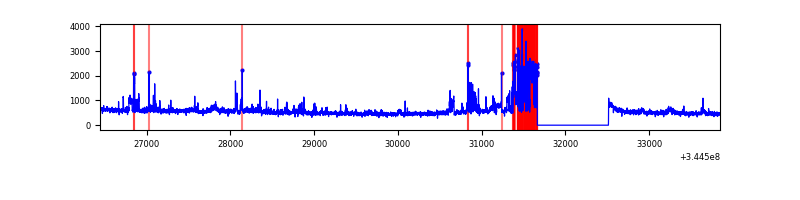 |
Top three noisy pixels from each quadrant. If the there are fewer than three noisy pixels in the level2.evt file, extra rows are filled as -1
| Pixel properties | Quadrant properties | ||||||
|---|---|---|---|---|---|---|---|
| Quadrant | DetID | PixID | Counts | Sigma | Mean | Median | Sigma |
| A | 13 | 254 | 9095 | 47.71 | 863 | 846 | 172.9 |
| A | 3 | 137 | 8295 | 43.08 | 863 | 846 | 172.9 |
| A | 0 | 226 | 7353 | 37.64 | 863 | 846 | 172.9 |
| B | 10 | 245 | 490590 | 3033.44 | 845 | 822 | 161.5 |
| B | 10 | 247 | 79126 | 484.99 | 845 | 822 | 161.5 |
| B | 12 | 111 | 19962 | 118.55 | 845 | 822 | 161.5 |
| C | 3 | 233 | 247811 | 1301.75 | 811 | 817 | 189.7 |
| C | 14 | 238 | 131420 | 688.33 | 811 | 817 | 189.7 |
| C | 2 | 16 | 83223 | 434.31 | 811 | 817 | 189.7 |
| D | 7 | 80 | 509158 | 2625.27 | 810 | 791 | 193.6 |
| D | 8 | 195 | 263134 | 1354.77 | 810 | 791 | 193.6 |
| D | 1 | 52 | 208138 | 1070.76 | 810 | 791 | 193.6 |
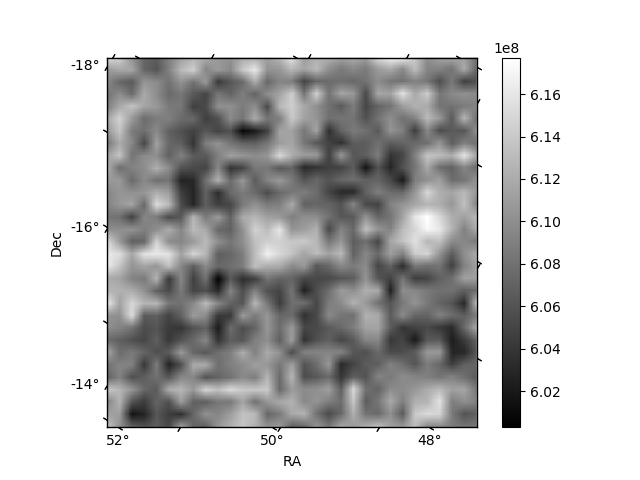
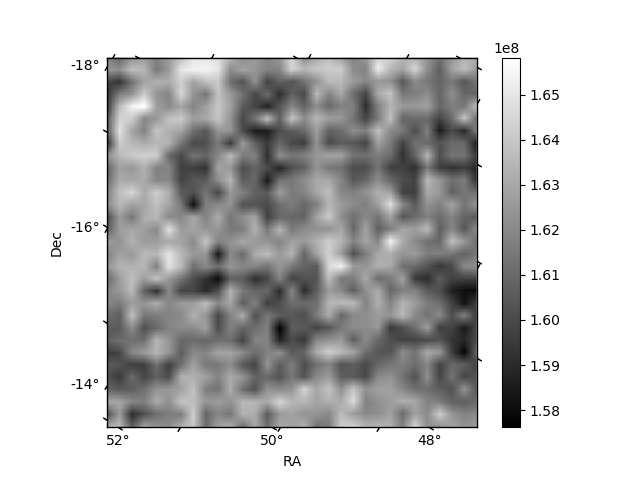
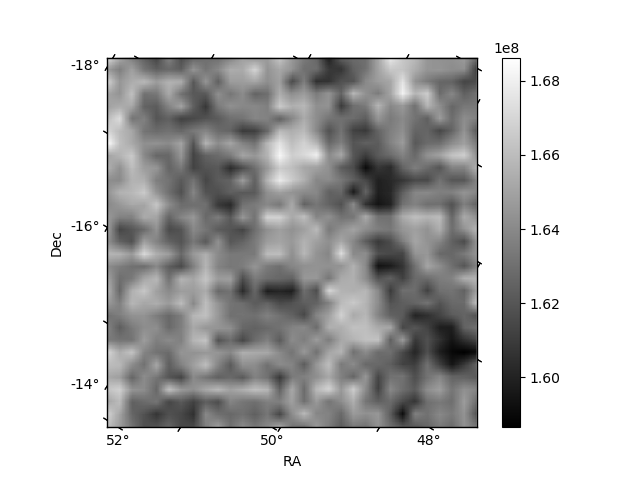
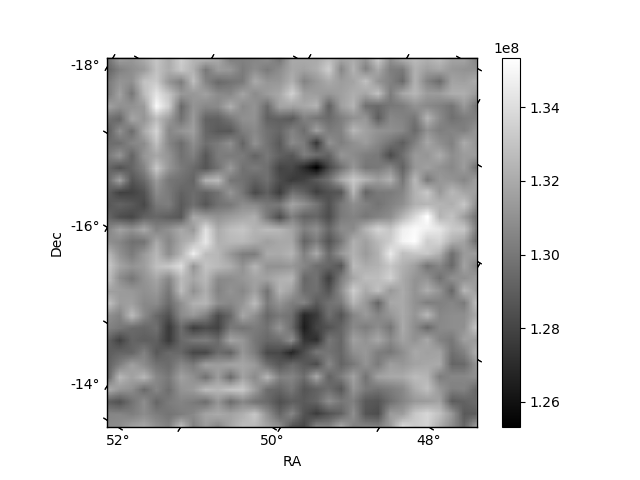
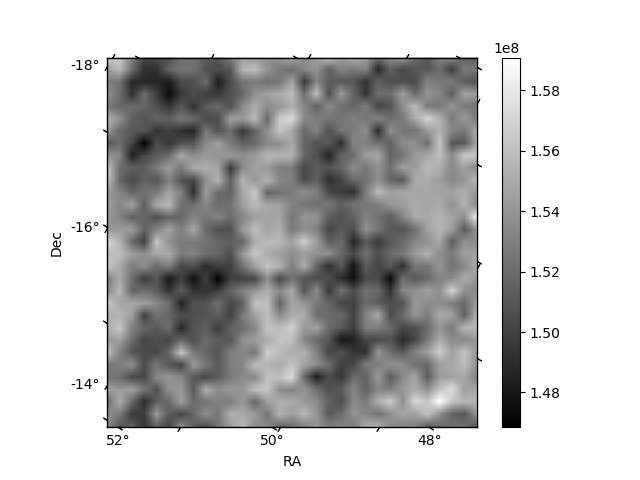
Histogram calculated using DETX and DETY for each event in the final _common_clean file
| Quadrant A | 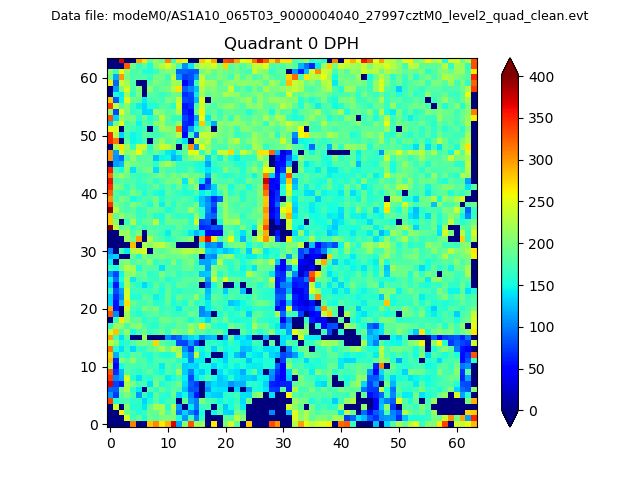 |
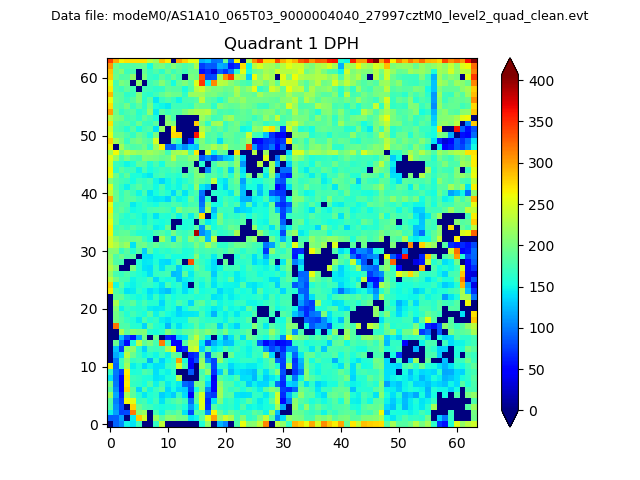 |
Quadrant B |
|---|---|---|---|
| Quadrant D | 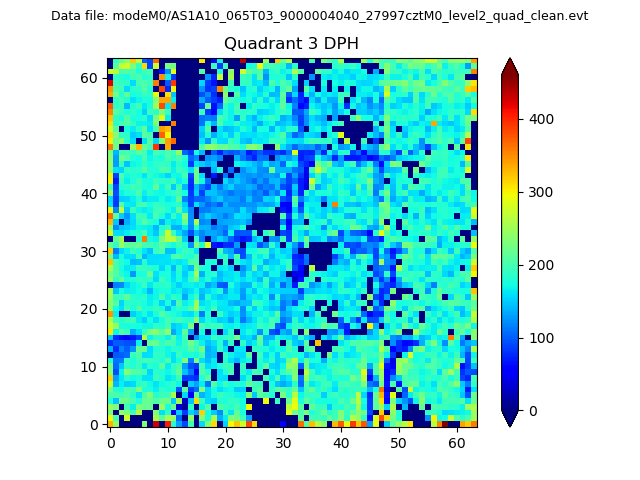 |
 |
Quadrant C |
| Plot type | Count rate plots | Images |
|---|---|---|
| Comparison with Poisson distribution Blue bars denote a histogram of data divided into 1 sec bins. Red curve is a Poisson curve with rate = median count rate of data. |
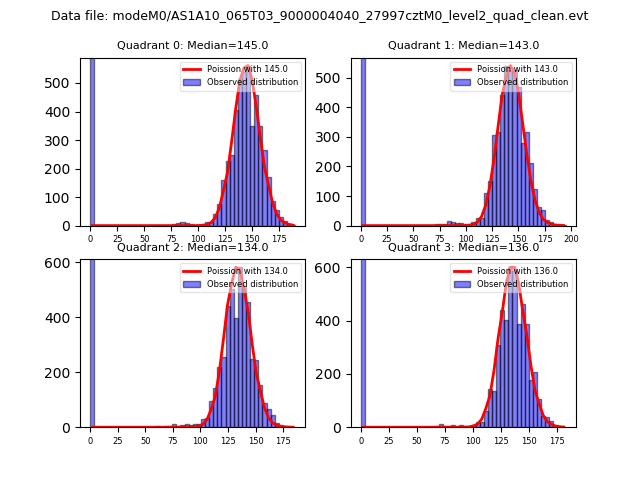 |
 |
| Quadrant-wise count rates Data is divided into 100 sec bins |
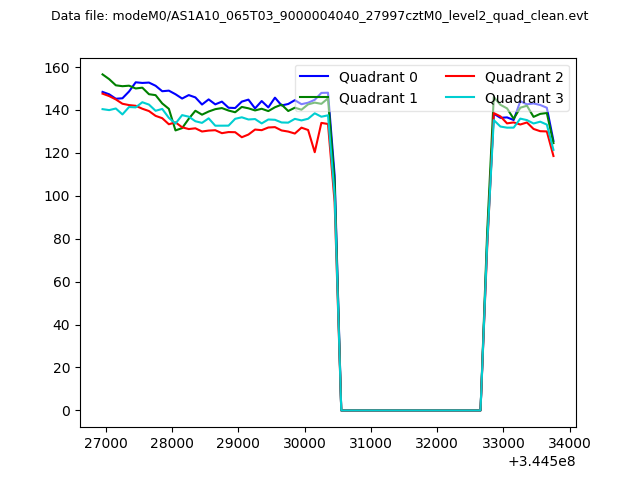 |
|
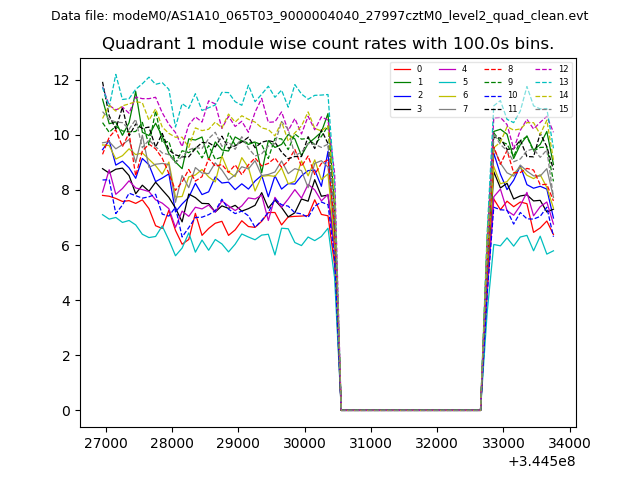
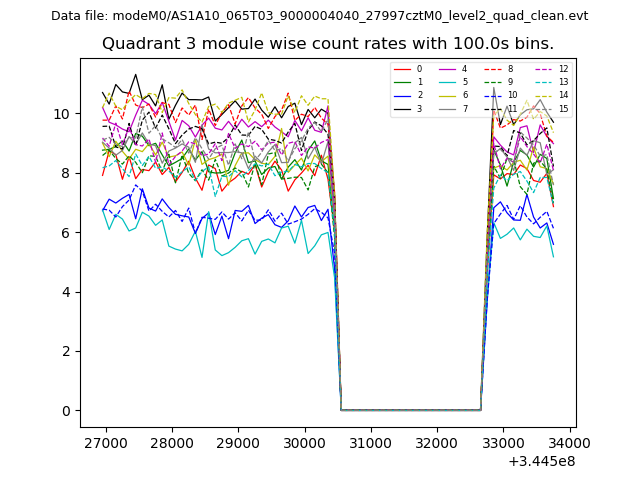
| Module-wise count rates for Quadrant A Data is divided into 100 sec bins |
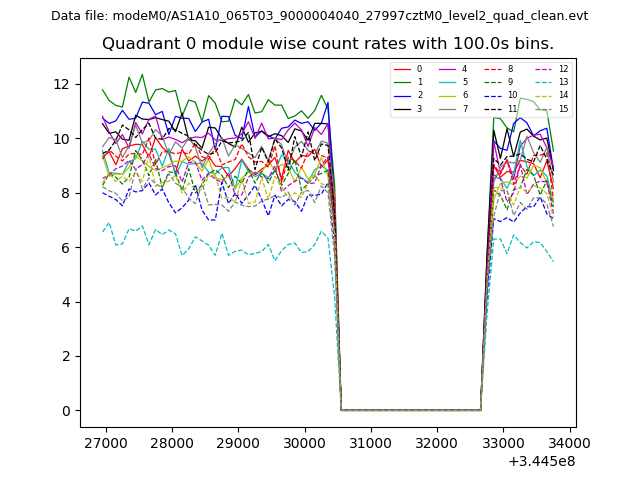 |
 |
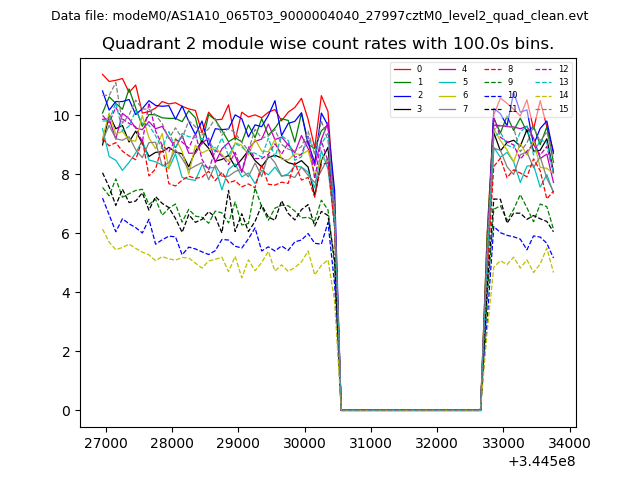
| Module-wise count rates for Quadrant B Data is divided into 100 sec bins |
 |
 |
| Module-wise count rates for Quadrant C Data is divided into 100 sec bins |
 |
 |
| Module-wise count rates for Quadrant D Data is divided into 100 sec bins |
 |
 |
| Parameter | Plot |
|---|---|
| CZT HV Monitor | 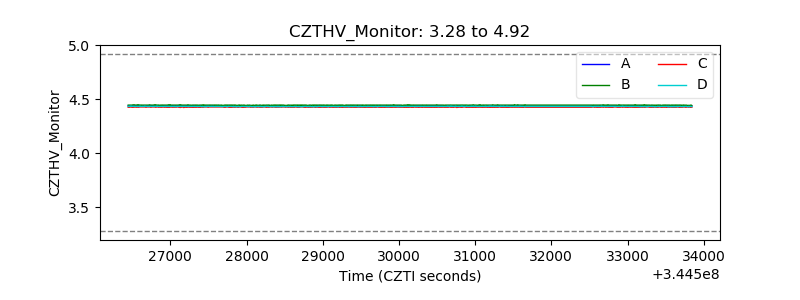 |
| D_VDD | 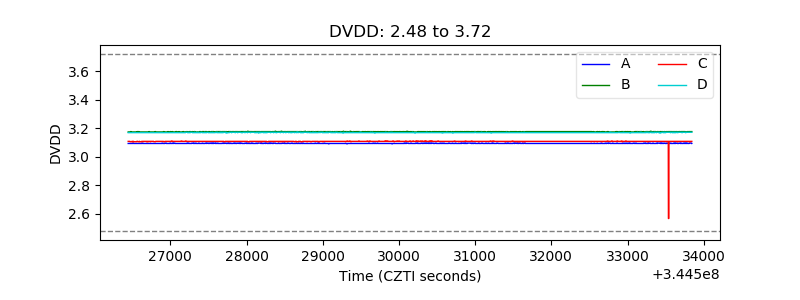 |
| Temperature 1 | 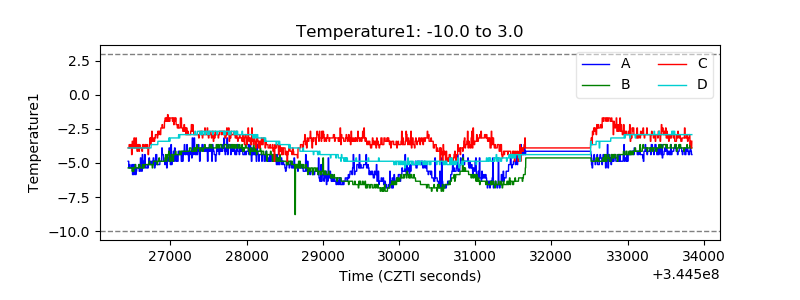 |
| Veto HV Monitor | 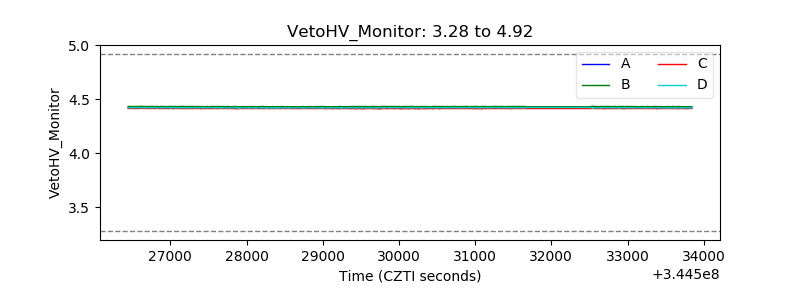 |
| Veto LLD | 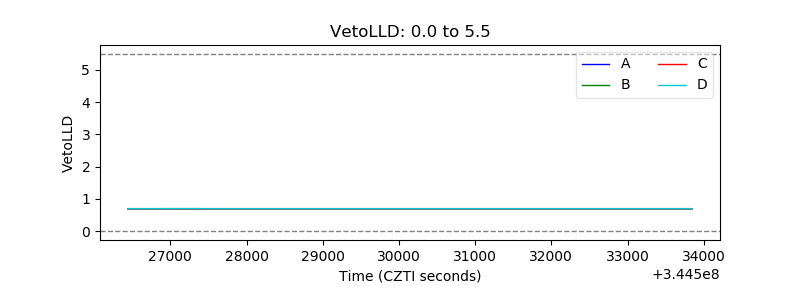 |
| Alpha Counter | 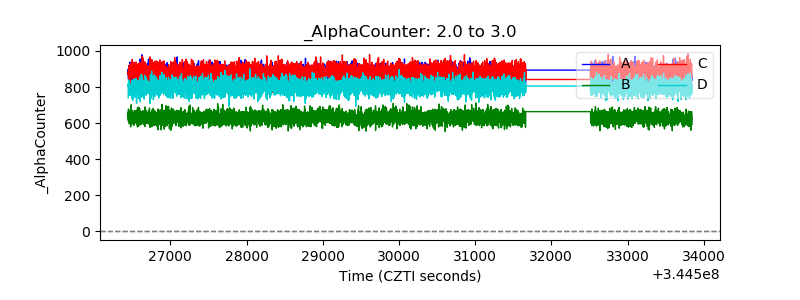 |
| _CPM_Rate | 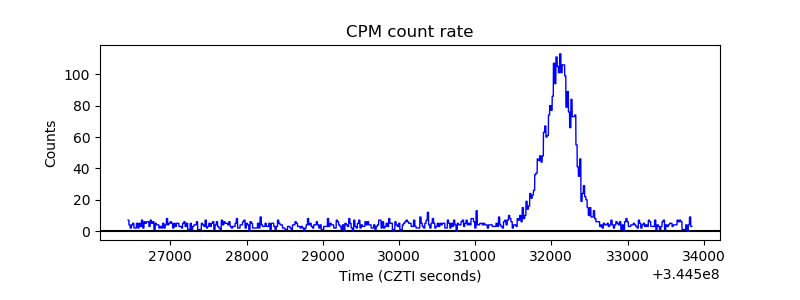 |
| CZT Counter | 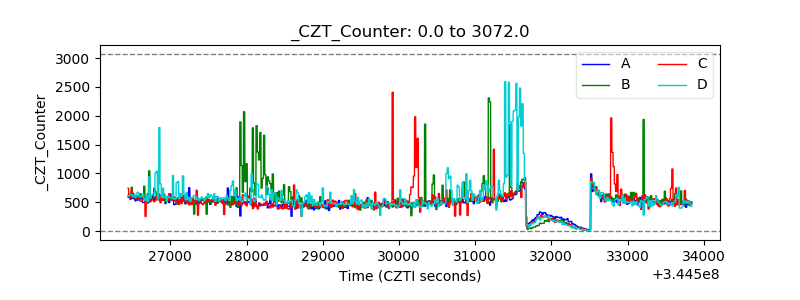 |
| +2.5 Volts monitor |  |
| +5 Volts monitor |  |
| _ROLL_ROT | 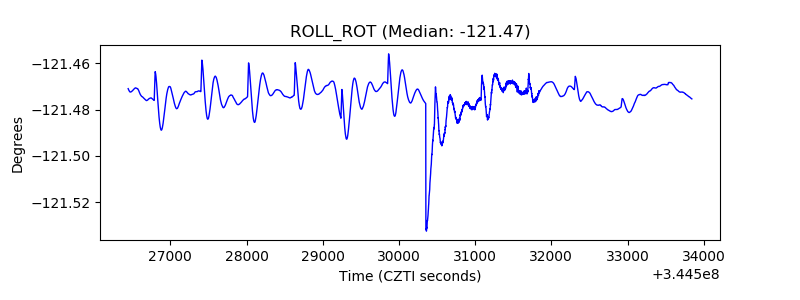 |
| _Roll_DEC | 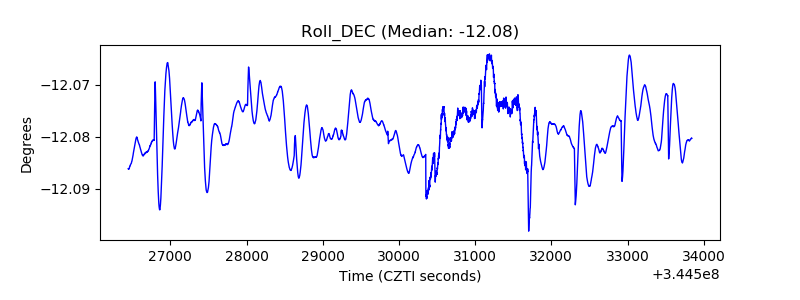 |
| _Roll_RA | 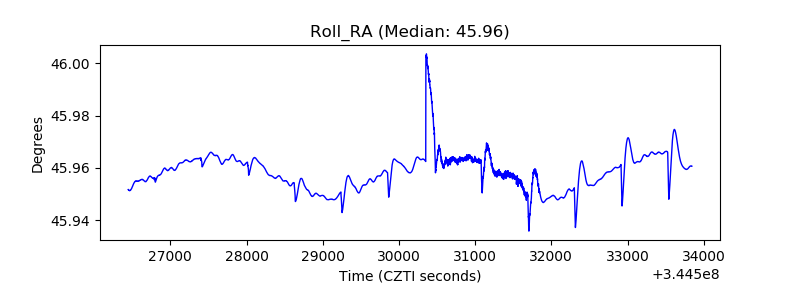 |
| Veto Counter | 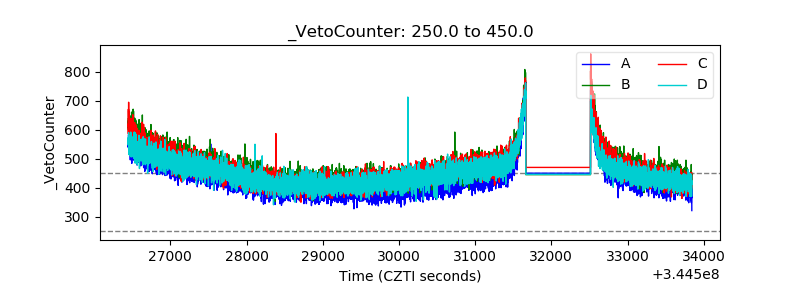 |