| Param | Original file | Final file |
|---|---|---|
| Filename | modeM0/AS1A10_065T03_9000004040_27998cztM0_level2.evt | modeM0/AS1A10_065T03_9000004040_27998cztM0_level2_quad_clean.evt |
| Size (bytes) | 560,243,520 | 105,698,880 |
| Size | 534.3 MB | 100.8 MB |
| Events in quadrant A | 3,779,007 | 697,144 |
| Events in quadrant B | 3,877,754 | 690,207 |
| Events in quadrant C | 4,203,758 | 645,842 |
| Events in quadrant D | 4,602,660 | 651,162 |
| Mode M9 | |||
|---|---|---|---|
| Quadrant | BADHDUFLAG | Total packets | Discarded packets |
| A | 0 | 13 | 0 |
| B | 0 | 13 | 0 |
| C | 0 | 13 | 0 |
| D | 0 | 13 | 0 |
| Mode M0 | |||
|---|---|---|---|
| Quadrant | BADHDUFLAG | Total packets | Discarded packets |
| A | 0 | 15768 | 0 |
| B | 0 | 16126 | 0 |
| C | 0 | 17341 | 0 |
| D | 0 | 18413 | 0 |
| Quadrant | Total seconds | Saturated seconds | Saturation percentage |
|---|---|---|---|
| A | 7432 | 169 | 2.273950% |
| B | 7432 | 216 | 2.906351% |
| C | 7432 | 285 | 3.834769% |
| D | 7433 | 382 | 5.139244% |
Noise dominated data is calculated using 1-second bins in cleaned event files. If a bin has >2000 counts, and if more than 50% of those come from <1% of pixels, then it is considered to be noise-dominated and hence unusable.
| Quadrant | # 1 sec bins | Bins with >0 counts | Bins with >2000 counts | High rate bins dominated by noise | Noise dominated (total time) | Noise dominated (detector-on time) | Marked lightcurve |
|---|---|---|---|---|---|---|---|
| A | 8657 | 7432 | 0 | 0 | 0.00% | 0.00% | 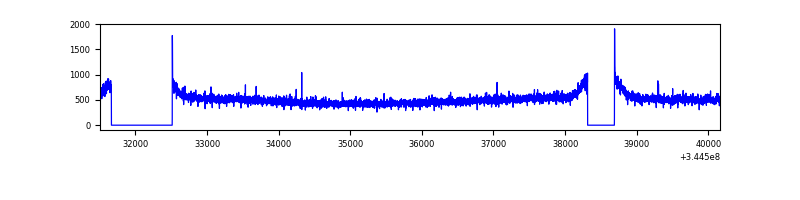 |
| B | 8657 | 7432 | 10 | 10 | 0.12% | 0.13% | 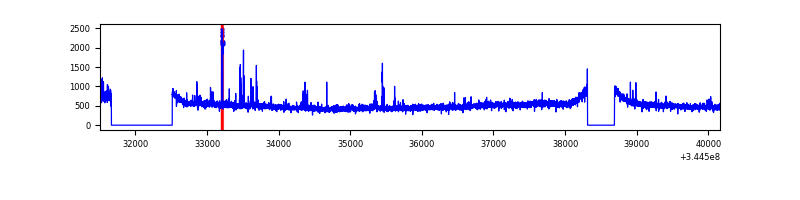 |
| C | 8657 | 7433 | 32 | 32 | 0.37% | 0.43% | 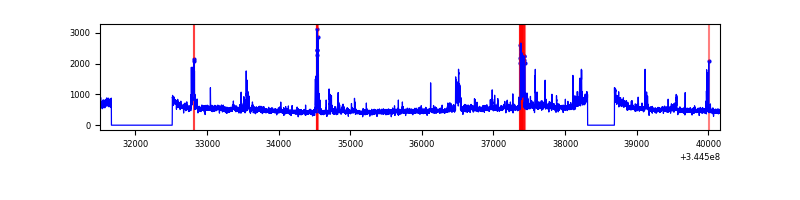 |
| D | 8658 | 7434 | 277 | 277 | 3.20% | 3.73% | 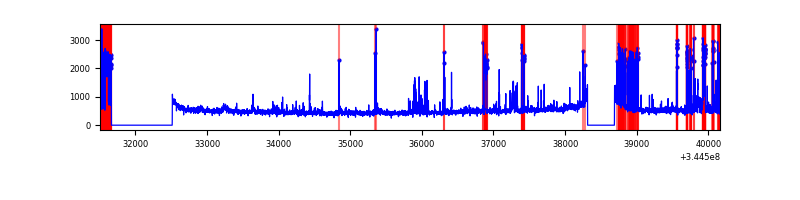 |
Top three noisy pixels from each quadrant. If the there are fewer than three noisy pixels in the level2.evt file, extra rows are filled as -1
| Pixel properties | Quadrant properties | ||||||
|---|---|---|---|---|---|---|---|
| Quadrant | DetID | PixID | Counts | Sigma | Mean | Median | Sigma |
| A | 0 | 13 | 19827 | 96.45 | 972 | 953 | 195.7 |
| A | 3 | 137 | 9949 | 45.97 | 972 | 953 | 195.7 |
| A | 13 | 254 | 9845 | 45.44 | 972 | 953 | 195.7 |
| B | 10 | 245 | 99436 | 529.82 | 956 | 931 | 185.9 |
| B | 12 | 111 | 23808 | 123.05 | 956 | 931 | 185.9 |
| B | 11 | 111 | 21719 | 111.81 | 956 | 931 | 185.9 |
| C | 2 | 16 | 233335 | 1081.89 | 914 | 920 | 214.8 |
| C | 3 | 233 | 197893 | 916.91 | 914 | 920 | 214.8 |
| C | 14 | 238 | 145154 | 671.41 | 914 | 920 | 214.8 |
| D | 1 | 52 | 634923 | 2885.67 | 914 | 892 | 219.7 |
| D | 8 | 195 | 283124 | 1284.53 | 914 | 892 | 219.7 |
| D | 7 | 80 | 244096 | 1106.9 | 914 | 892 | 219.7 |
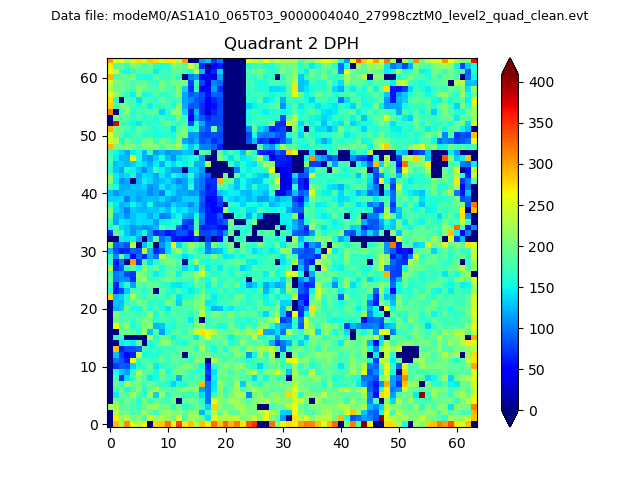
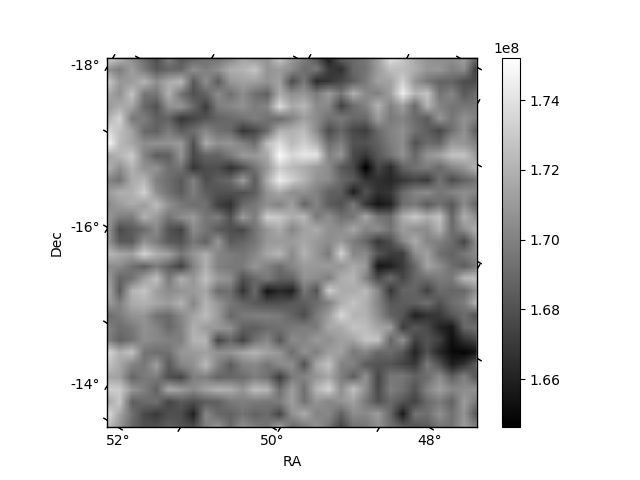
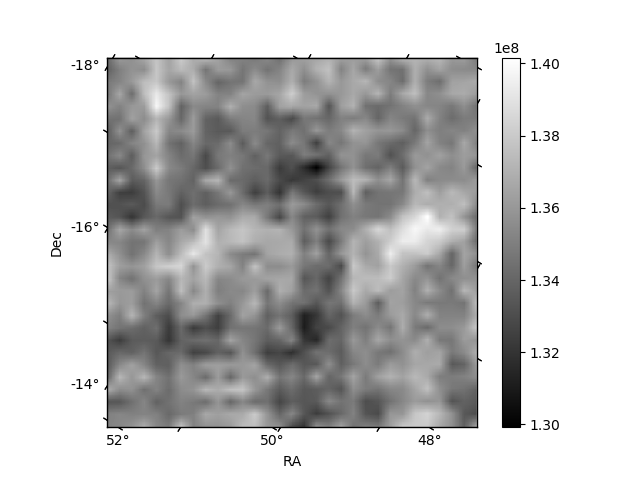
Histogram calculated using DETX and DETY for each event in the final _common_clean file
| Quadrant A | 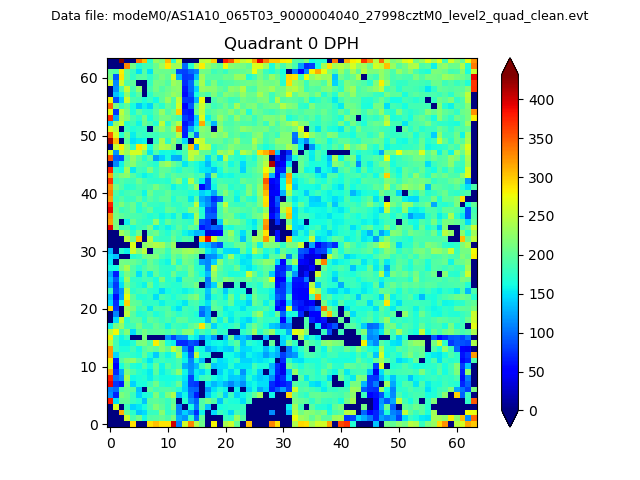 |
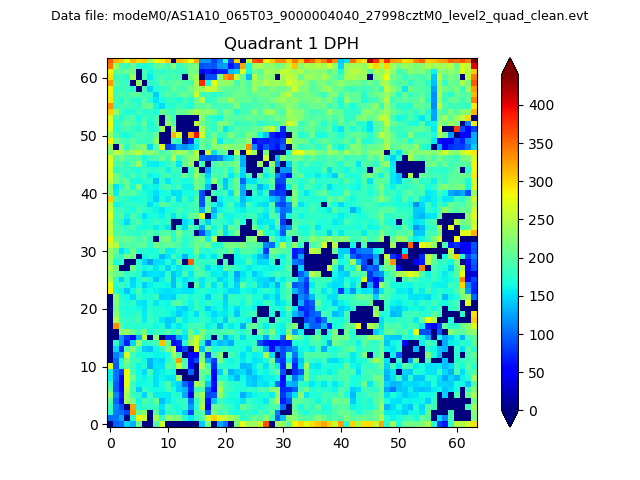 |
Quadrant B |
|---|---|---|---|
| Quadrant D | 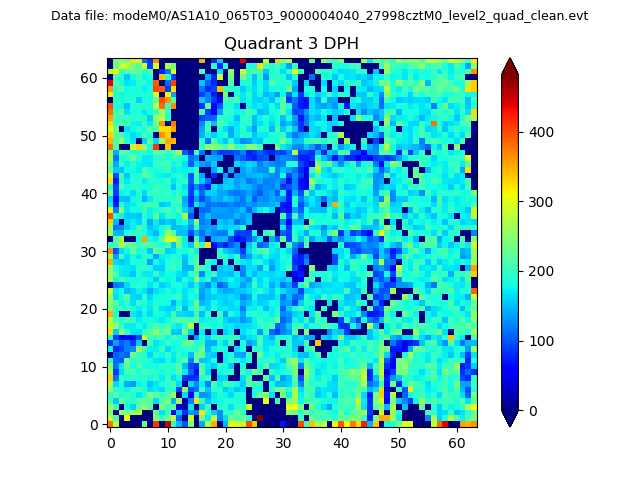 |
 |
Quadrant C |
| Plot type | Count rate plots | Images |
|---|---|---|
| Comparison with Poisson distribution Blue bars denote a histogram of data divided into 1 sec bins. Red curve is a Poisson curve with rate = median count rate of data. |
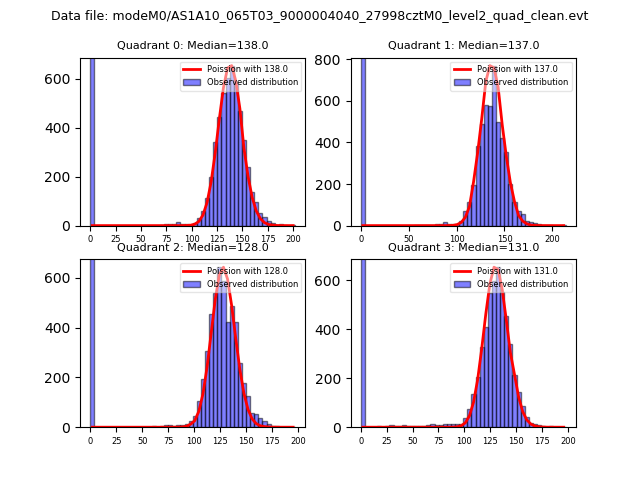 |
 |
| Quadrant-wise count rates Data is divided into 100 sec bins |
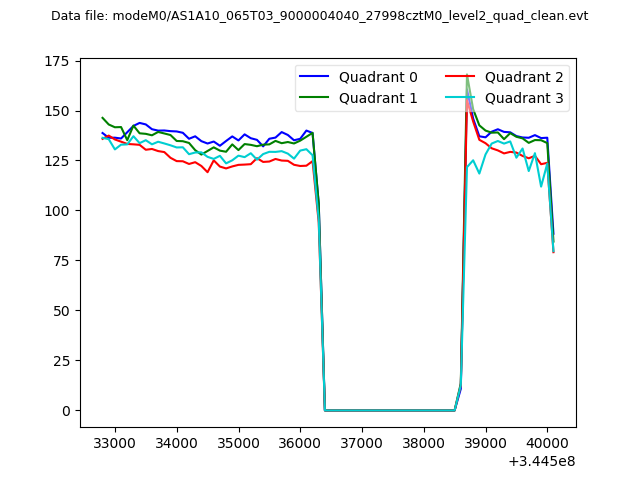 |
|
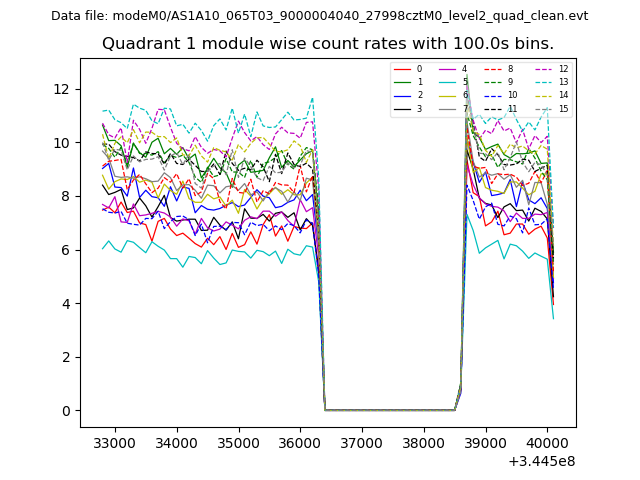
| Module-wise count rates for Quadrant A Data is divided into 100 sec bins |
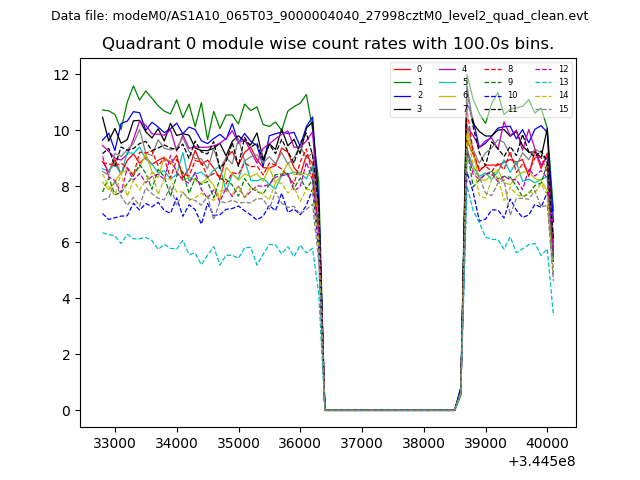 |
 |
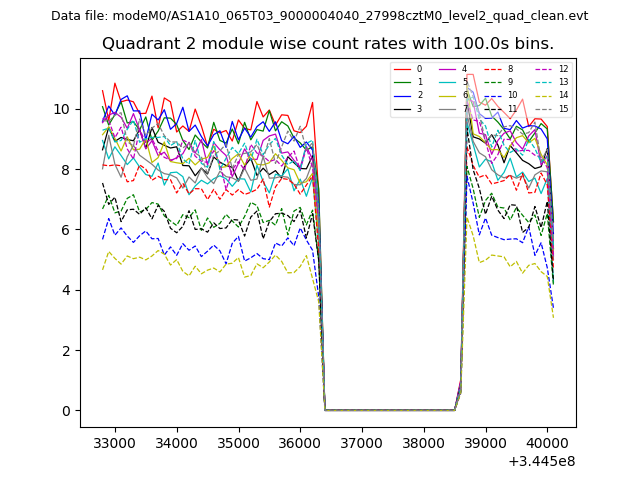
| Module-wise count rates for Quadrant B Data is divided into 100 sec bins |
 |
 |
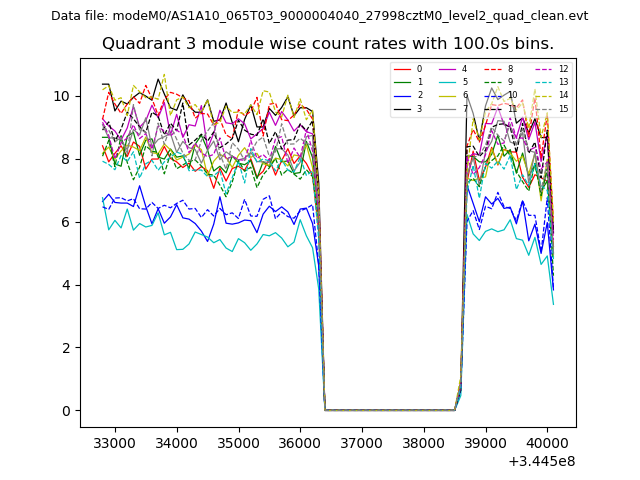
| Module-wise count rates for Quadrant C Data is divided into 100 sec bins |
 |
 |
| Module-wise count rates for Quadrant D Data is divided into 100 sec bins |
 |
 |
| Parameter | Plot |
|---|---|
| CZT HV Monitor | 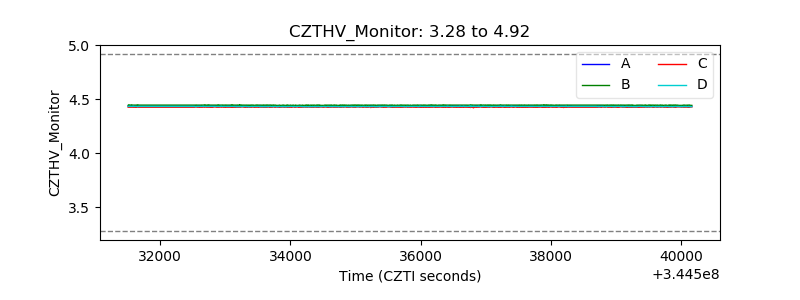 |
| D_VDD | 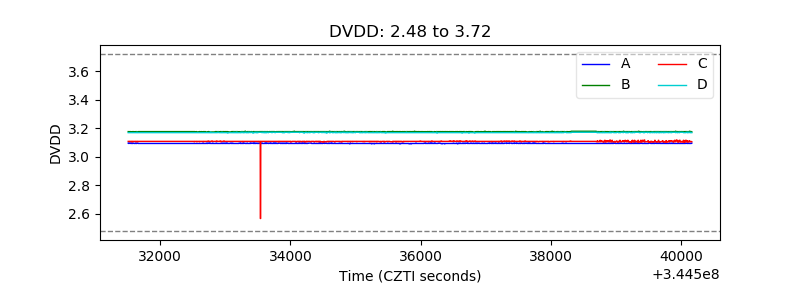 |
| Temperature 1 | 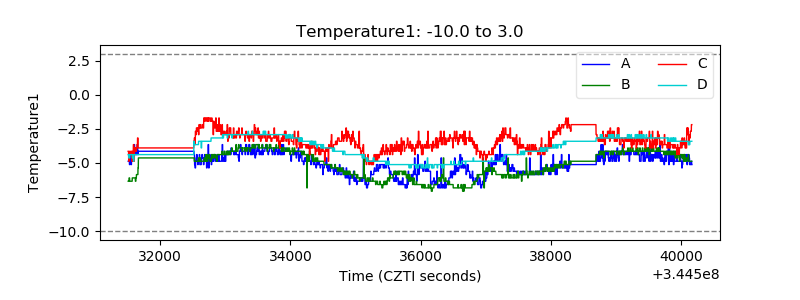 |
| Veto HV Monitor | 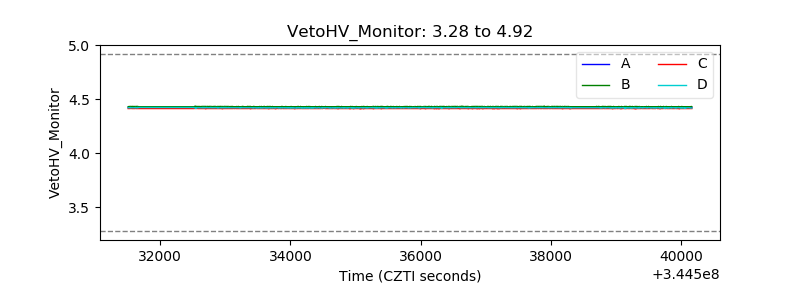 |
| Veto LLD | 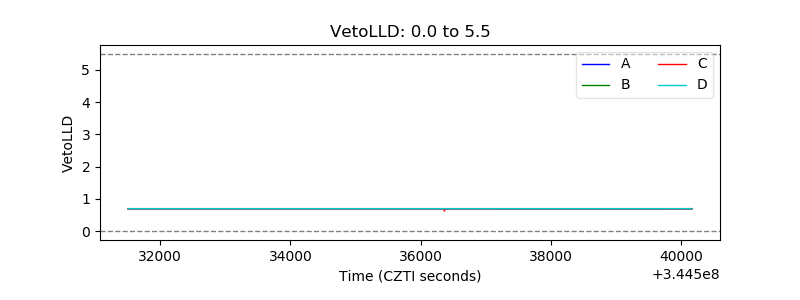 |
| Alpha Counter | 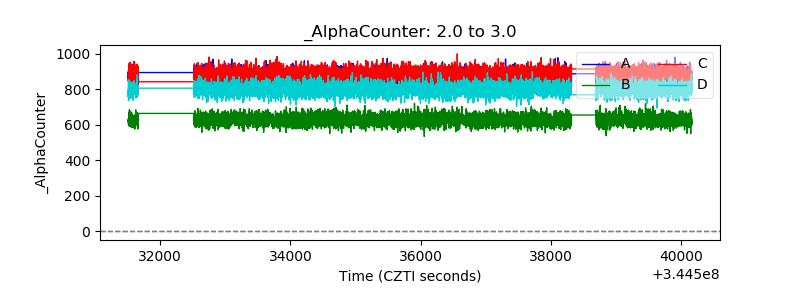 |
| _CPM_Rate | 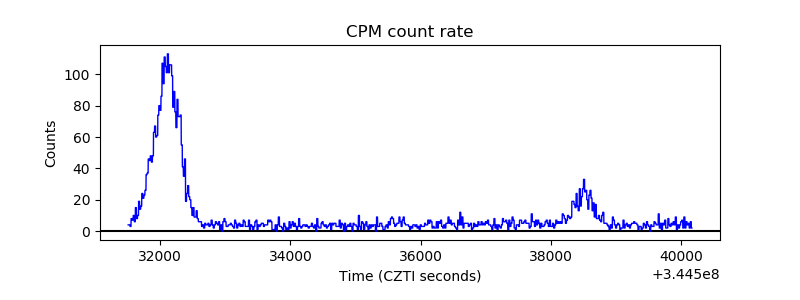 |
| CZT Counter |  |
| +2.5 Volts monitor |  |
| +5 Volts monitor | 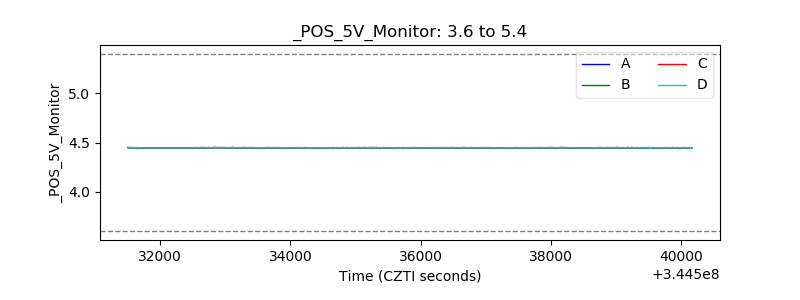 |
| _ROLL_ROT | 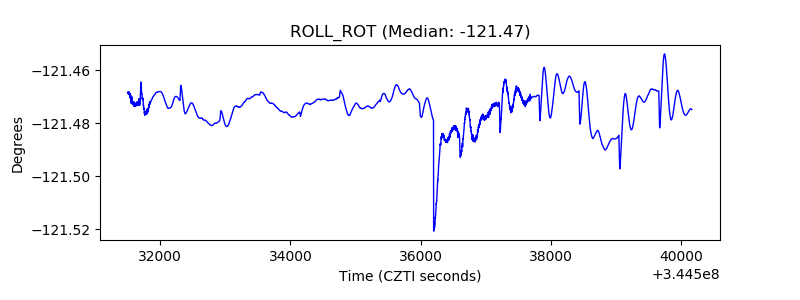 |
| _Roll_DEC | 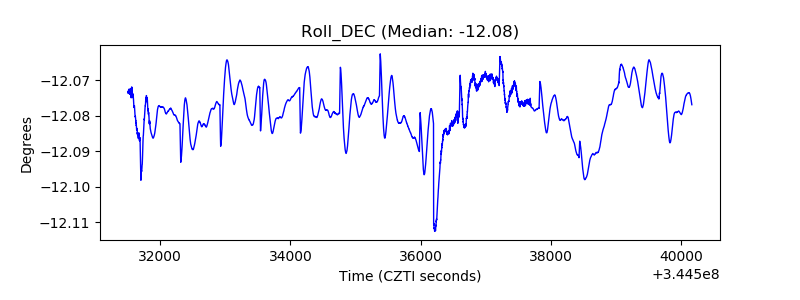 |
| _Roll_RA |  |
| Veto Counter | 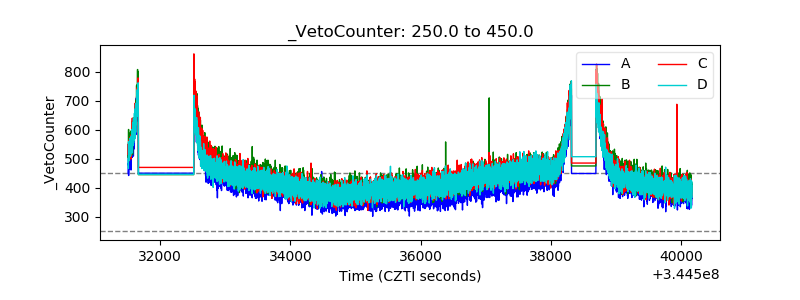 |