| Param | Original file | Final file |
|---|---|---|
| Filename | modeM0/AS1A10_021T08_9000004042cztM0_level2.fits | modeM0/AS1A10_021T08_9000004042cztM0_level2_quad_clean.evt |
| Size (bytes) | 206,622,720 | 180,216,000 |
| Size | 197.1 MB | 171.9 MB |
| Events in quadrant A | 1,317,504 | 1,110,273 |
| Events in quadrant B | 1,250,611 | 1,105,994 |
| Events in quadrant C | 1,264,924 | 1,037,074 |
| Events in quadrant D | 947,668 | 729,541 |
| Mode M0 | |||
|---|---|---|---|
| Quadrant | BADHDUFLAG | Total packets | Discarded packets |
| A | 0 | 45334 | 0 |
| B | 0 | 46589 | 0 |
| C | 0 | 47849 | 0 |
| D | 0 | 88054 | 0 |
| Mode M9 | |||
|---|---|---|---|
| Quadrant | BADHDUFLAG | Total packets | Discarded packets |
| A | 0 | 27 | 0 |
| B | 0 | 26 | 0 |
| C | 0 | 26 | 0 |
| D | 0 | 27 | 0 |
| Mode SS | |||
|---|---|---|---|
| Quadrant | BADHDUFLAG | Total packets | Discarded packets |
| A | 0 | 436 | 0 |
| B | 0 | 442 | 0 |
| C | 0 | 442 | 0 |
| D | 0 | 438 | 0 |
| Quadrant | Total seconds | Saturated seconds | Saturation percentage |
|---|---|---|---|
| A | 21419 | 467 | 2.180307% |
| B | 21439 | 626 | 2.919912% |
| C | 21407 | 792 | 3.699724% |
| D | 21349 | 5304 | 24.844255% |
Noise dominated data is calculated using 1-second bins in cleaned event files. If a bin has >2000 counts, and if more than 50% of those come from <1% of pixels, then it is considered to be noise-dominated and hence unusable.
| Quadrant | # 1 sec bins | Bins with >0 counts | Bins with >2000 counts | High rate bins dominated by noise | Noise dominated (total time) | Noise dominated (detector-on time) | Marked lightcurve |
|---|---|---|---|---|---|---|---|
| A | 45813 | 20168 | 0 | 0 | 0.00% | 0.00% | 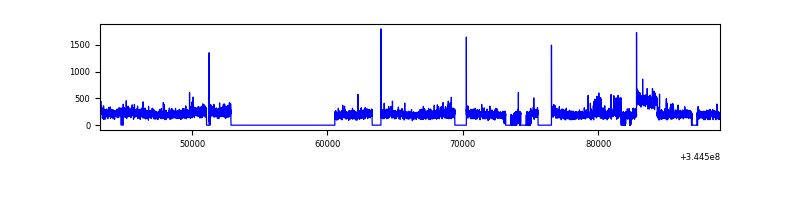 |
| B | 45813 | 20189 | 0 | 0 | 0.00% | 0.00% | 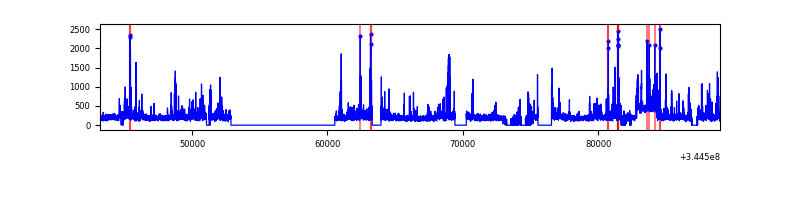 |
| C | 45813 | 20156 | 0 | 0 | 0.00% | 0.00% | 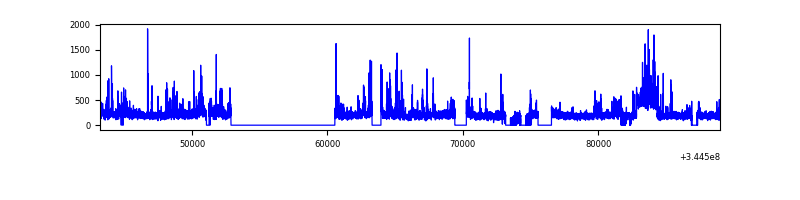 |
| D | 45811 | 20037 | 0 | 0 | 0.00% | 0.00% | 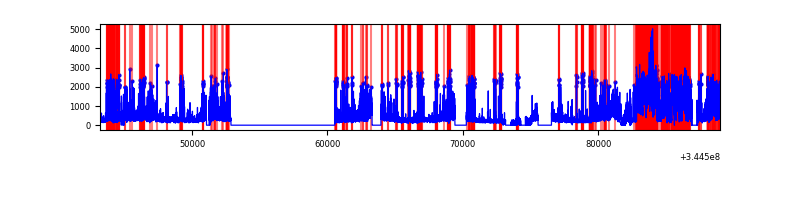 |
Top three noisy pixels from each quadrant. If the there are fewer than three noisy pixels in the level2.evt file, extra rows are filled as -1
| Pixel properties | Quadrant properties | ||||||
|---|---|---|---|---|---|---|---|
| Quadrant | DetID | PixID | Counts | Sigma | Mean | Median | Sigma |
| A | 0 | 29 | 1084 | 8.91 | 343 | 322 | 85.5 |
| A | 7 | 110 | 1033 | 8.31 | 343 | 322 | 85.5 |
| A | 0 | 30 | 977 | 7.66 | 343 | 322 | 85.5 |
| B | 2 | 9 | 1038 | 11.03 | 331 | 316 | 65.5 |
| B | 5 | 128 | 882 | 8.65 | 331 | 316 | 65.5 |
| B | 2 | 8 | 832 | 7.88 | 331 | 316 | 65.5 |
| C | 12 | 241 | 887 | 6.74 | 334 | 312 | 85.3 |
| C | 12 | 250 | 842 | 6.22 | 334 | 312 | 85.3 |
| C | 9 | 209 | 841 | 6.2 | 334 | 312 | 85.3 |
| D | 6 | 231 | 686 | 6.01 | 270 | 247 | 73.1 |
| D | 10 | 189 | 669 | 5.77 | 270 | 247 | 73.1 |
| D | 6 | 38 | 668 | 5.76 | 270 | 247 | 73.1 |
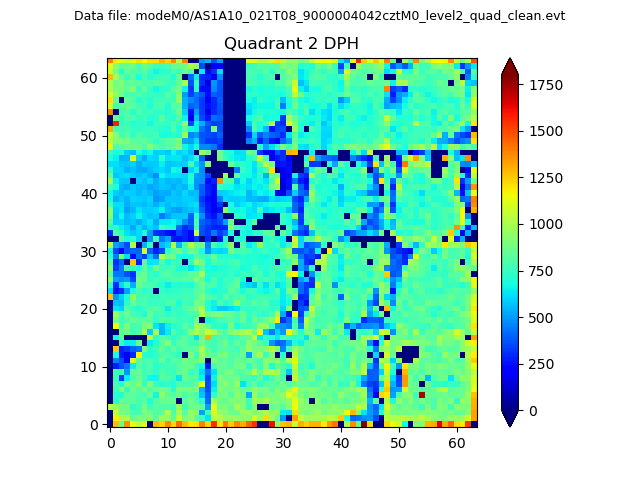
Histogram calculated using DETX and DETY for each event in the final _common_clean file
| Quadrant A | 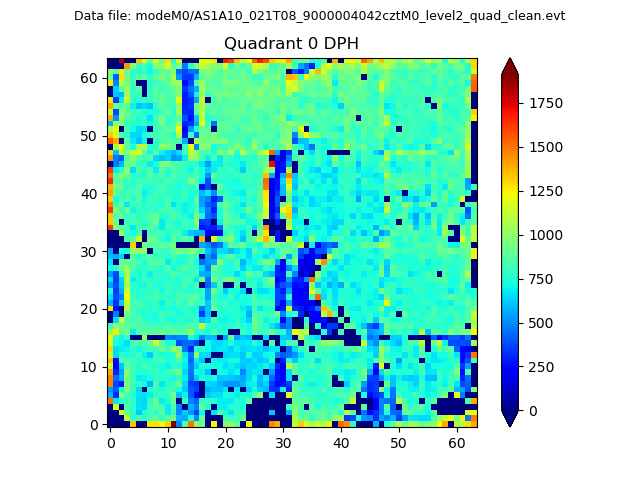 |
 |
Quadrant B |
|---|---|---|---|
| Quadrant D |  |
 |
Quadrant C |
| Plot type | Count rate plots | Images |
|---|---|---|
| Comparison with Poisson distribution Blue bars denote a histogram of data divided into 1 sec bins. Red curve is a Poisson curve with rate = median count rate of data. |
 |
 |
| Quadrant-wise count rates Data is divided into 100 sec bins |
 |
|
| Module-wise count rates for Quadrant A Data is divided into 100 sec bins |
 |
 |
| Module-wise count rates for Quadrant B Data is divided into 100 sec bins |
 |
 |
| Module-wise count rates for Quadrant C Data is divided into 100 sec bins |
 |
 |
| Module-wise count rates for Quadrant D Data is divided into 100 sec bins |
 |
 |
| Parameter | Plot |
|---|---|
| CZT HV Monitor | 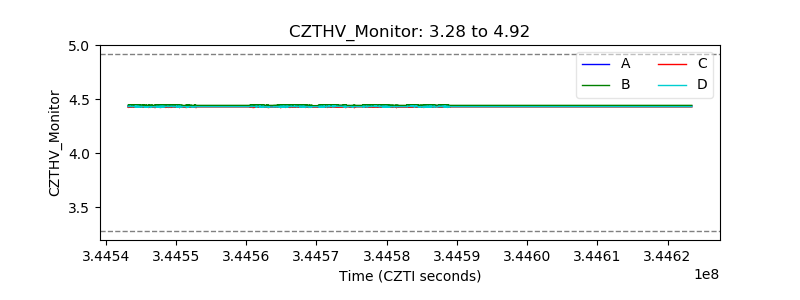 |
| D_VDD | 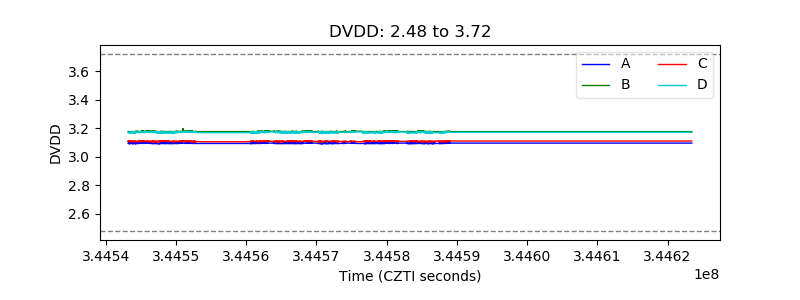 |
| Temperature 1 |  |
| Veto HV Monitor |  |
| Veto LLD |  |
| Alpha Counter |  |
| _CPM_Rate |  |
| CZT Counter |  |
| +2.5 Volts monitor |  |
| +5 Volts monitor |  |
| _ROLL_ROT |  |
| _Roll_DEC | 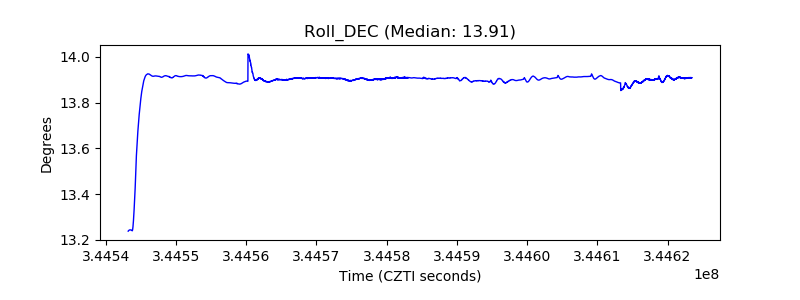 |
| _Roll_RA | 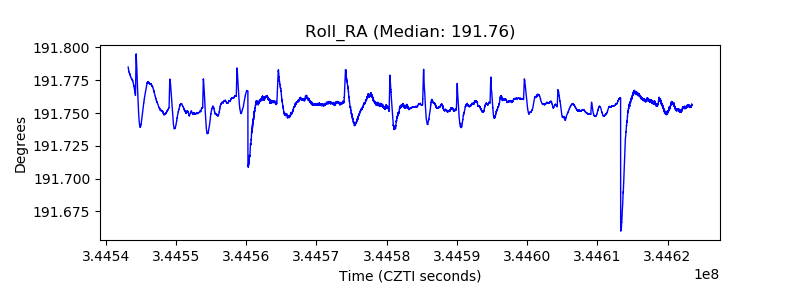 |
| Veto Counter |  |