| Param | Original file | Final file |
|---|---|---|
| Filename | modeM0/AS1A10_021T08_9000004042_27999cztM0_level2.evt | modeM0/AS1A10_021T08_9000004042_27999cztM0_level2_quad_clean.evt |
| Size (bytes) | 300,490,560 | 32,166,720 |
| Size | 286.6 MB | 30.7 MB |
| Events in quadrant A | 1,872,059 | 187,870 |
| Events in quadrant B | 1,888,784 | 192,328 |
| Events in quadrant C | 1,909,841 | 182,827 |
| Events in quadrant D | 3,201,637 | 173,732 |
| Mode M0 | |||
|---|---|---|---|
| Quadrant | BADHDUFLAG | Total packets | Discarded packets |
| A | 0 | 7401 | 0 |
| B | 0 | 7582 | 0 |
| C | 0 | 7619 | 0 |
| D | 0 | 11818 | 0 |
| Mode M9 | |||
|---|---|---|---|
| Quadrant | BADHDUFLAG | Total packets | Discarded packets |
| A | 0 | 1 | 0 |
| B | 0 | 1 | 0 |
| C | 0 | 1 | 0 |
| D | 0 | 1 | 0 |
| Quadrant | Total seconds | Saturated seconds | Saturation percentage |
|---|---|---|---|
| A | 3338 | 147 | 4.403835% |
| B | 3338 | 207 | 6.201318% |
| C | 3338 | 213 | 6.381067% |
| D | 3338 | 525 | 15.727981% |
Noise dominated data is calculated using 1-second bins in cleaned event files. If a bin has >2000 counts, and if more than 50% of those come from <1% of pixels, then it is considered to be noise-dominated and hence unusable.
| Quadrant | # 1 sec bins | Bins with >0 counts | Bins with >2000 counts | High rate bins dominated by noise | Noise dominated (total time) | Noise dominated (detector-on time) | Marked lightcurve |
|---|---|---|---|---|---|---|---|
| A | 3408 | 3340 | 0 | 0 | 0.00% | 0.00% |  |
| B | 3408 | 3338 | 5 | 5 | 0.15% | 0.15% |  |
| C | 3408 | 3339 | 0 | 0 | 0.00% | 0.00% |  |
| D | 3408 | 3340 | 377 | 377 | 11.06% | 11.29% |  |
Top three noisy pixels from each quadrant. If the there are fewer than three noisy pixels in the level2.evt file, extra rows are filled as -1
| Pixel properties | Quadrant properties | ||||||
|---|---|---|---|---|---|---|---|
| Quadrant | DetID | PixID | Counts | Sigma | Mean | Median | Sigma |
| A | 0 | 13 | 69316 | 713.32 | 467 | 456 | 96.5 |
| A | 3 | 137 | 4786 | 44.85 | 467 | 456 | 96.5 |
| A | 13 | 254 | 4697 | 43.93 | 467 | 456 | 96.5 |
| B | 10 | 245 | 51632 | 558.32 | 455 | 442 | 91.7 |
| B | 0 | 190 | 41587 | 448.76 | 455 | 442 | 91.7 |
| B | 12 | 111 | 11499 | 120.6 | 455 | 442 | 91.7 |
| C | 2 | 16 | 80434 | 754.23 | 442 | 444 | 106.1 |
| C | 14 | 238 | 69952 | 655.4 | 442 | 444 | 106.1 |
| C | 3 | 233 | 35490 | 330.45 | 442 | 444 | 106.1 |
| D | 1 | 52 | 706595 | 6861.75 | 425 | 414 | 102.9 |
| D | 8 | 195 | 691131 | 6711.49 | 425 | 414 | 102.9 |
| D | 7 | 80 | 136331 | 1320.66 | 425 | 414 | 102.9 |
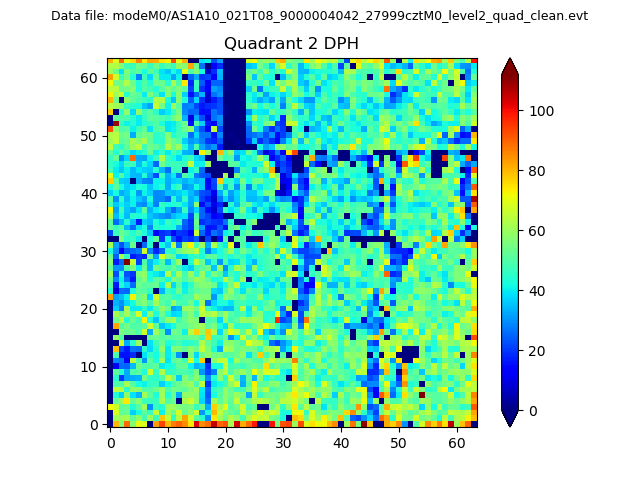
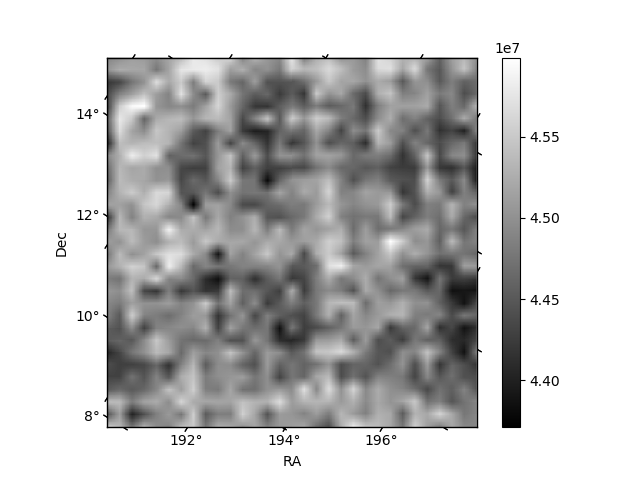
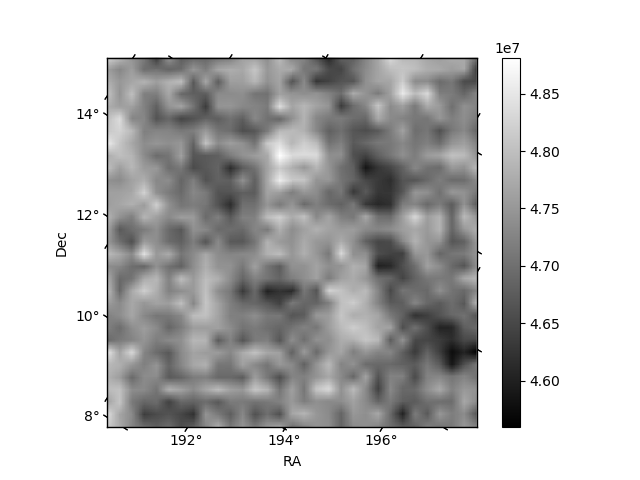
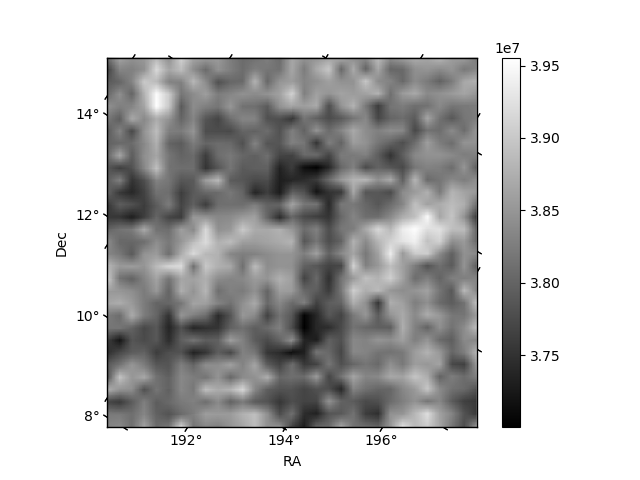
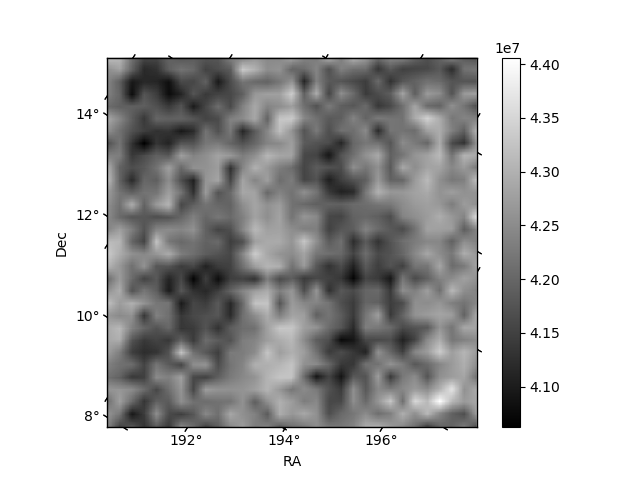
Histogram calculated using DETX and DETY for each event in the final _common_clean file
| Quadrant A | 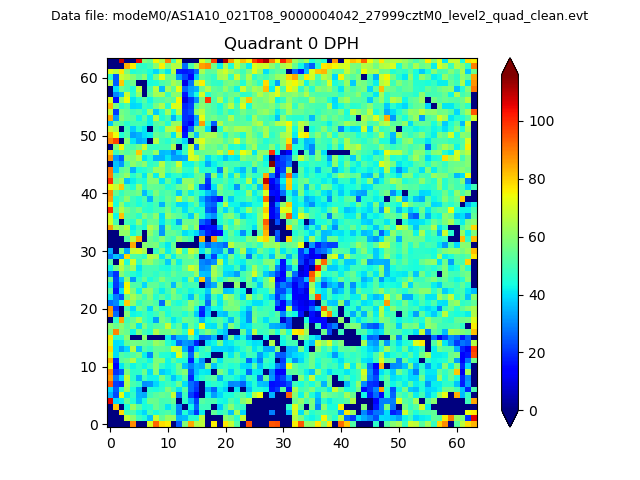 |
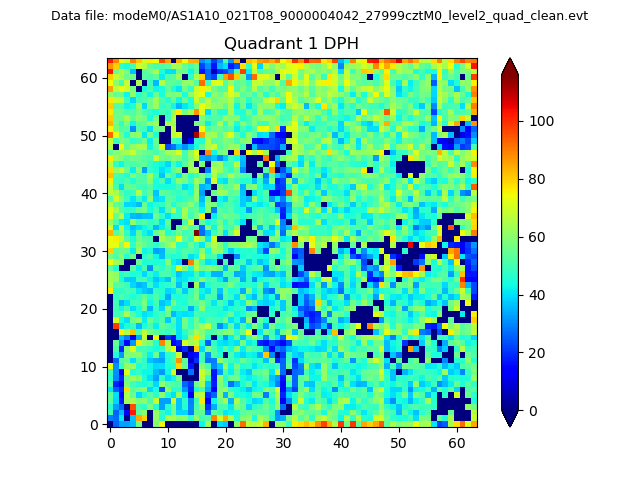 |
Quadrant B |
|---|---|---|---|
| Quadrant D | 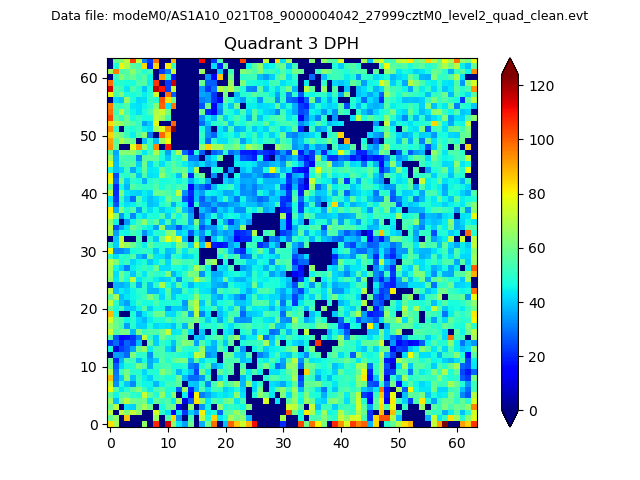 |
 |
Quadrant C |
| Plot type | Count rate plots | Images |
|---|---|---|
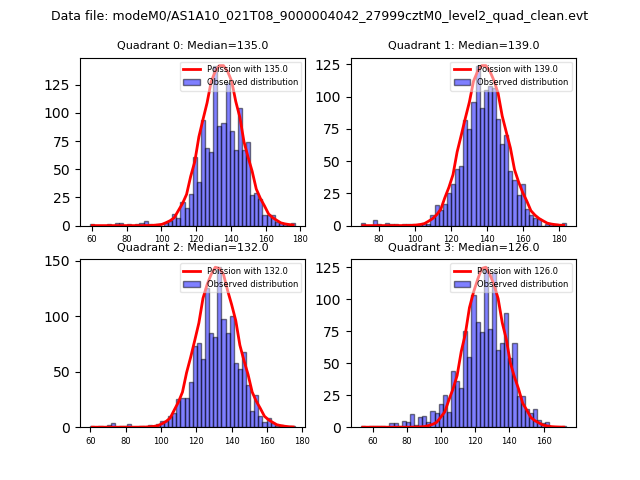
| Comparison with Poisson distribution Blue bars denote a histogram of data divided into 1 sec bins. Red curve is a Poisson curve with rate = median count rate of data. |
 |
 |
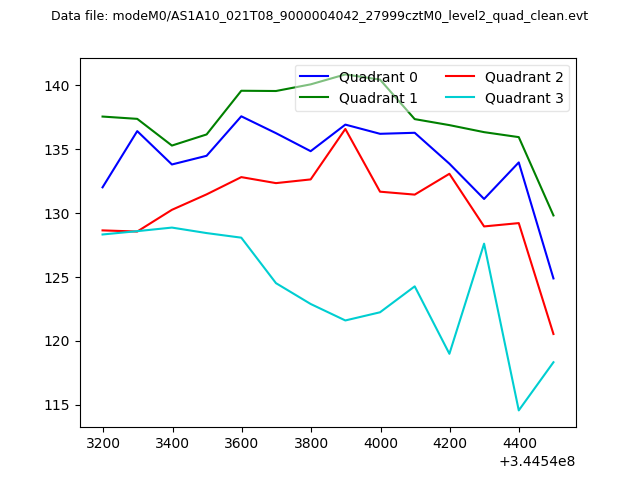
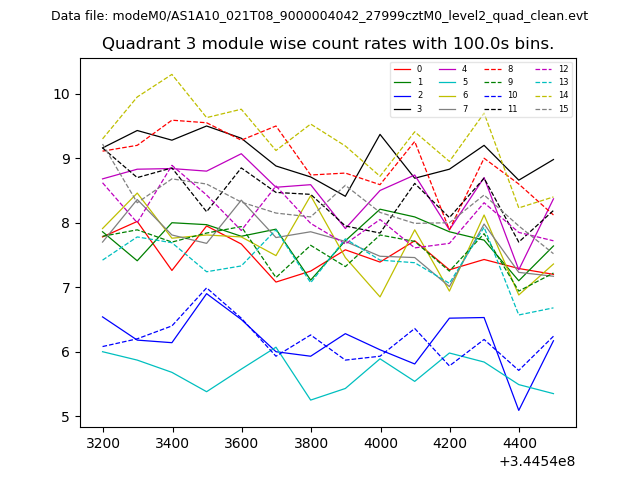
| Quadrant-wise count rates Data is divided into 100 sec bins |
 |
|
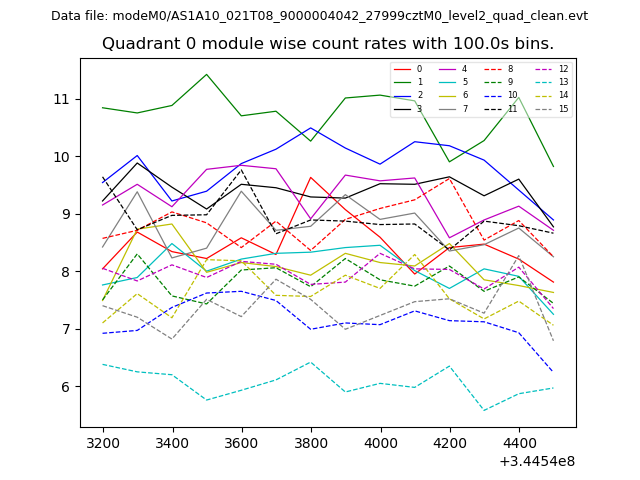
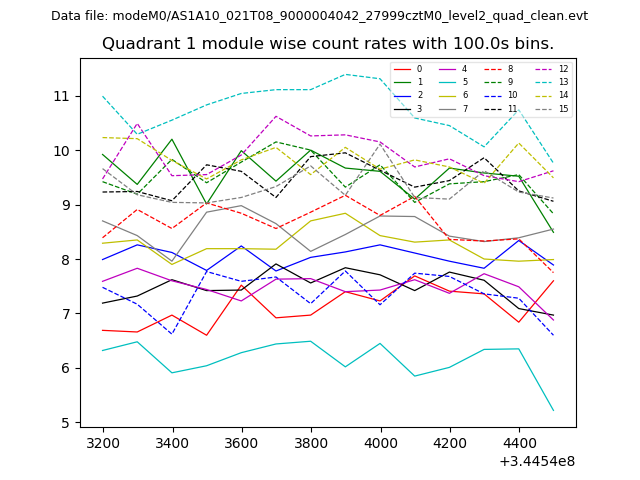
| Module-wise count rates for Quadrant A Data is divided into 100 sec bins |
 |
 |
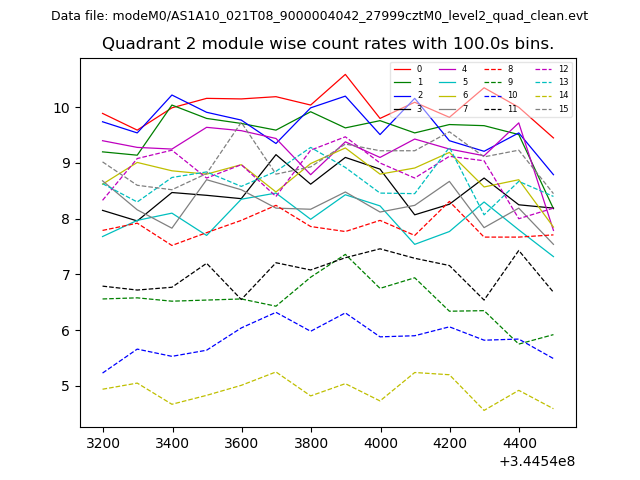
| Module-wise count rates for Quadrant B Data is divided into 100 sec bins |
 |
 |
| Module-wise count rates for Quadrant C Data is divided into 100 sec bins |
 |
 |
| Module-wise count rates for Quadrant D Data is divided into 100 sec bins |
 |
 |
| Parameter | Plot |
|---|---|
| CZT HV Monitor | 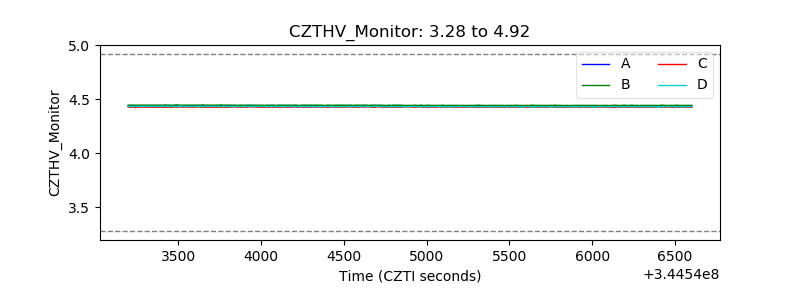 |
| D_VDD | 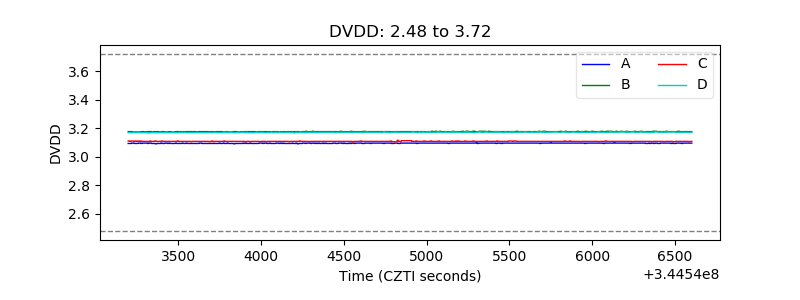 |
| Temperature 1 | 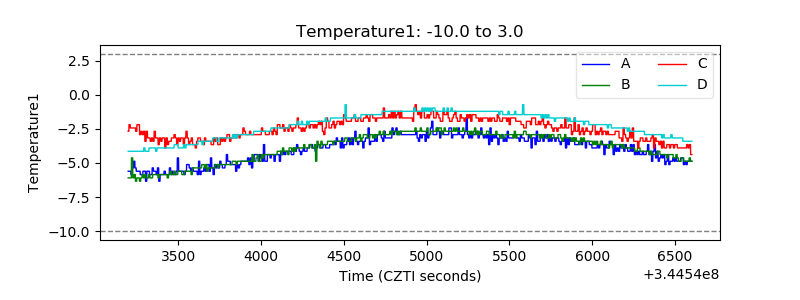 |
| Veto HV Monitor | 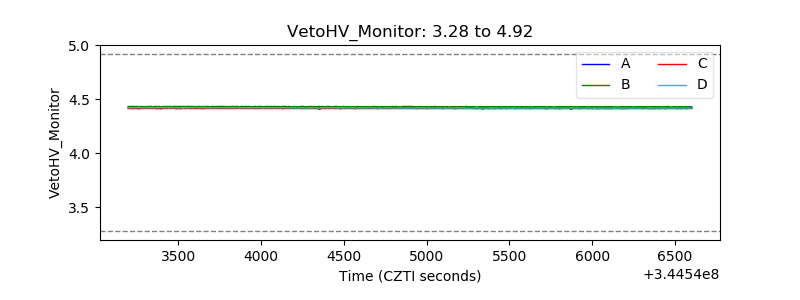 |
| Veto LLD | 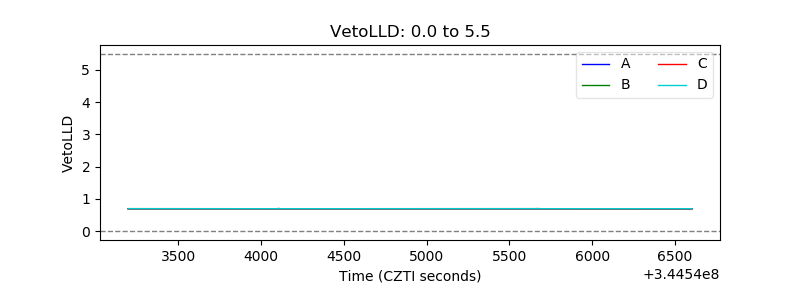 |
| Alpha Counter | 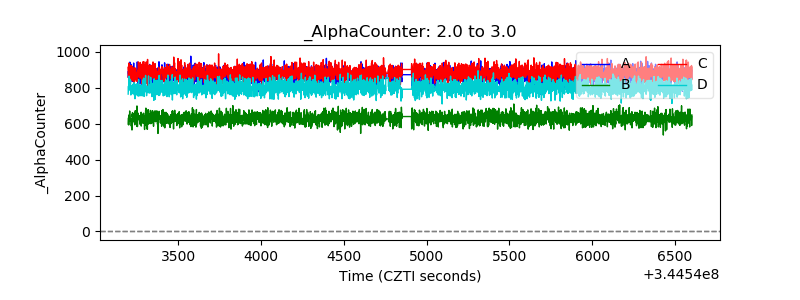 |
| _CPM_Rate |  |
| CZT Counter | 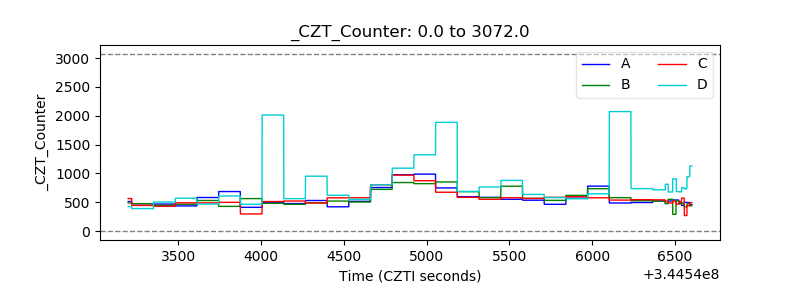 |
| +2.5 Volts monitor | 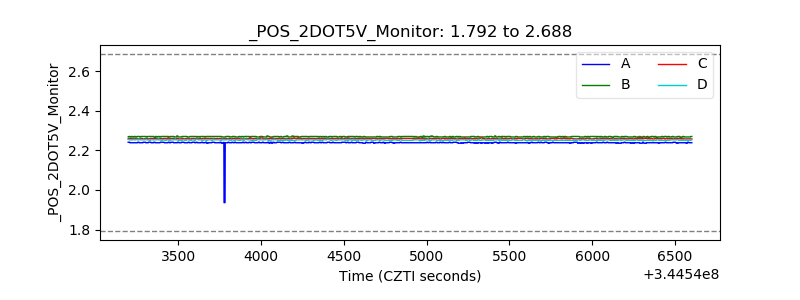 |
| +5 Volts monitor |  |
| _ROLL_ROT | 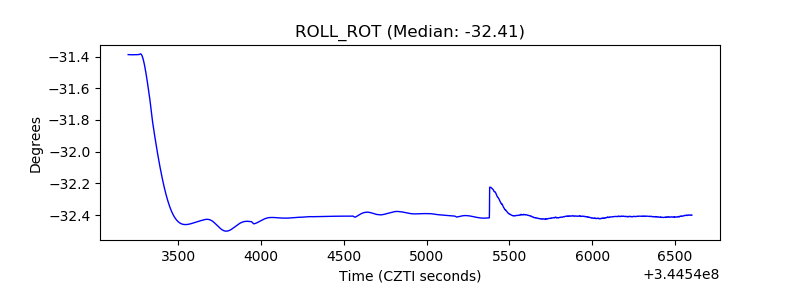 |
| _Roll_DEC | 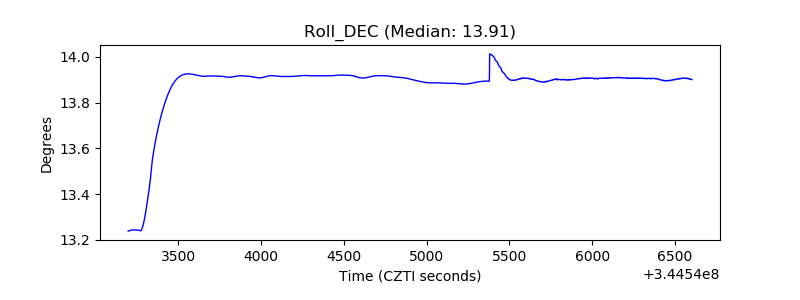 |
| _Roll_RA | 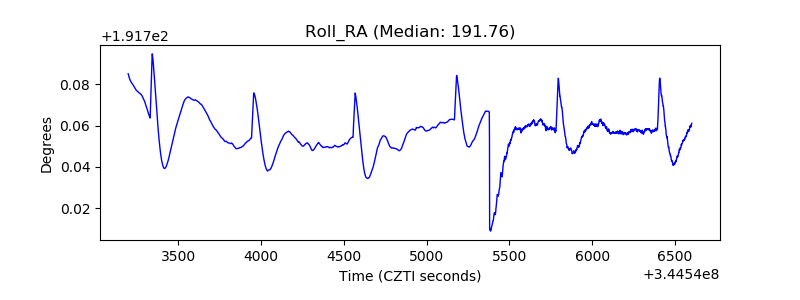 |
| Veto Counter | 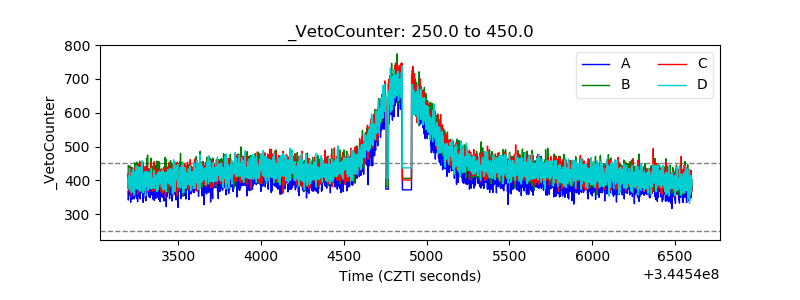 |