| Param | Original file | Final file |
|---|---|---|
| Filename | modeM0/AS1A10_021T08_9000004042_28000cztM0_level2.evt | modeM0/AS1A10_021T08_9000004042_28000cztM0_level2_quad_clean.evt |
| Size (bytes) | 553,898,880 | 79,231,680 |
| Size | 528.2 MB | 75.6 MB |
| Events in quadrant A | 3,567,473 | 485,704 |
| Events in quadrant B | 3,612,018 | 491,123 |
| Events in quadrant C | 3,757,916 | 470,984 |
| Events in quadrant D | 5,362,533 | 463,625 |
| Mode M0 | |||
|---|---|---|---|
| Quadrant | BADHDUFLAG | Total packets | Discarded packets |
| A | 0 | 14896 | 0 |
| B | 0 | 15089 | 0 |
| C | 0 | 15496 | 0 |
| D | 0 | 20692 | 0 |
| Mode M9 | |||
|---|---|---|---|
| Quadrant | BADHDUFLAG | Total packets | Discarded packets |
| A | 0 | 2 | 0 |
| B | 0 | 2 | 0 |
| C | 0 | 2 | 0 |
| D | 0 | 2 | 0 |
| Quadrant | Total seconds | Saturated seconds | Saturation percentage |
|---|---|---|---|
| A | 7001 | 131 | 1.871161% |
| B | 7002 | 166 | 2.370751% |
| C | 7002 | 211 | 3.013425% |
| D | 7002 | 486 | 6.940874% |
Noise dominated data is calculated using 1-second bins in cleaned event files. If a bin has >2000 counts, and if more than 50% of those come from <1% of pixels, then it is considered to be noise-dominated and hence unusable.
| Quadrant | # 1 sec bins | Bins with >0 counts | Bins with >2000 counts | High rate bins dominated by noise | Noise dominated (total time) | Noise dominated (detector-on time) | Marked lightcurve |
|---|---|---|---|---|---|---|---|
| A | 7211 | 7002 | 0 | 0 | 0.00% | 0.00% | 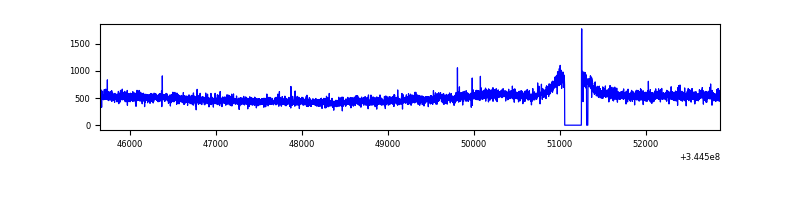 |
| B | 7212 | 7003 | 1 | 1 | 0.01% | 0.01% | 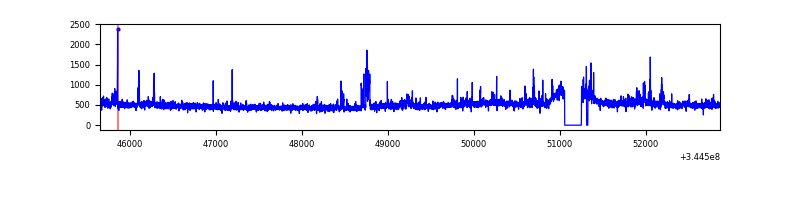 |
| C | 7212 | 7003 | 7 | 7 | 0.10% | 0.10% | 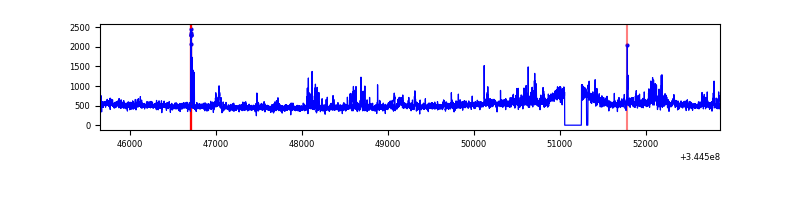 |
| D | 7212 | 7003 | 335 | 335 | 4.65% | 4.78% | 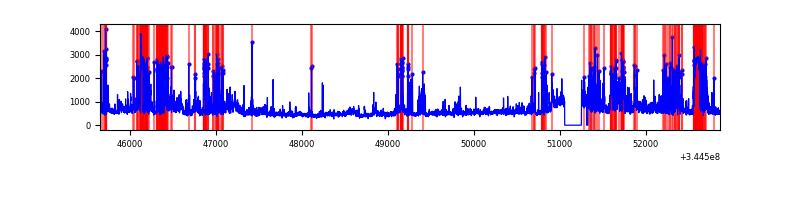 |
Top three noisy pixels from each quadrant. If the there are fewer than three noisy pixels in the level2.evt file, extra rows are filled as -1
| Pixel properties | Quadrant properties | ||||||
|---|---|---|---|---|---|---|---|
| Quadrant | DetID | PixID | Counts | Sigma | Mean | Median | Sigma |
| A | 0 | 13 | 177547 | 992.95 | 877 | 858 | 177.9 |
| A | 13 | 254 | 11271 | 58.52 | 877 | 858 | 177.9 |
| A | 3 | 137 | 8566 | 43.32 | 877 | 858 | 177.9 |
| B | 10 | 245 | 158732 | 933.66 | 867 | 841 | 169.1 |
| B | 0 | 190 | 26232 | 150.14 | 867 | 841 | 169.1 |
| B | 12 | 111 | 21235 | 120.59 | 867 | 841 | 169.1 |
| C | 3 | 233 | 265525 | 1340.15 | 839 | 846 | 197.5 |
| C | 14 | 238 | 134495 | 676.71 | 839 | 846 | 197.5 |
| C | 2 | 16 | 91141 | 457.19 | 839 | 846 | 197.5 |
| D | 8 | 195 | 801533 | 4007.17 | 833 | 812 | 199.8 |
| D | 1 | 52 | 602168 | 3009.45 | 833 | 812 | 199.8 |
| D | 7 | 80 | 412535 | 2060.45 | 833 | 812 | 199.8 |
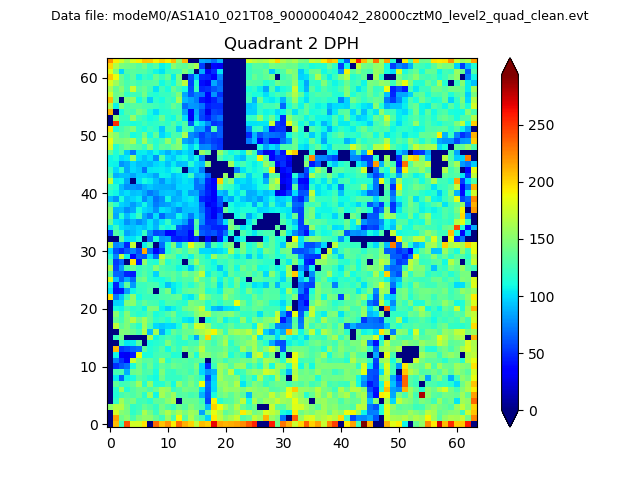
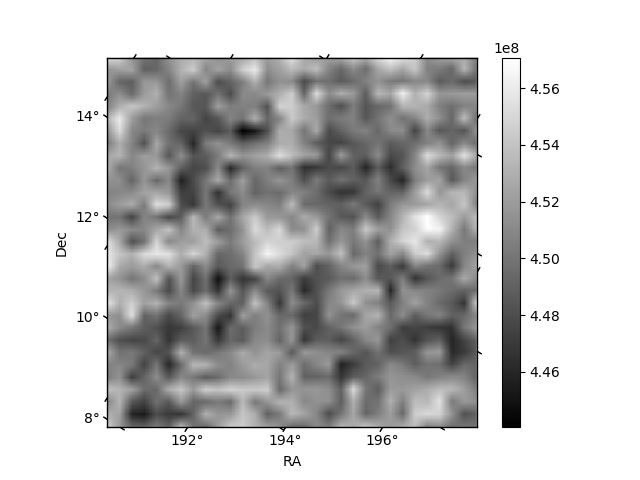
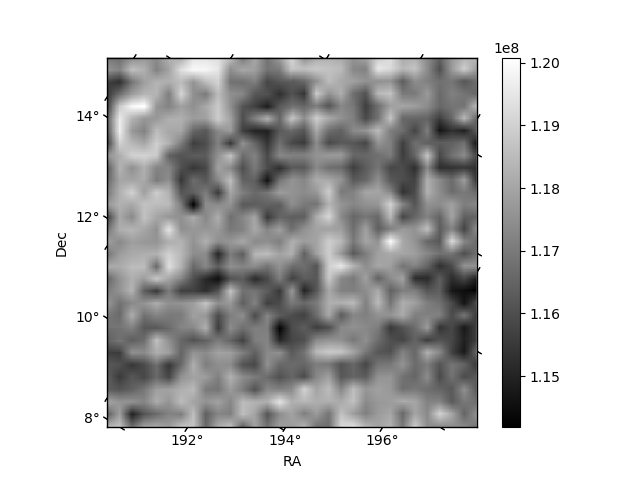
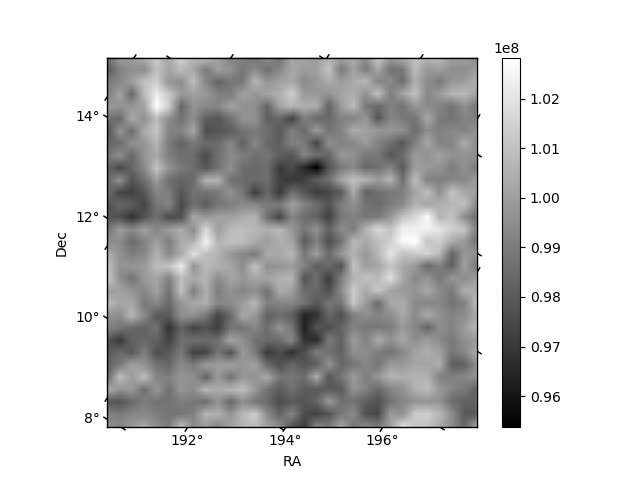
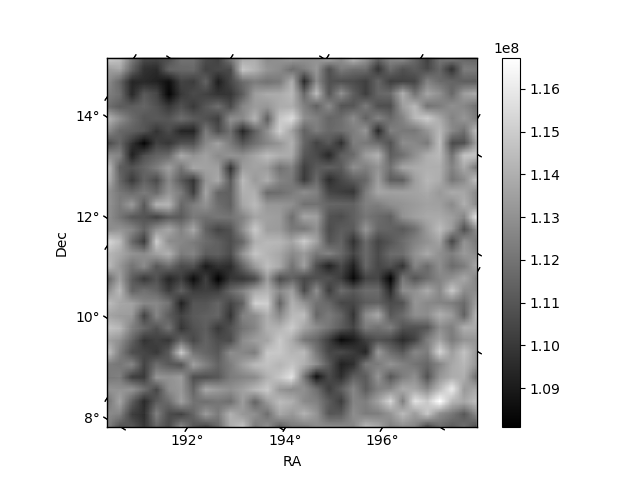
Histogram calculated using DETX and DETY for each event in the final _common_clean file
| Quadrant A | 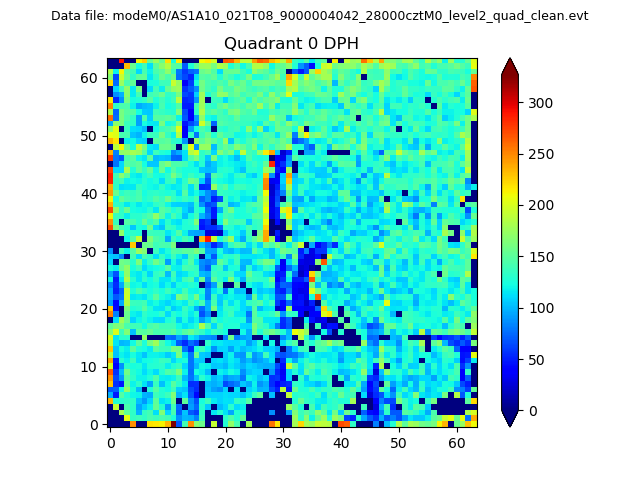 |
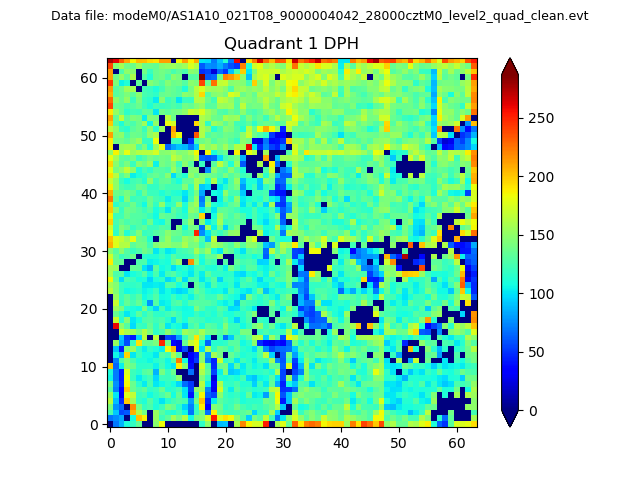 |
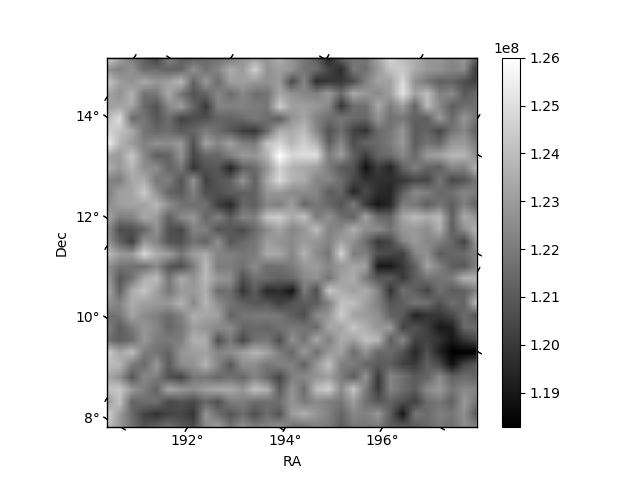
Quadrant B |
|---|---|---|---|
| Quadrant D | 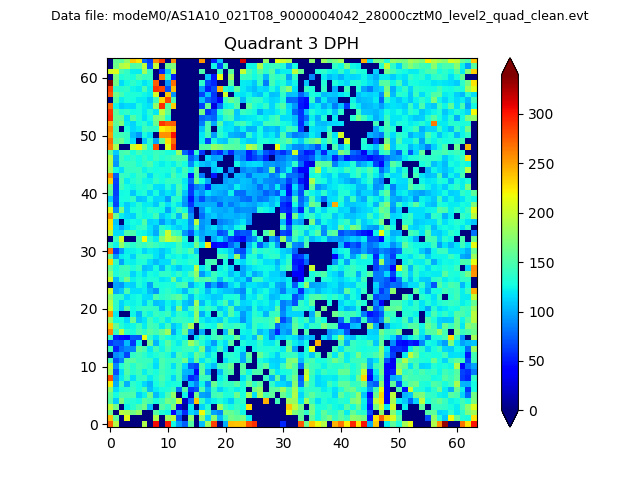 |
 |
Quadrant C |
| Plot type | Count rate plots | Images |
|---|---|---|
| Comparison with Poisson distribution Blue bars denote a histogram of data divided into 1 sec bins. Red curve is a Poisson curve with rate = median count rate of data. |
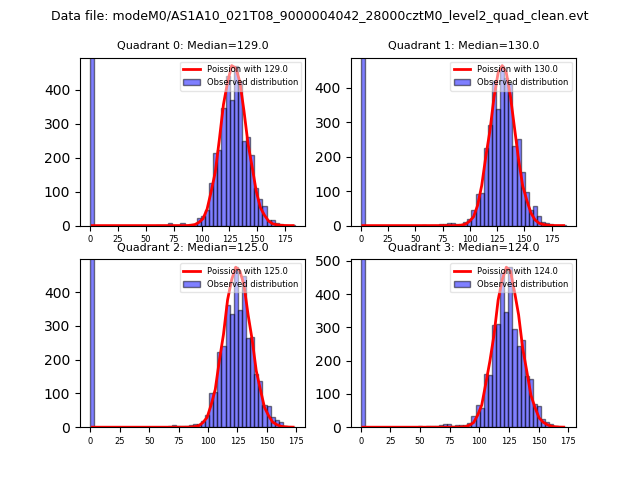 |
 |
| Quadrant-wise count rates Data is divided into 100 sec bins |
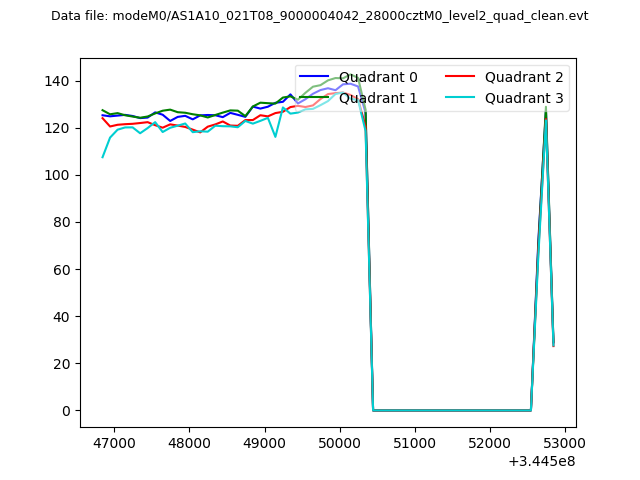 |
|
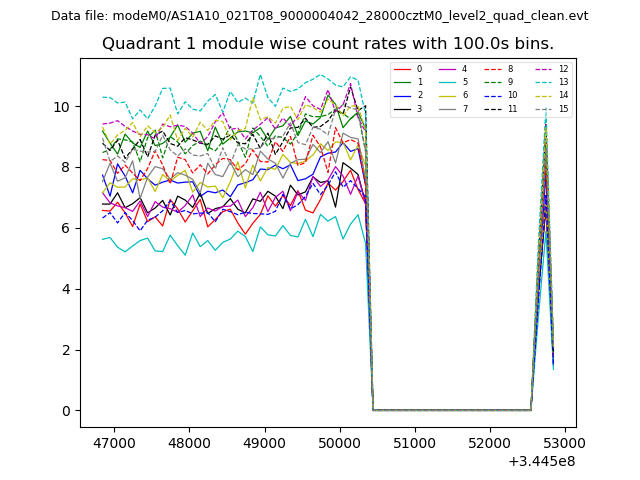
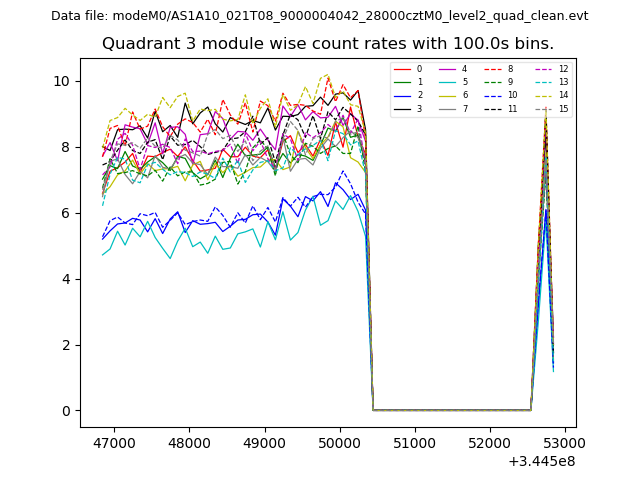
| Module-wise count rates for Quadrant A Data is divided into 100 sec bins |
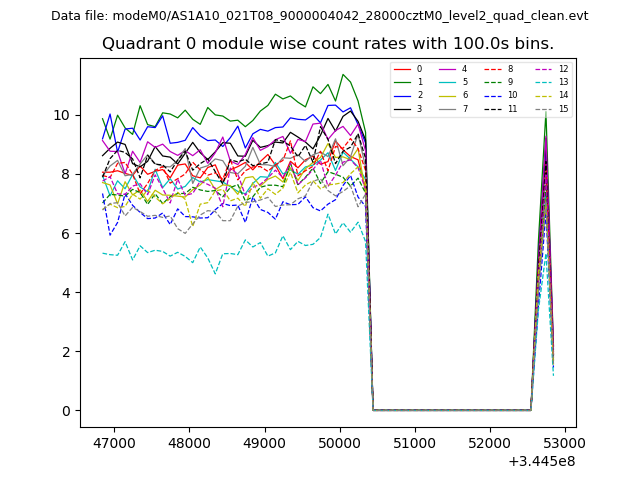 |
 |
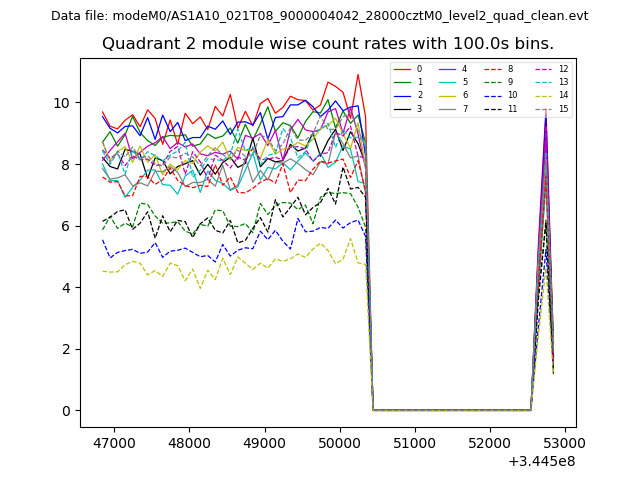
| Module-wise count rates for Quadrant B Data is divided into 100 sec bins |
 |
 |
| Module-wise count rates for Quadrant C Data is divided into 100 sec bins |
 |
 |
| Module-wise count rates for Quadrant D Data is divided into 100 sec bins |
 |
 |
| Parameter | Plot |
|---|---|
| CZT HV Monitor | 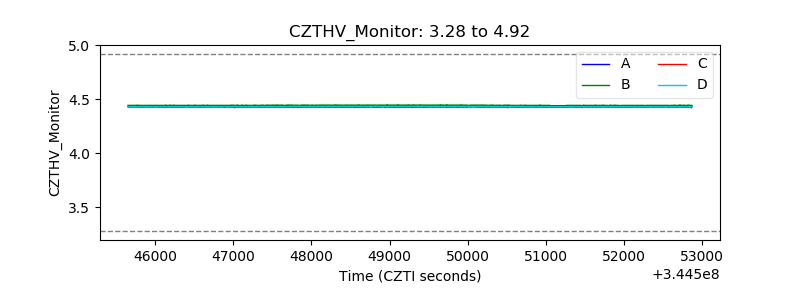 |
| D_VDD | 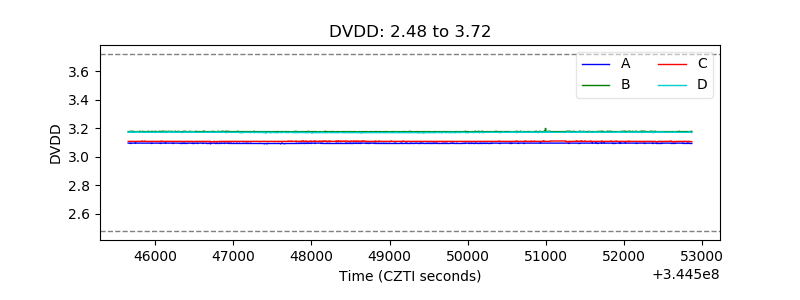 |
| Temperature 1 | 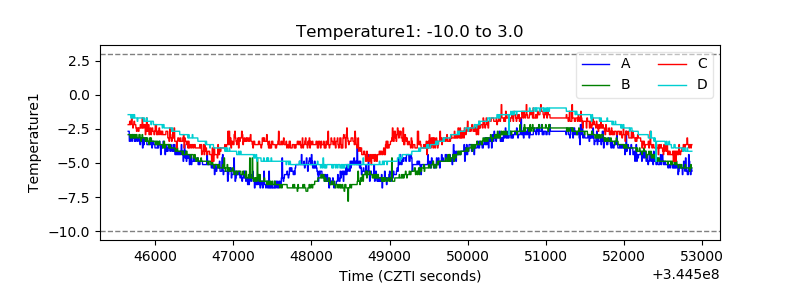 |
| Veto HV Monitor | 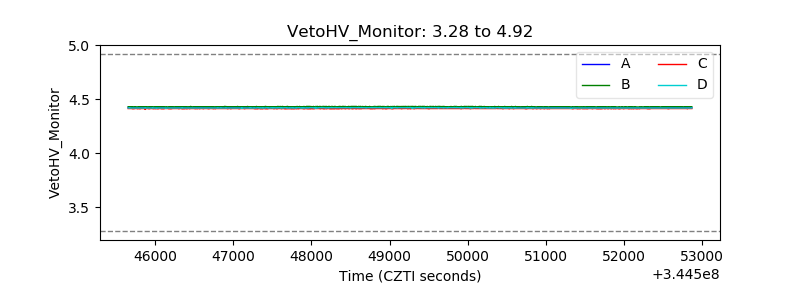 |
| Veto LLD | 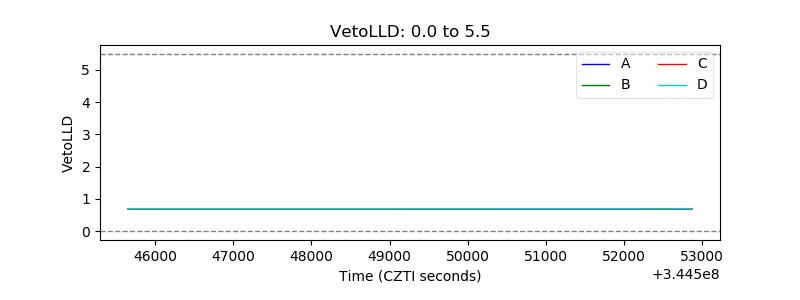 |
| Alpha Counter | 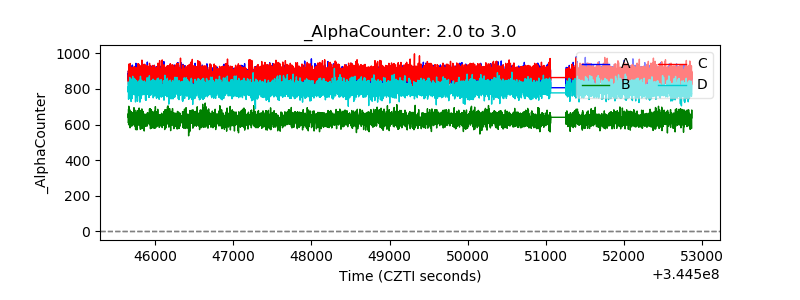 |
| _CPM_Rate | 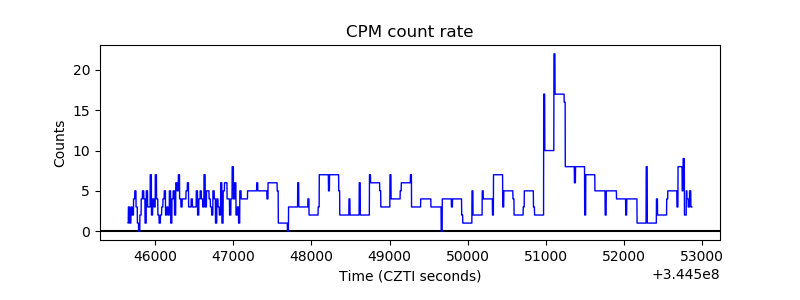 |
| CZT Counter | 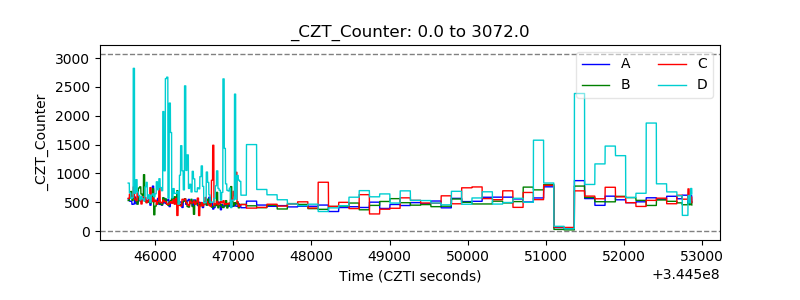 |
| +2.5 Volts monitor |  |
| +5 Volts monitor | 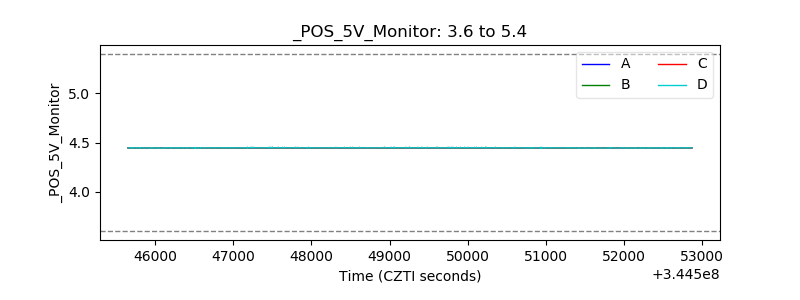 |
| _ROLL_ROT | 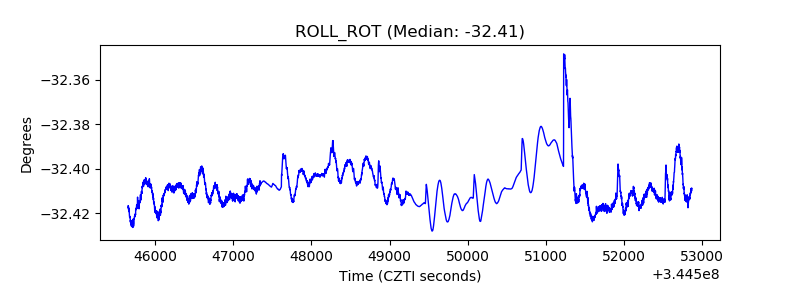 |
| _Roll_DEC | 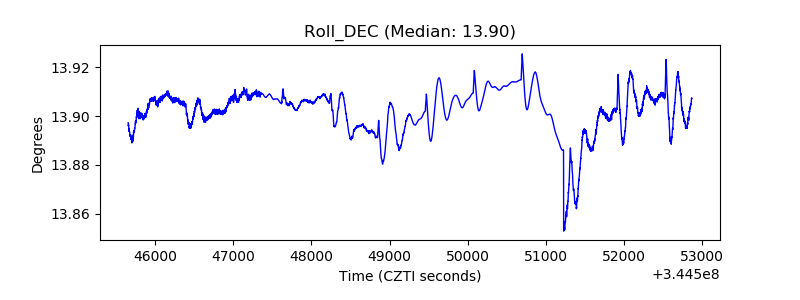 |
| _Roll_RA | 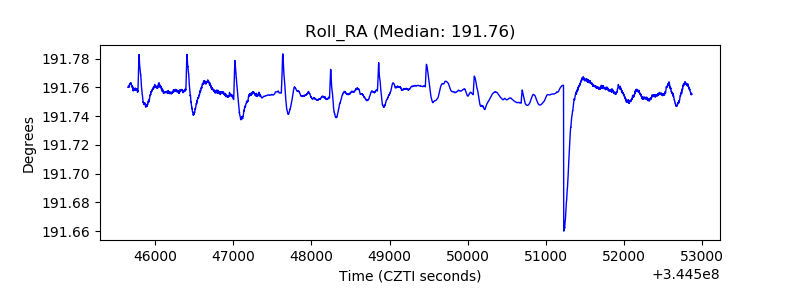 |
| Veto Counter | 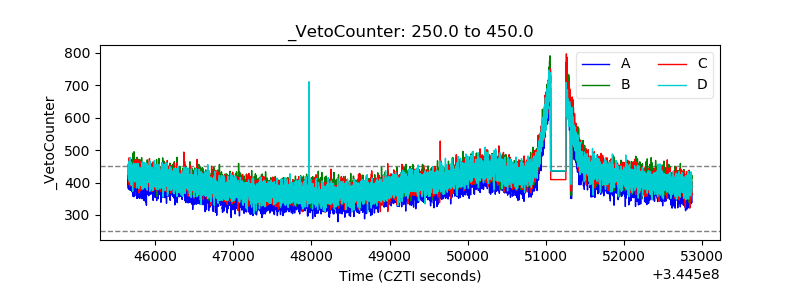 |