| Param | Original file | Final file |
|---|---|---|
| Filename | modeM0/AS1A10_021T08_9000004042_28004cztM0_level2.evt | modeM0/AS1A10_021T08_9000004042_28004cztM0_level2_quad_clean.evt |
| Size (bytes) | 1,026,495,360 | 194,042,880 |
| Size | 978.9 MB | 185.1 MB |
| Events in quadrant A | 6,657,204 | 1,251,596 |
| Events in quadrant B | 6,980,229 | 1,277,884 |
| Events in quadrant C | 6,971,307 | 1,217,346 |
| Events in quadrant D | 9,543,506 | 1,175,413 |
| Mode M0 | |||
|---|---|---|---|
| Quadrant | BADHDUFLAG | Total packets | Discarded packets |
| A | 0 | 28589 | 0 |
| B | 0 | 29598 | 0 |
| C | 0 | 29600 | 0 |
| D | 0 | 37998 | 0 |
| Mode M9 | |||
|---|---|---|---|
| Quadrant | BADHDUFLAG | Total packets | Discarded packets |
| A | 0 | 24 | 0 |
| B | 0 | 24 | 0 |
| C | 0 | 24 | 0 |
| D | 0 | 24 | 0 |
| Quadrant | Total seconds | Saturated seconds | Saturation percentage |
|---|---|---|---|
| A | 13776 | 86 | 0.624274% |
| B | 13760 | 184 | 1.337209% |
| C | 13768 | 227 | 1.648751% |
| D | 13747 | 642 | 4.670110% |
Noise dominated data is calculated using 1-second bins in cleaned event files. If a bin has >2000 counts, and if more than 50% of those come from <1% of pixels, then it is considered to be noise-dominated and hence unusable.
| Quadrant | # 1 sec bins | Bins with >0 counts | Bins with >2000 counts | High rate bins dominated by noise | Noise dominated (total time) | Noise dominated (detector-on time) | Marked lightcurve |
|---|---|---|---|---|---|---|---|
| A | 17599 | 13916 | 6 | 6 | 0.03% | 0.04% |  |
| B | 17599 | 13893 | 35 | 35 | 0.20% | 0.25% |  |
| C | 17599 | 13907 | 8 | 8 | 0.05% | 0.06% |  |
| D | 17599 | 13884 | 527 | 527 | 2.99% | 3.80% |  |
Top three noisy pixels from each quadrant. If the there are fewer than three noisy pixels in the level2.evt file, extra rows are filled as -1
| Pixel properties | Quadrant properties | ||||||
|---|---|---|---|---|---|---|---|
| Quadrant | DetID | PixID | Counts | Sigma | Mean | Median | Sigma |
| A | 0 | 13 | 98430 | 283.53 | 1695 | 1660 | 341.3 |
| A | 13 | 254 | 20698 | 55.78 | 1695 | 1660 | 341.3 |
| A | 8 | 192 | 19350 | 51.83 | 1695 | 1660 | 341.3 |
| B | 10 | 245 | 307495 | 951.04 | 1682 | 1638 | 321.6 |
| B | 12 | 111 | 40499 | 120.83 | 1682 | 1638 | 321.6 |
| B | 0 | 190 | 38908 | 115.89 | 1682 | 1638 | 321.6 |
| C | 14 | 238 | 260714 | 683.75 | 1622 | 1631 | 378.9 |
| C | 3 | 233 | 235646 | 617.59 | 1622 | 1631 | 378.9 |
| C | 2 | 16 | 124385 | 323.96 | 1622 | 1631 | 378.9 |
| D | 8 | 195 | 1710462 | 4449.92 | 1610 | 1570 | 384.0 |
| D | 1 | 52 | 1062829 | 2763.5 | 1610 | 1570 | 384.0 |
| D | 7 | 80 | 315549 | 817.59 | 1610 | 1570 | 384.0 |
Histogram calculated using DETX and DETY for each event in the final _common_clean file
| Quadrant A | 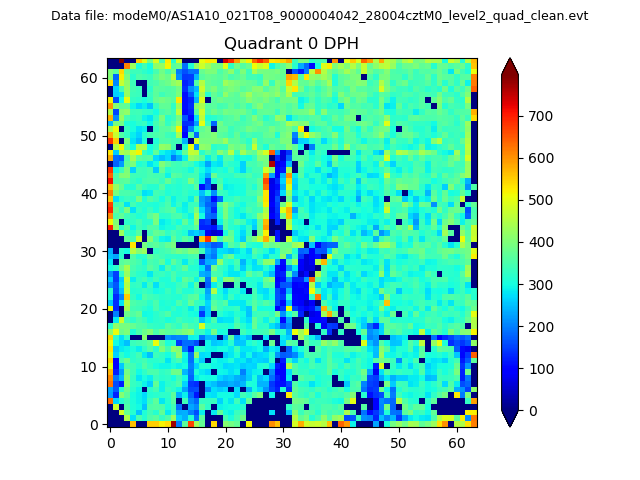 |
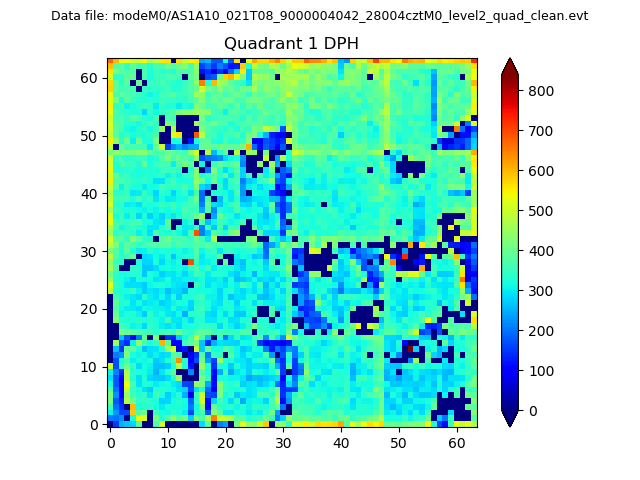 |
Quadrant B |
|---|---|---|---|
| Quadrant D |  |
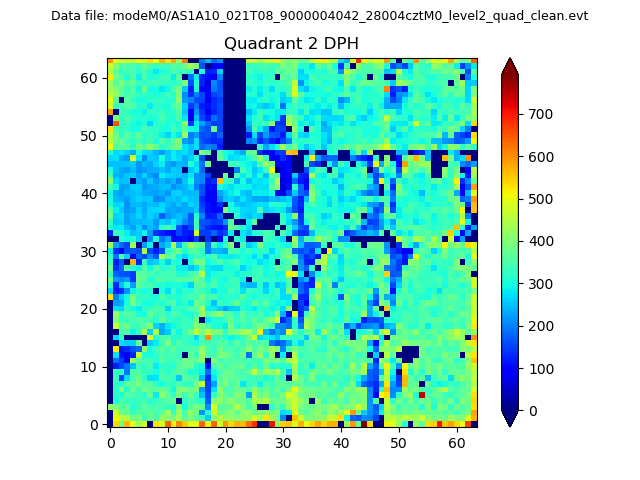 |
Quadrant C |
| Plot type | Count rate plots | Images |
|---|---|---|
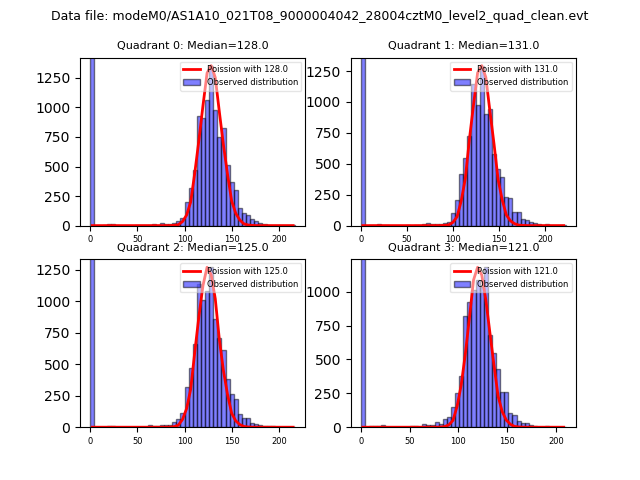
| Comparison with Poisson distribution Blue bars denote a histogram of data divided into 1 sec bins. Red curve is a Poisson curve with rate = median count rate of data. |
 |
 |
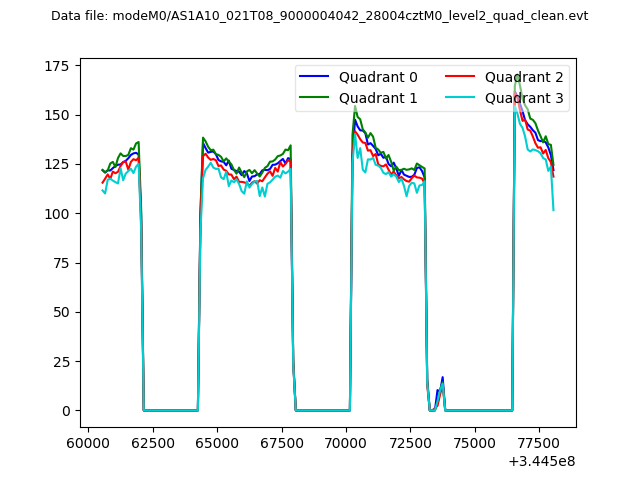
| Quadrant-wise count rates Data is divided into 100 sec bins |
 |
|
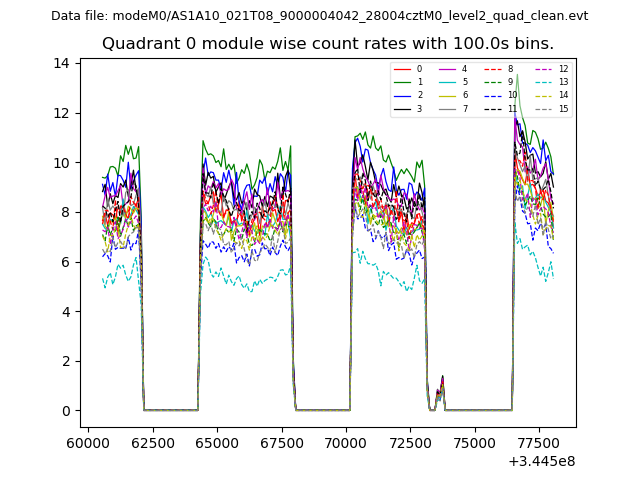
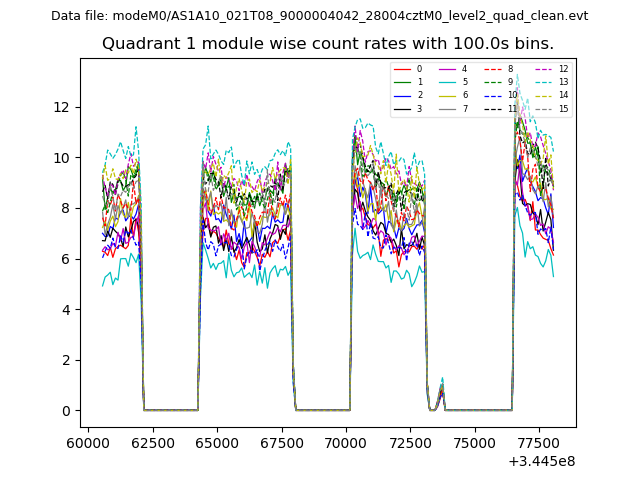
| Module-wise count rates for Quadrant A Data is divided into 100 sec bins |
 |
 |
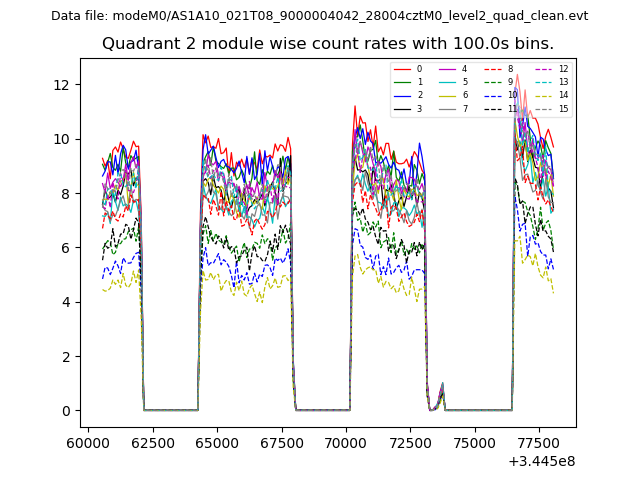
| Module-wise count rates for Quadrant B Data is divided into 100 sec bins |
 |
 |
| Module-wise count rates for Quadrant C Data is divided into 100 sec bins |
 |
 |
| Module-wise count rates for Quadrant D Data is divided into 100 sec bins |
 |
 |
| Parameter | Plot |
|---|---|
| CZT HV Monitor | 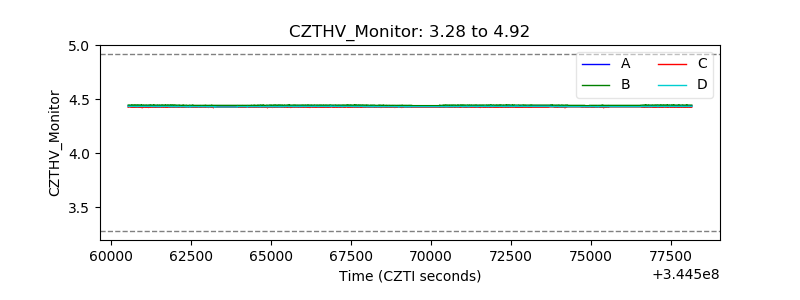 |
| D_VDD | 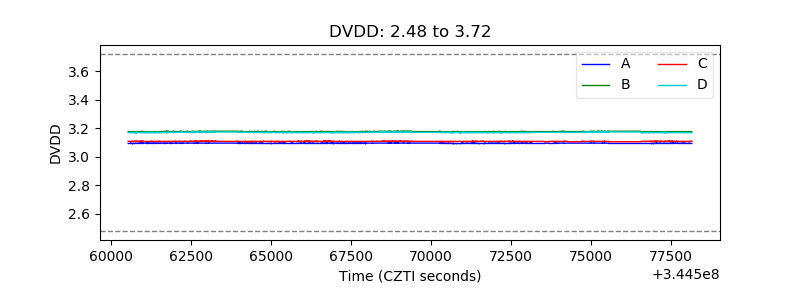 |
| Temperature 1 | 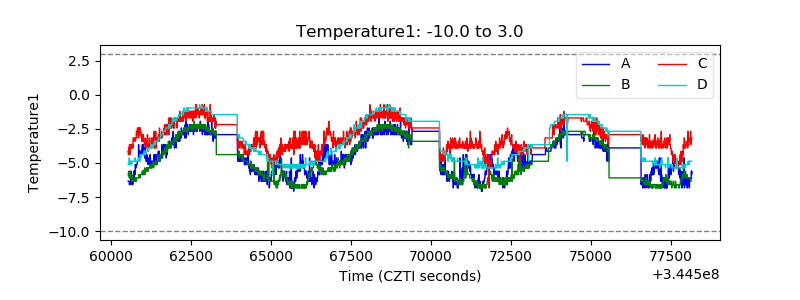 |
| Veto HV Monitor | 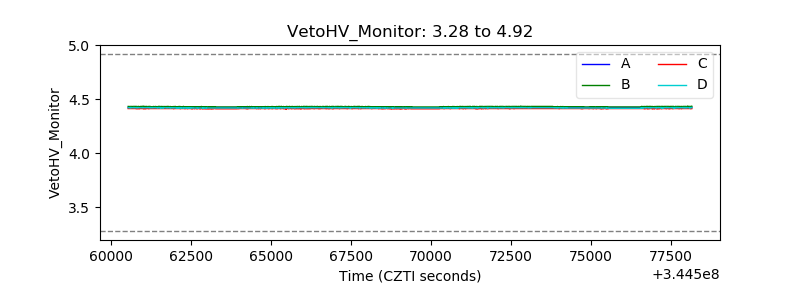 |
| Veto LLD | 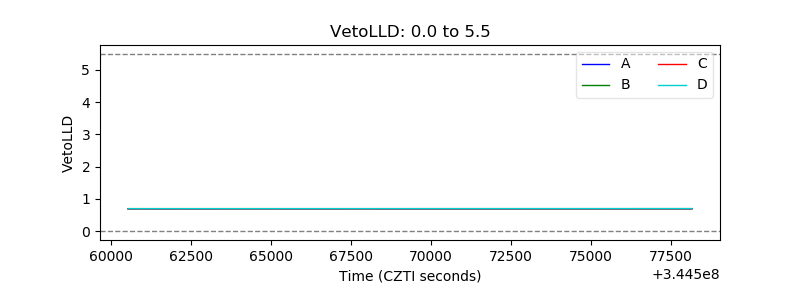 |
| Alpha Counter |  |
| _CPM_Rate | 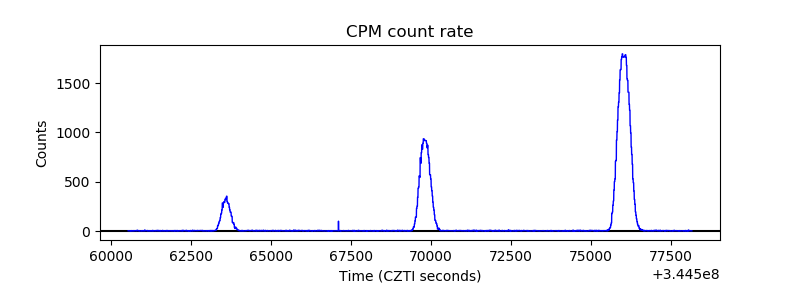 |
| CZT Counter | 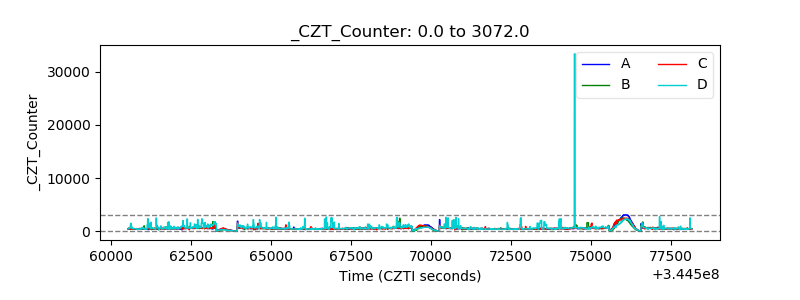 |
| +2.5 Volts monitor | 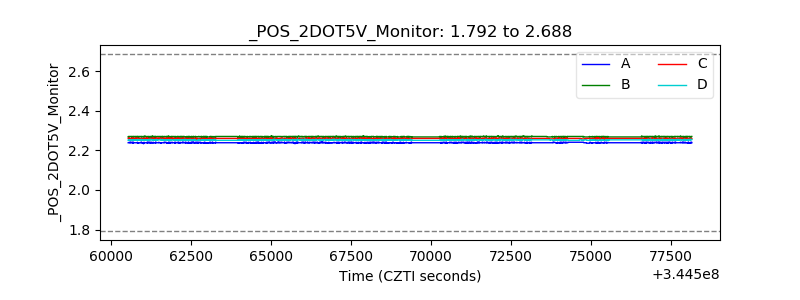 |
| +5 Volts monitor |  |
| _ROLL_ROT |  |
| _Roll_DEC | 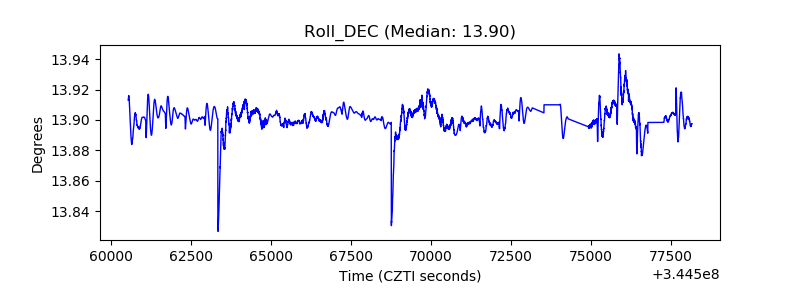 |
| _Roll_RA | 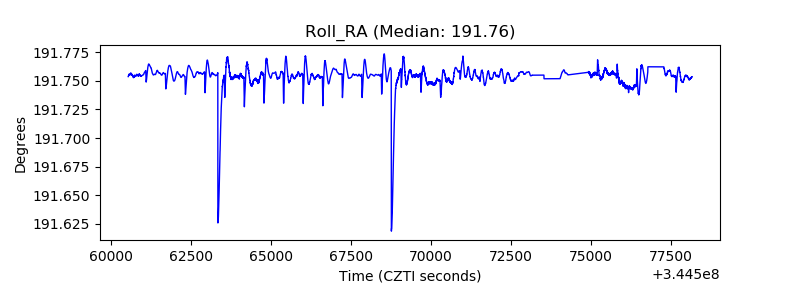 |
| Veto Counter | 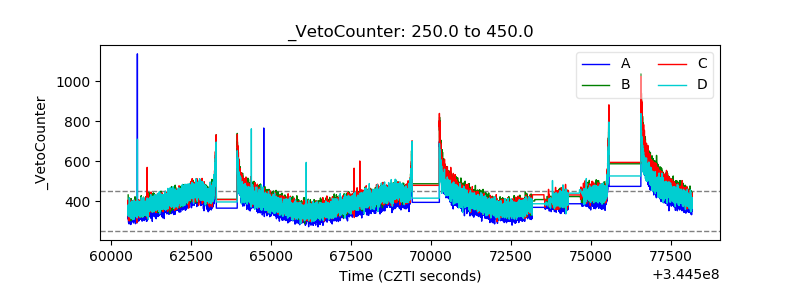 |