| Param | Original file | Final file |
|---|---|---|
| Filename | modeM0/AS1A10_021T08_9000004042_28006cztM0_level2.evt | modeM0/AS1A10_021T08_9000004042_28006cztM0_level2_quad_clean.evt |
| Size (bytes) | 453,260,160 | 85,268,160 |
| Size | 432.3 MB | 81.3 MB |
| Events in quadrant A | 2,924,472 | 549,729 |
| Events in quadrant B | 3,025,854 | 569,544 |
| Events in quadrant C | 2,977,548 | 535,287 |
| Events in quadrant D | 4,393,830 | 510,551 |
| Mode M0 | |||
|---|---|---|---|
| Quadrant | BADHDUFLAG | Total packets | Discarded packets |
| A | 0 | 12400 | 0 |
| B | 0 | 12763 | 0 |
| C | 0 | 12608 | 0 |
| D | 0 | 17268 | 0 |
| Mode M9 | |||
|---|---|---|---|
| Quadrant | BADHDUFLAG | Total packets | Discarded packets |
| A | 0 | 11 | 0 |
| B | 0 | 11 | 0 |
| C | 0 | 11 | 0 |
| D | 0 | 11 | 0 |
| Quadrant | Total seconds | Saturated seconds | Saturation percentage |
|---|---|---|---|
| A | 5966 | 36 | 0.603419% |
| B | 5966 | 63 | 1.055984% |
| C | 5967 | 80 | 1.340707% |
| D | 5967 | 251 | 4.206469% |
Noise dominated data is calculated using 1-second bins in cleaned event files. If a bin has >2000 counts, and if more than 50% of those come from <1% of pixels, then it is considered to be noise-dominated and hence unusable.
| Quadrant | # 1 sec bins | Bins with >0 counts | Bins with >2000 counts | High rate bins dominated by noise | Noise dominated (total time) | Noise dominated (detector-on time) | Marked lightcurve |
|---|---|---|---|---|---|---|---|
| A | 7096 | 5966 | 1 | 1 | 0.01% | 0.02% | 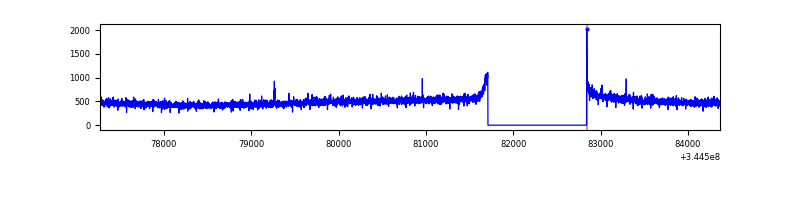 |
| B | 7096 | 5966 | 8 | 8 | 0.11% | 0.13% | 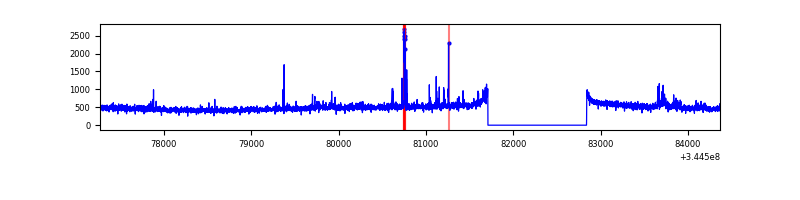 |
| C | 7097 | 5967 | 1 | 1 | 0.01% | 0.02% | 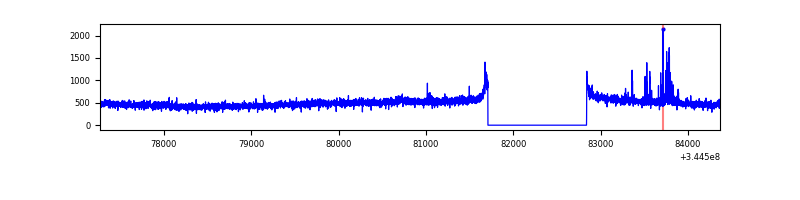 |
| D | 7097 | 5967 | 221 | 221 | 3.11% | 3.70% | 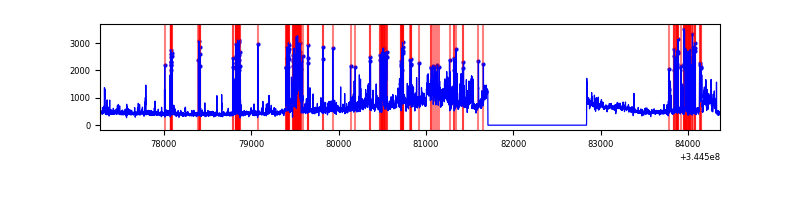 |
Top three noisy pixels from each quadrant. If the there are fewer than three noisy pixels in the level2.evt file, extra rows are filled as -1
| Pixel properties | Quadrant properties | ||||||
|---|---|---|---|---|---|---|---|
| Quadrant | DetID | PixID | Counts | Sigma | Mean | Median | Sigma |
| A | 0 | 13 | 29037 | 188.63 | 747 | 734 | 150.0 |
| A | 13 | 254 | 8820 | 53.89 | 747 | 734 | 150.0 |
| A | 3 | 137 | 7102 | 42.44 | 747 | 734 | 150.0 |
| B | 10 | 245 | 87196 | 607.75 | 744 | 726 | 142.3 |
| B | 12 | 111 | 17344 | 116.8 | 744 | 726 | 142.3 |
| B | 11 | 111 | 15558 | 104.25 | 744 | 726 | 142.3 |
| C | 14 | 238 | 118001 | 701.94 | 716 | 722 | 167.1 |
| C | 15 | 208 | 43544 | 256.3 | 716 | 722 | 167.1 |
| C | 3 | 233 | 25224 | 146.65 | 716 | 722 | 167.1 |
| D | 1 | 52 | 749924 | 4463.9 | 710 | 692 | 167.8 |
| D | 8 | 195 | 671227 | 3995.02 | 710 | 692 | 167.8 |
| D | 12 | 79 | 84957 | 502.05 | 710 | 692 | 167.8 |
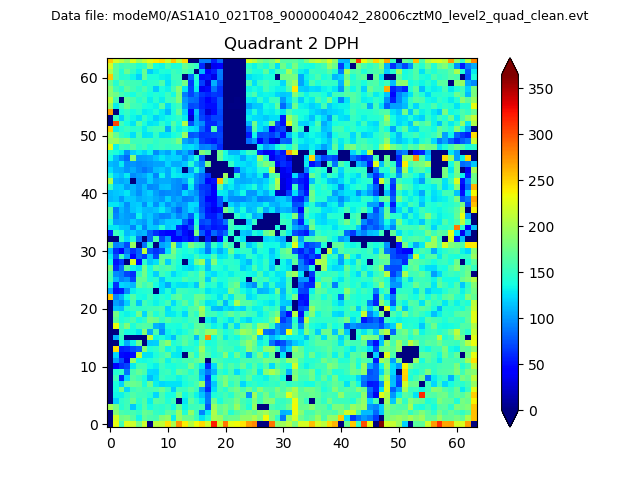
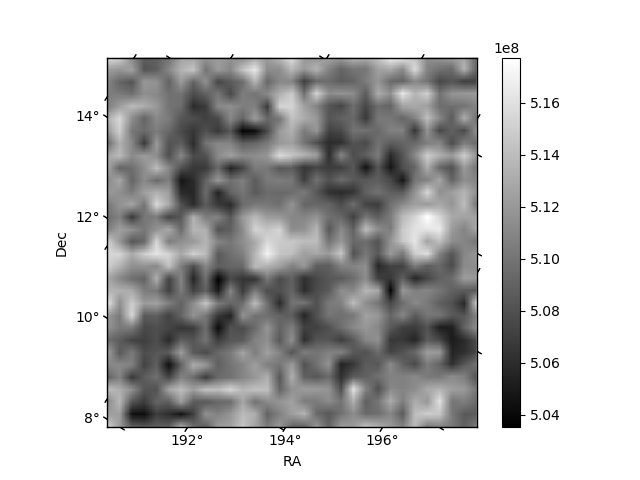
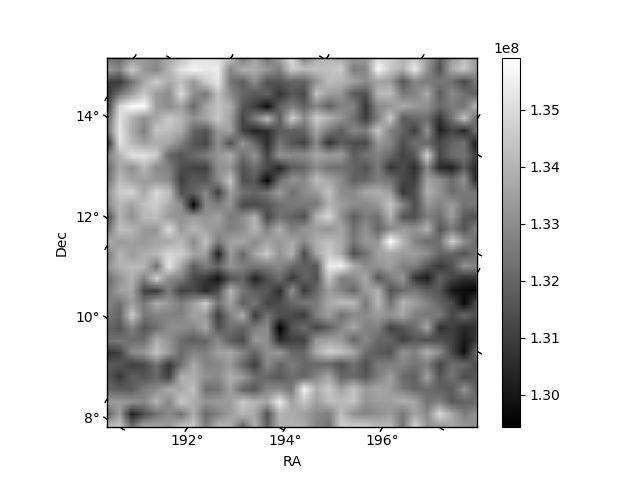
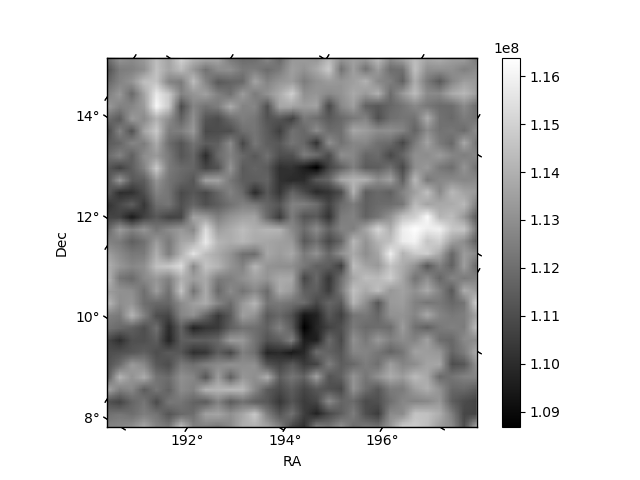
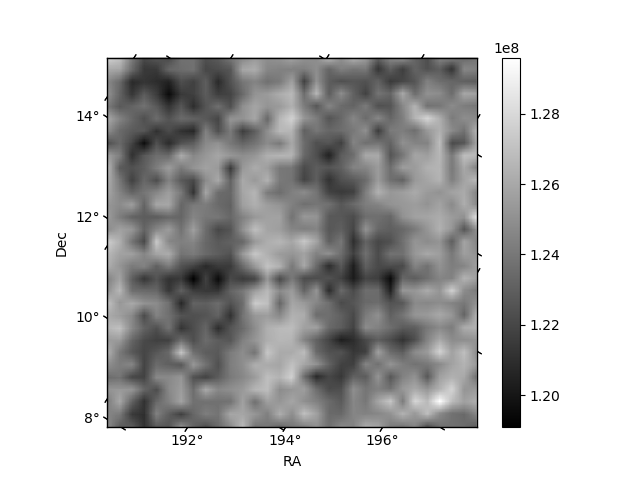
Histogram calculated using DETX and DETY for each event in the final _common_clean file
| Quadrant A | 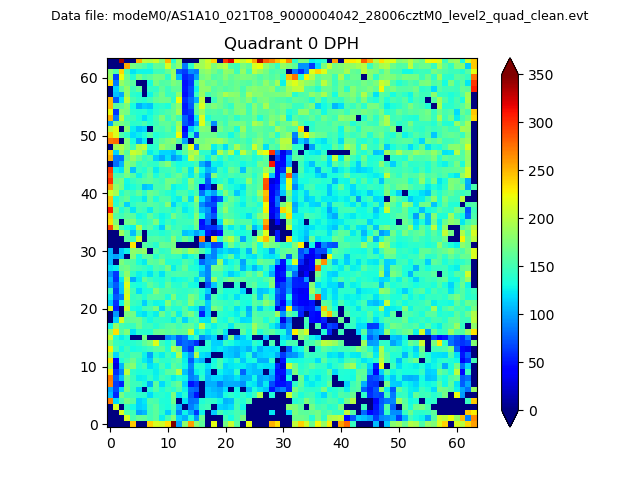 |
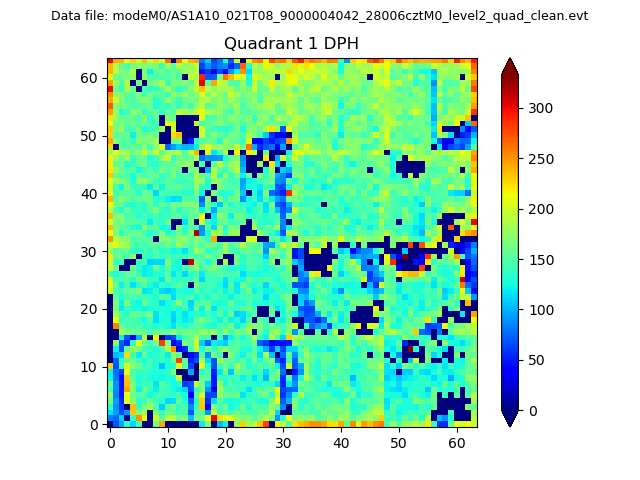 |
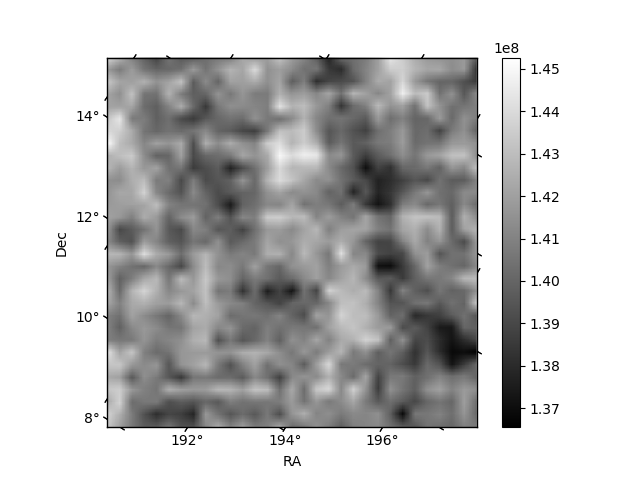
Quadrant B |
|---|---|---|---|
| Quadrant D | 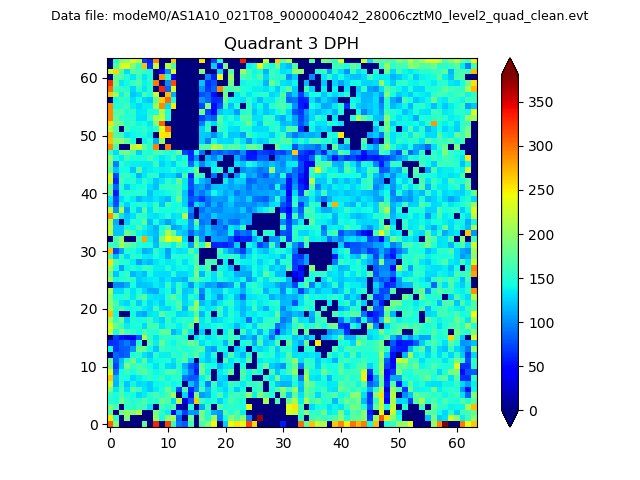 |
 |
Quadrant C |
| Plot type | Count rate plots | Images |
|---|---|---|
| Comparison with Poisson distribution Blue bars denote a histogram of data divided into 1 sec bins. Red curve is a Poisson curve with rate = median count rate of data. |
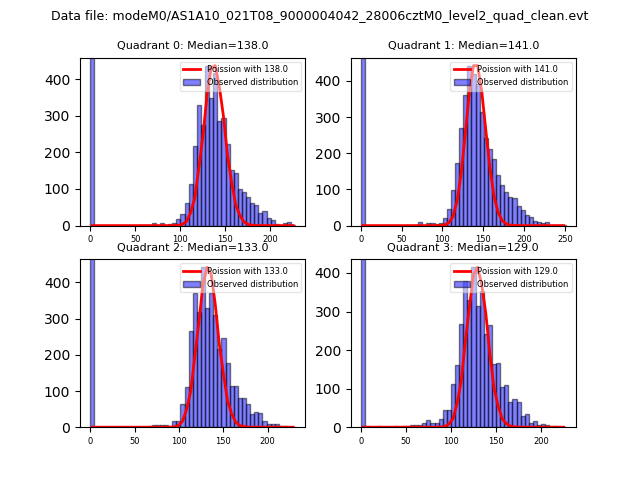 |
 |
| Quadrant-wise count rates Data is divided into 100 sec bins |
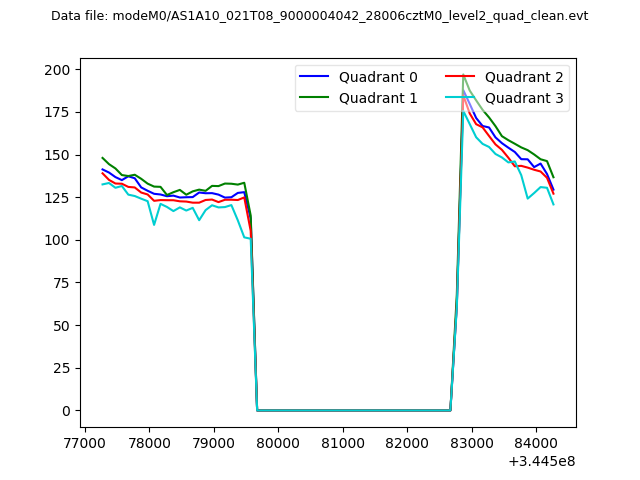 |
|
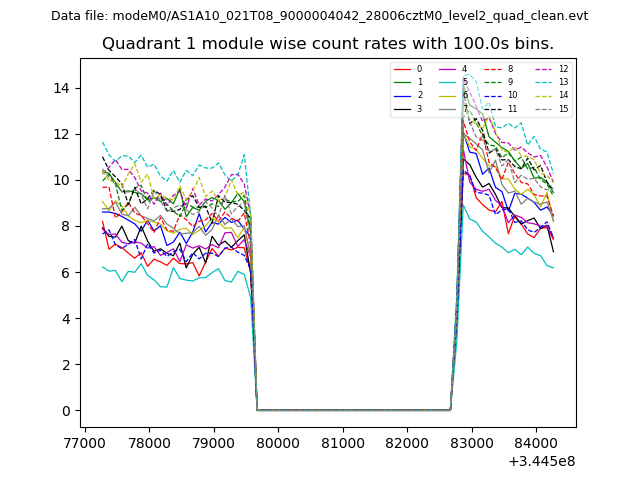
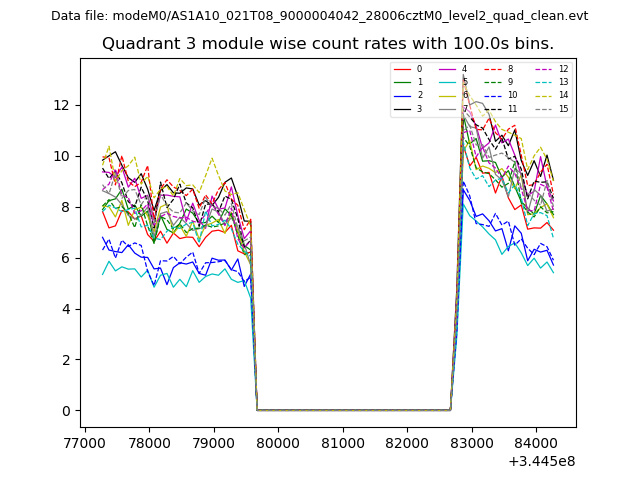
| Module-wise count rates for Quadrant A Data is divided into 100 sec bins |
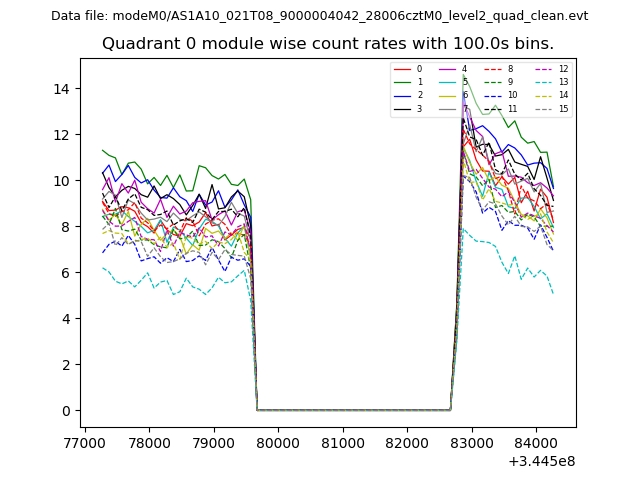 |
 |
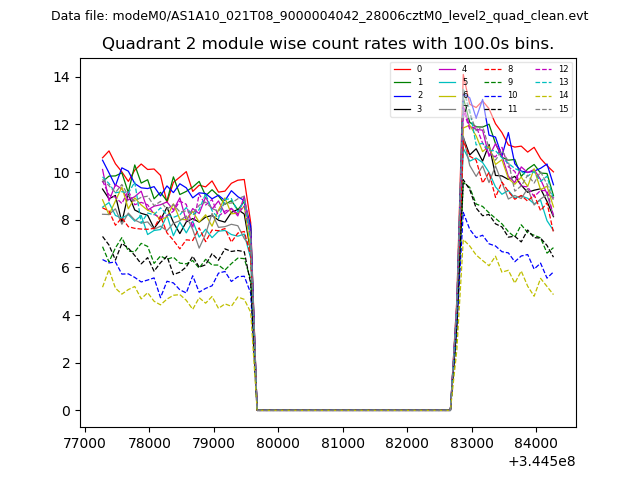
| Module-wise count rates for Quadrant B Data is divided into 100 sec bins |
 |
 |
| Module-wise count rates for Quadrant C Data is divided into 100 sec bins |
 |
 |
| Module-wise count rates for Quadrant D Data is divided into 100 sec bins |
 |
 |
| Parameter | Plot |
|---|---|
| CZT HV Monitor | 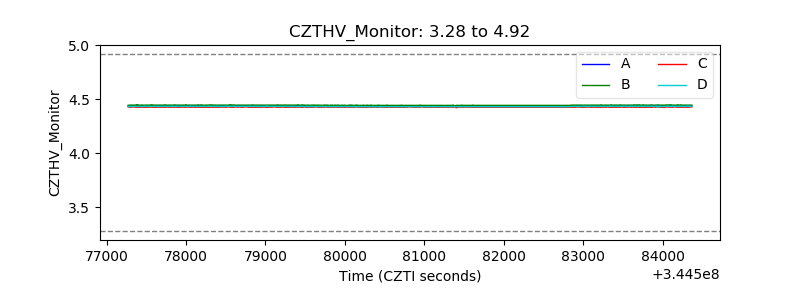 |
| D_VDD | 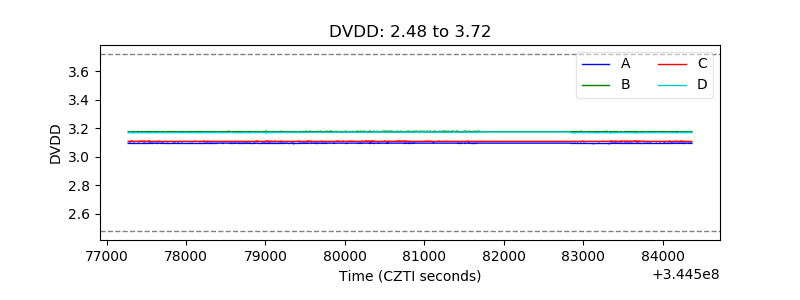 |
| Temperature 1 | 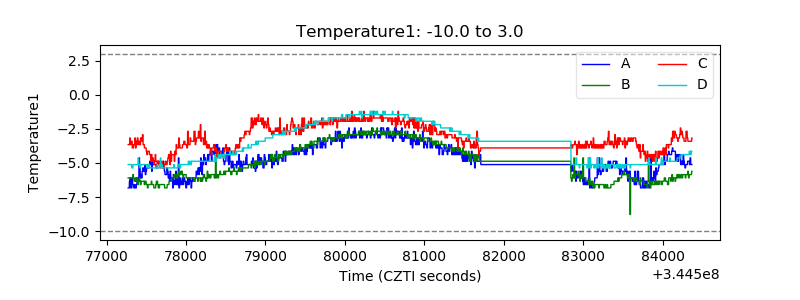 |
| Veto HV Monitor | 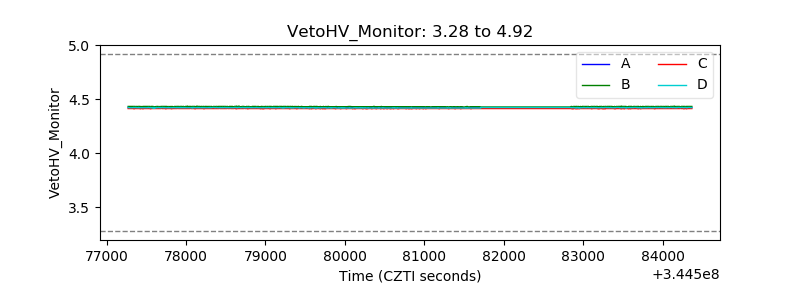 |
| Veto LLD | 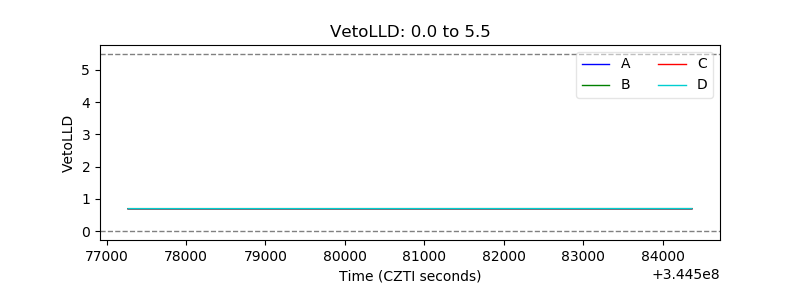 |
| Alpha Counter | 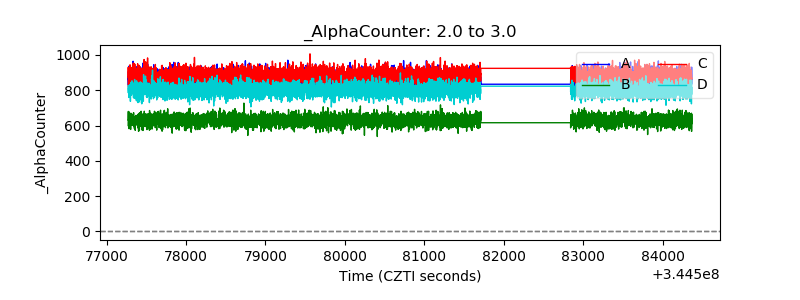 |
| _CPM_Rate | 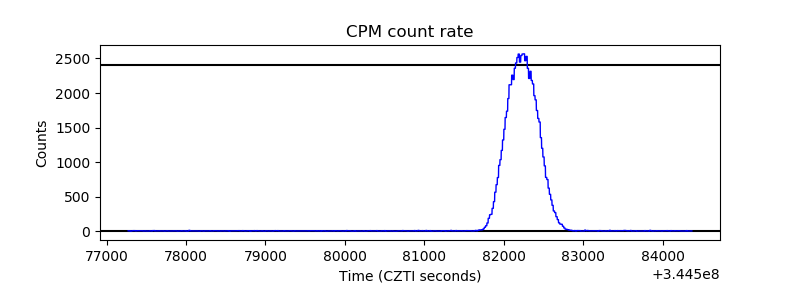 |
| CZT Counter | 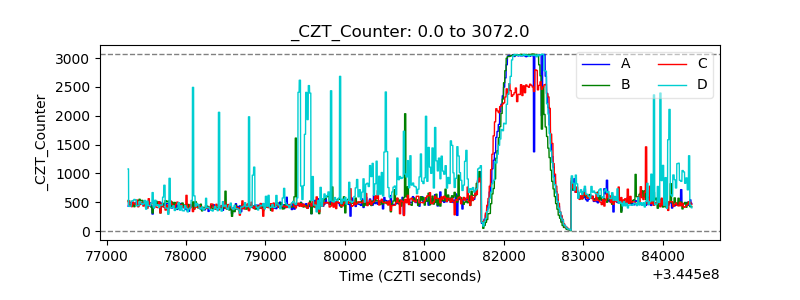 |
| +2.5 Volts monitor |  |
| +5 Volts monitor | 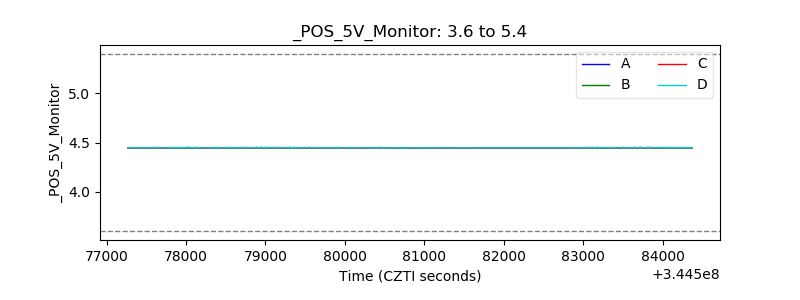 |
| _ROLL_ROT | 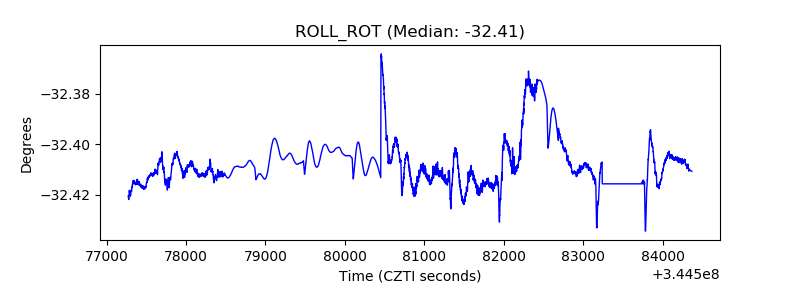 |
| _Roll_DEC |  |
| _Roll_RA | 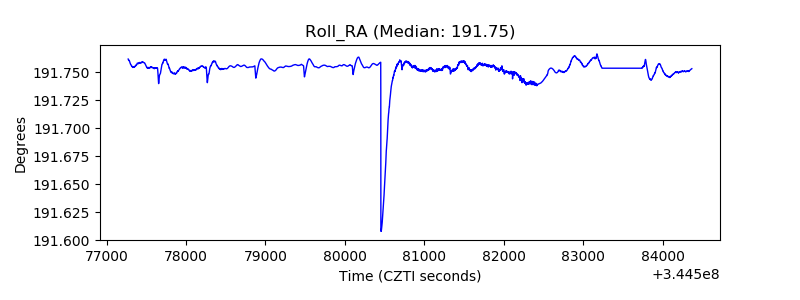 |
| Veto Counter |  |