| Param | Original file | Final file |
|---|---|---|
| Filename | modeM0/AS1A10_021T08_9000004042_28008cztM0_level2.evt | modeM0/AS1A10_021T08_9000004042_28008cztM0_level2_quad_clean.evt |
| Size (bytes) | 473,284,800 | 90,990,720 |
| Size | 451.4 MB | 86.8 MB |
| Events in quadrant A | 3,192,405 | 590,474 |
| Events in quadrant B | 3,303,015 | 612,061 |
| Events in quadrant C | 3,175,780 | 583,831 |
| Events in quadrant D | 4,262,350 | 557,356 |
| Mode M0 | |||
|---|---|---|---|
| Quadrant | BADHDUFLAG | Total packets | Discarded packets |
| A | 0 | 12849 | 0 |
| B | 0 | 13146 | 0 |
| C | 0 | 12687 | 0 |
| D | 0 | 16452 | 0 |
| Mode M9 | |||
|---|---|---|---|
| Quadrant | BADHDUFLAG | Total packets | Discarded packets |
| A | 0 | 13 | 0 |
| B | 0 | 13 | 0 |
| C | 0 | 13 | 0 |
| D | 0 | 13 | 0 |
| Quadrant | Total seconds | Saturated seconds | Saturation percentage |
|---|---|---|---|
| A | 5887 | 33 | 0.560557% |
| B | 5887 | 38 | 0.645490% |
| C | 5888 | 46 | 0.781250% |
| D | 5888 | 192 | 3.260870% |
Noise dominated data is calculated using 1-second bins in cleaned event files. If a bin has >2000 counts, and if more than 50% of those come from <1% of pixels, then it is considered to be noise-dominated and hence unusable.
| Quadrant | # 1 sec bins | Bins with >0 counts | Bins with >2000 counts | High rate bins dominated by noise | Noise dominated (total time) | Noise dominated (detector-on time) | Marked lightcurve |
|---|---|---|---|---|---|---|---|
| A | 7222 | 5887 | 0 | 0 | 0.00% | 0.00% | 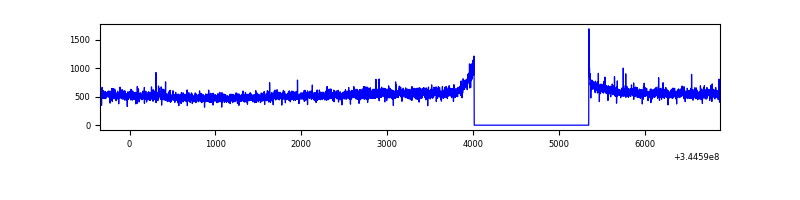 |
| B | 7222 | 5887 | 5 | 5 | 0.07% | 0.08% | 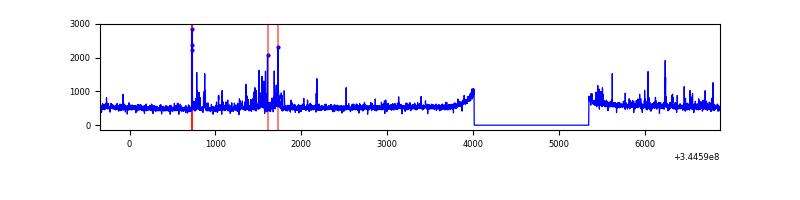 |
| C | 7223 | 5888 | 0 | 0 | 0.00% | 0.00% | 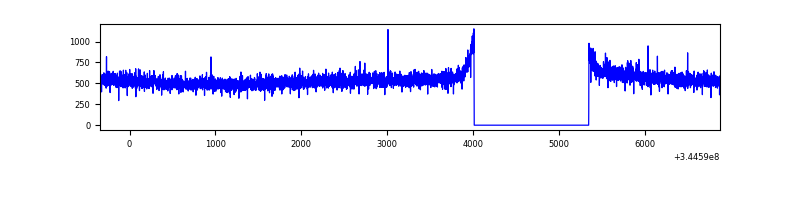 |
| D | 7223 | 5889 | 187 | 187 | 2.59% | 3.18% | 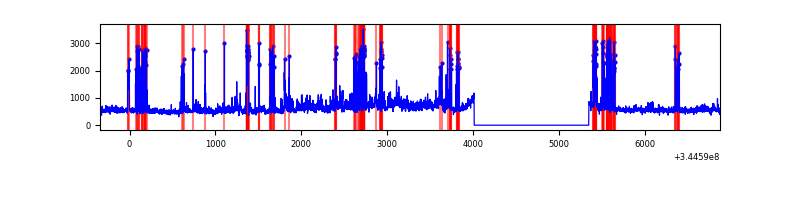 |
Top three noisy pixels from each quadrant. If the there are fewer than three noisy pixels in the level2.evt file, extra rows are filled as -1
| Pixel properties | Quadrant properties | ||||||
|---|---|---|---|---|---|---|---|
| Quadrant | DetID | PixID | Counts | Sigma | Mean | Median | Sigma |
| A | 0 | 13 | 95214 | 593.68 | 802 | 789 | 159.1 |
| A | 13 | 254 | 8718 | 49.85 | 802 | 789 | 159.1 |
| A | 3 | 137 | 7120 | 39.8 | 802 | 789 | 159.1 |
| B | 10 | 245 | 170384 | 1142.09 | 795 | 777 | 148.5 |
| B | 12 | 111 | 17669 | 113.75 | 795 | 777 | 148.5 |
| B | 11 | 111 | 15634 | 100.04 | 795 | 777 | 148.5 |
| C | 14 | 238 | 126013 | 694.55 | 776 | 784 | 180.3 |
| C | 3 | 233 | 24058 | 129.08 | 776 | 784 | 180.3 |
| C | 13 | 61 | 5276 | 24.91 | 776 | 784 | 180.3 |
| D | 8 | 195 | 969193 | 5346.37 | 769 | 751 | 181.1 |
| D | 1 | 52 | 229954 | 1265.34 | 769 | 751 | 181.1 |
| D | 2 | 250 | 75116 | 410.54 | 769 | 751 | 181.1 |
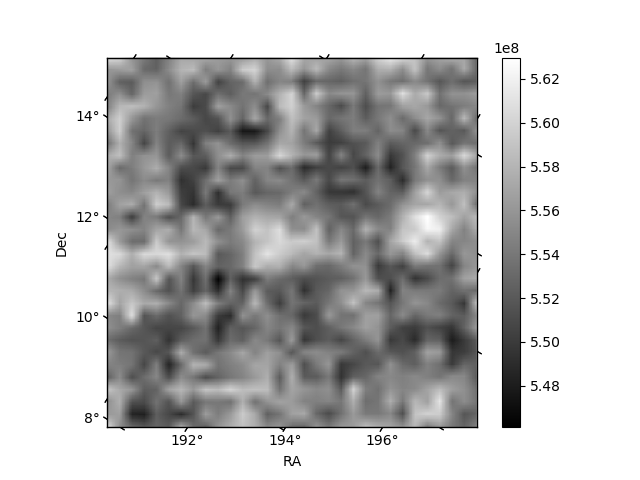
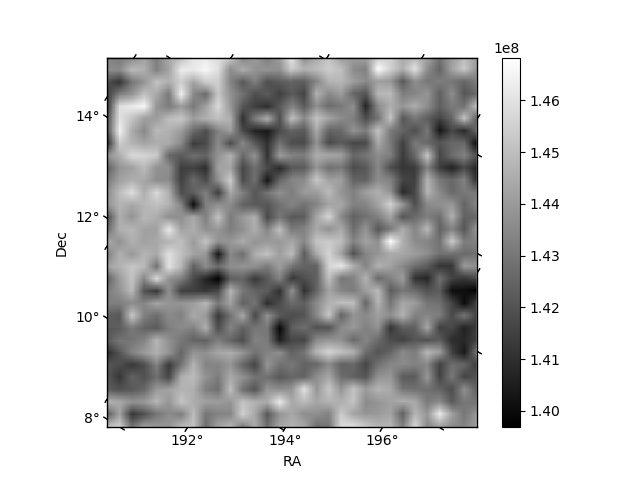
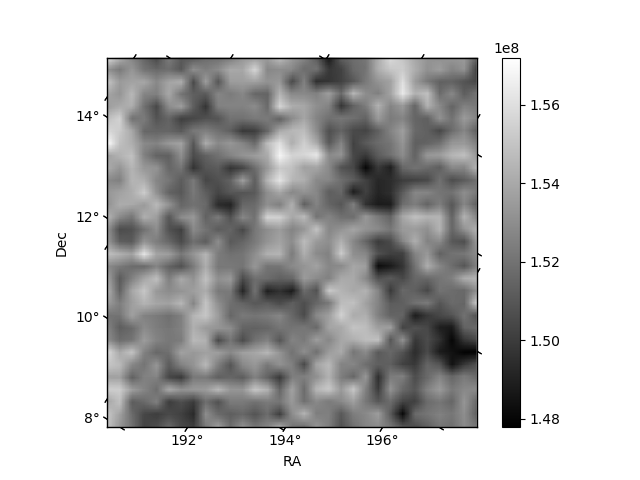
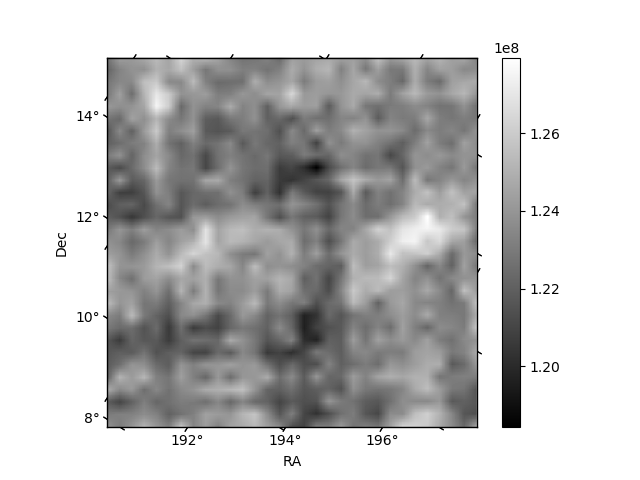
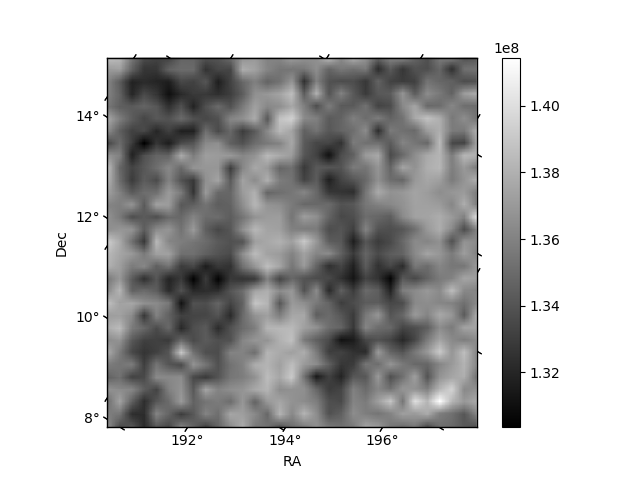
Histogram calculated using DETX and DETY for each event in the final _common_clean file
| Quadrant A | 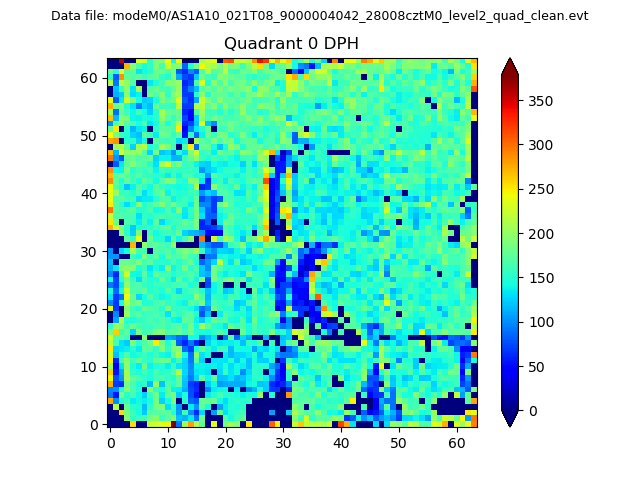 |
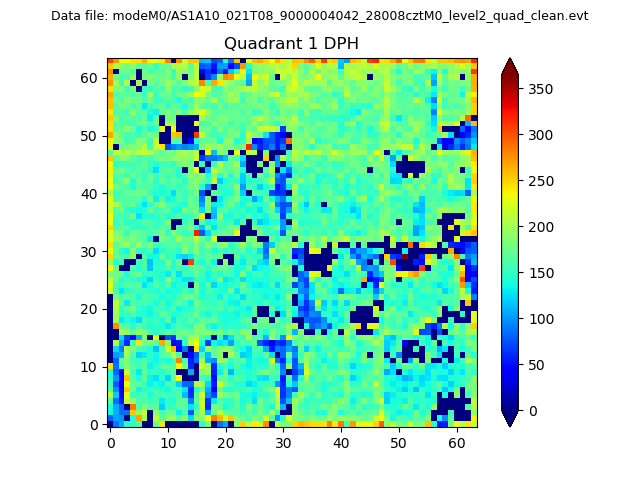 |
Quadrant B |
|---|---|---|---|
| Quadrant D | 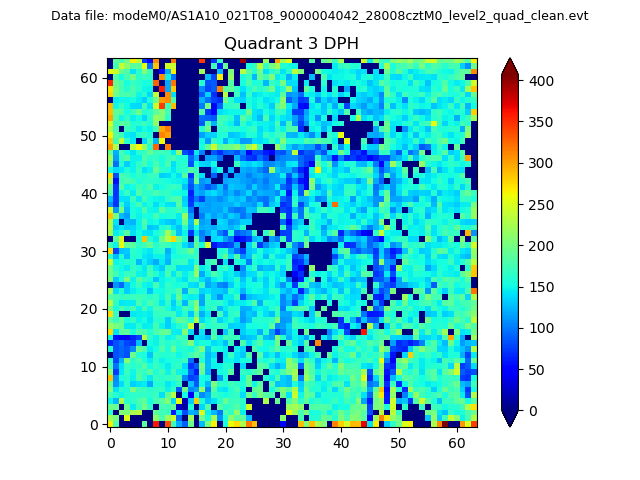 |
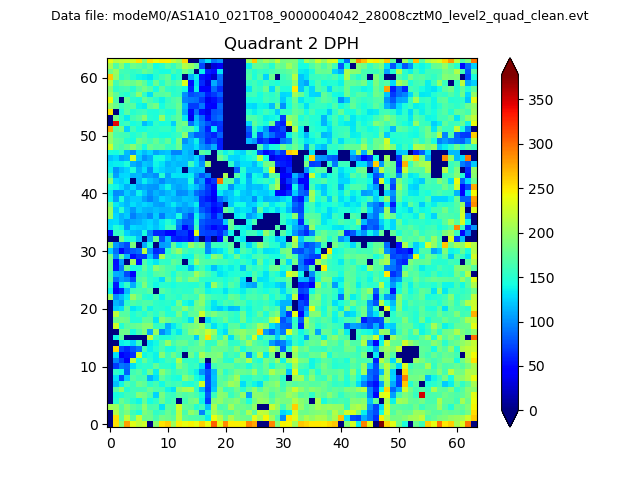 |
Quadrant C |
| Plot type | Count rate plots | Images |
|---|---|---|
| Comparison with Poisson distribution Blue bars denote a histogram of data divided into 1 sec bins. Red curve is a Poisson curve with rate = median count rate of data. |
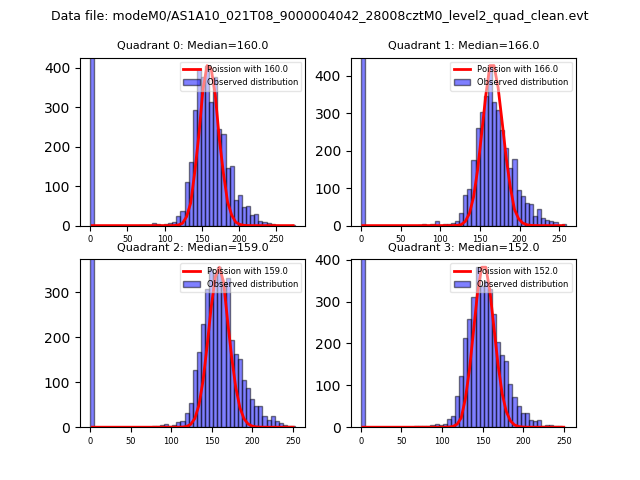 |
 |
| Quadrant-wise count rates Data is divided into 100 sec bins |
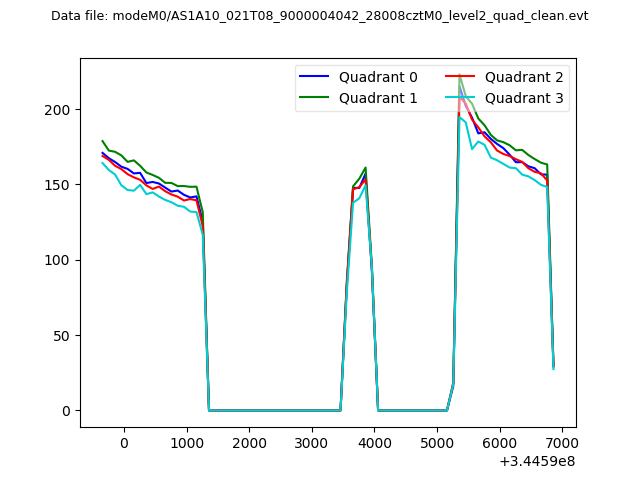 |
|
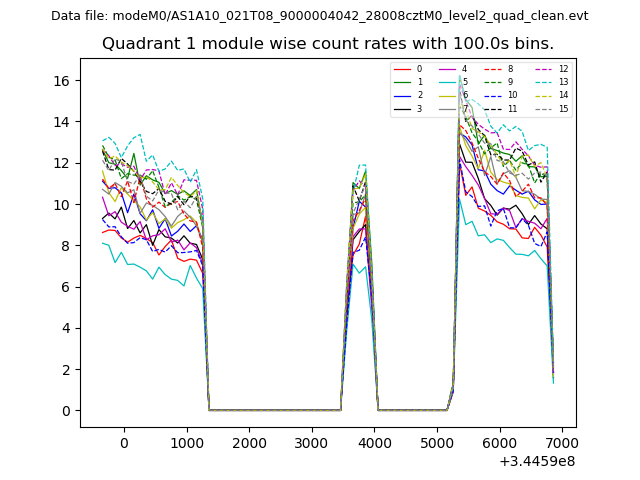
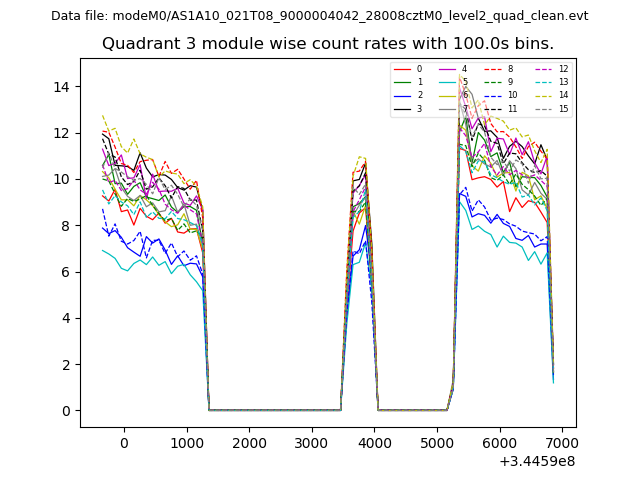
| Module-wise count rates for Quadrant A Data is divided into 100 sec bins |
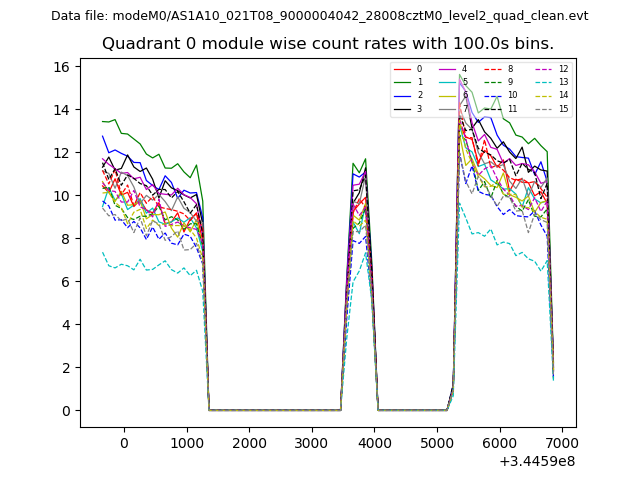 |
 |
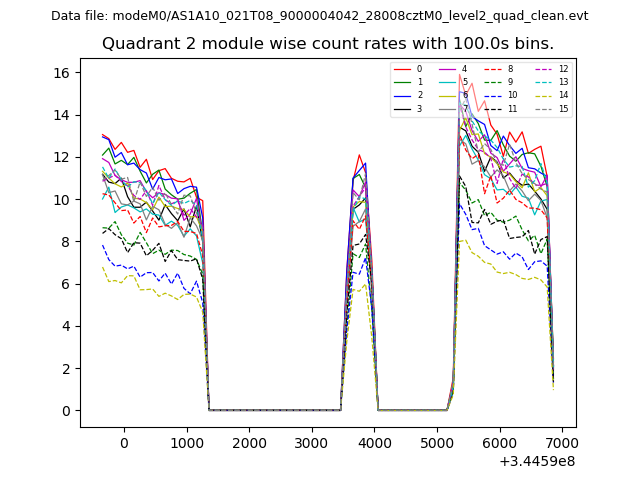
| Module-wise count rates for Quadrant B Data is divided into 100 sec bins |
 |
 |
| Module-wise count rates for Quadrant C Data is divided into 100 sec bins |
 |
 |
| Module-wise count rates for Quadrant D Data is divided into 100 sec bins |
 |
 |
| Parameter | Plot |
|---|---|
| CZT HV Monitor | 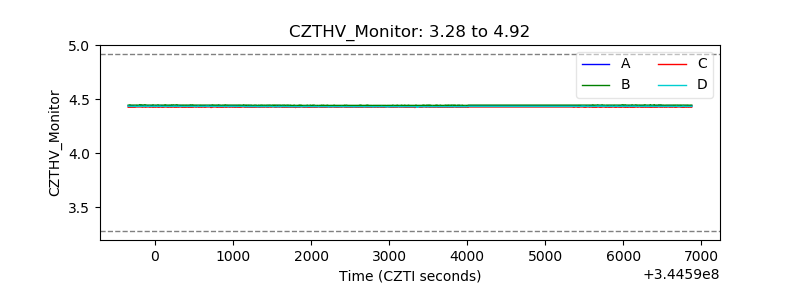 |
| D_VDD | 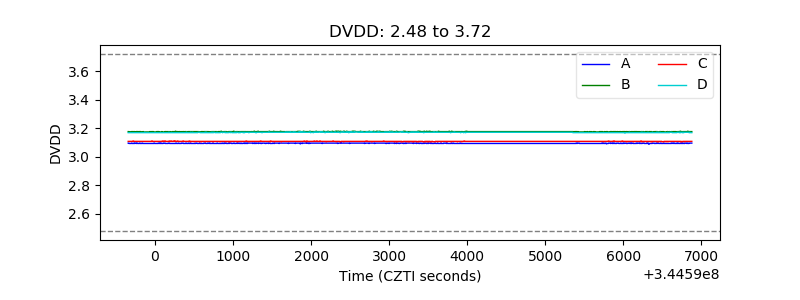 |
| Temperature 1 | 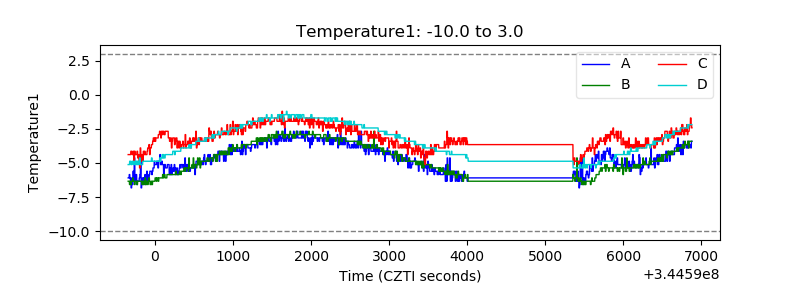 |
| Veto HV Monitor | 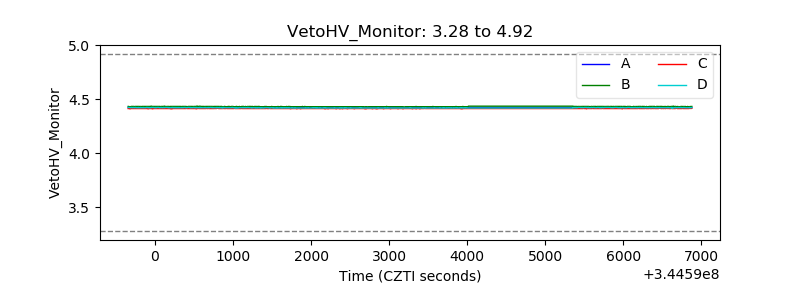 |
| Veto LLD | 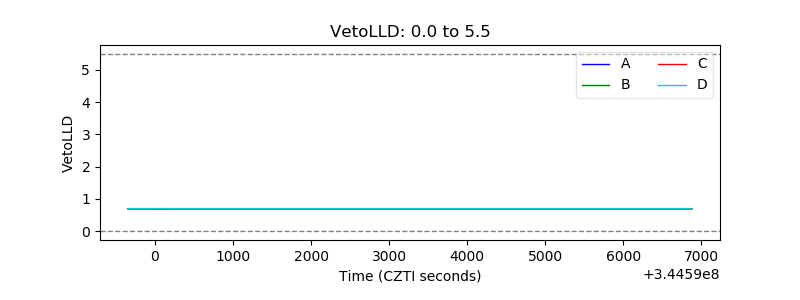 |
| Alpha Counter | 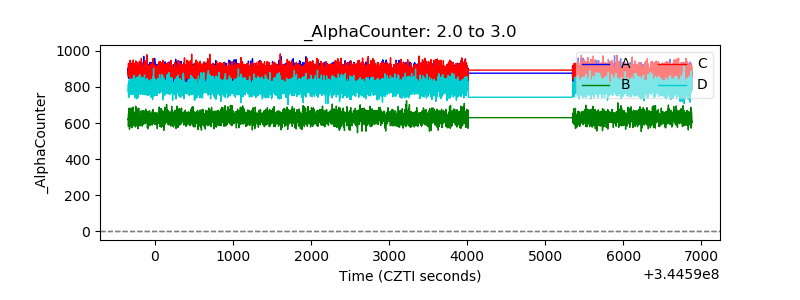 |
| _CPM_Rate | 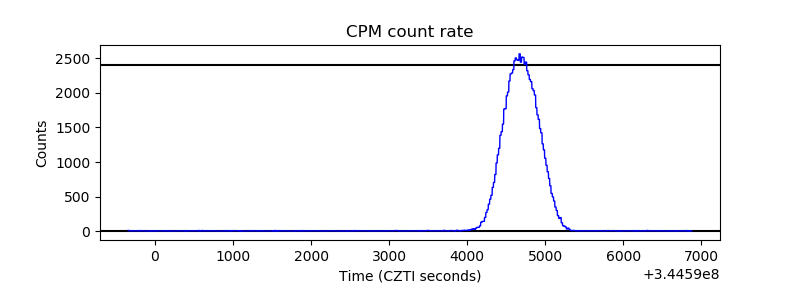 |
| CZT Counter | 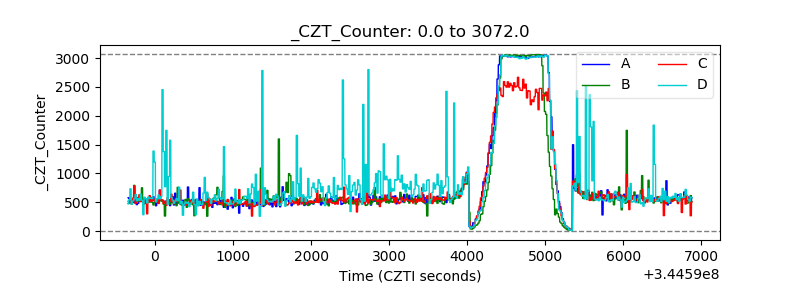 |
| +2.5 Volts monitor | 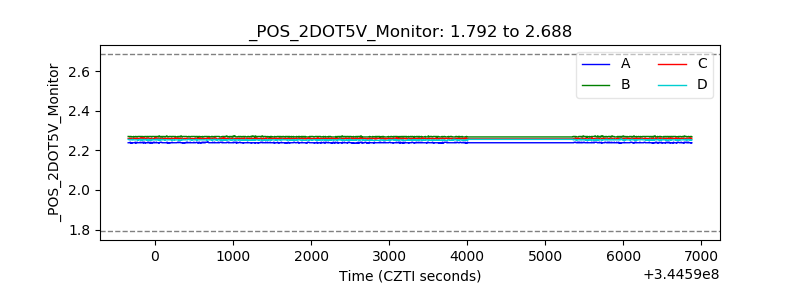 |
| +5 Volts monitor | 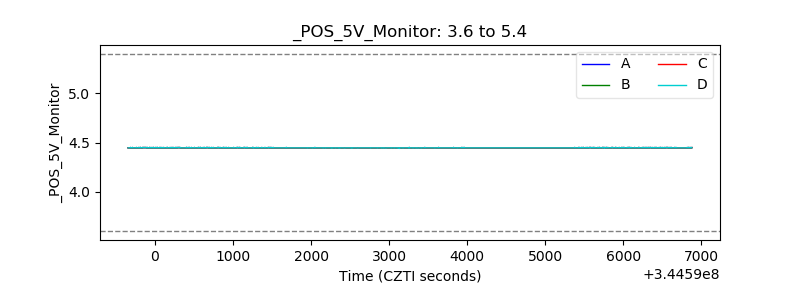 |
| _ROLL_ROT | 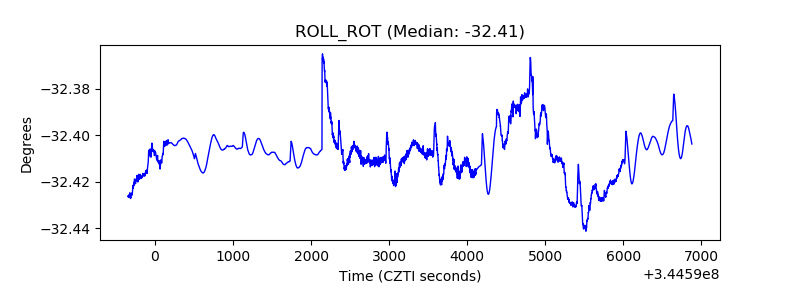 |
| _Roll_DEC | 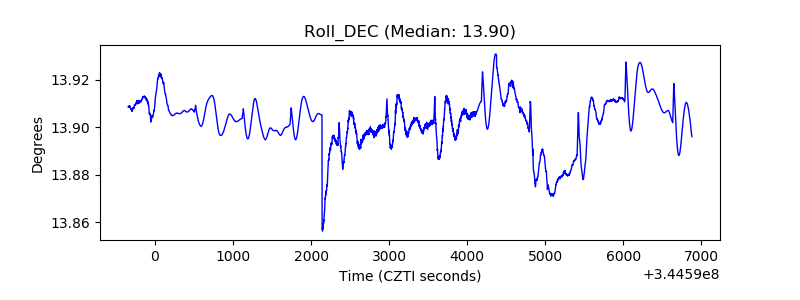 |
| _Roll_RA | 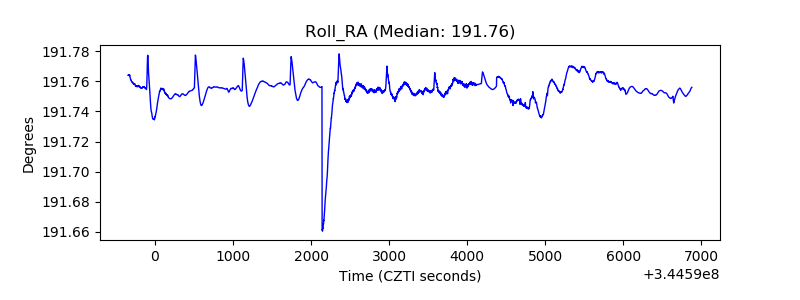 |
| Veto Counter | 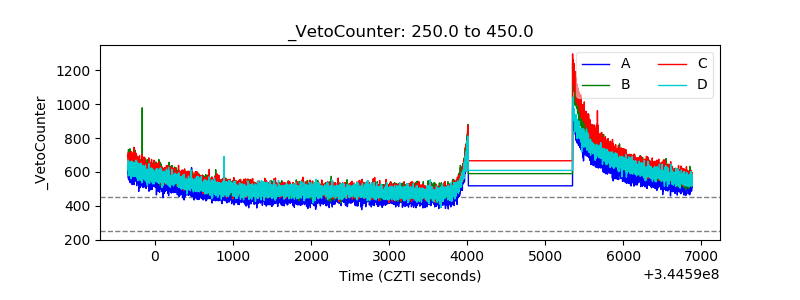 |