| Param | Original file | Final file |
|---|---|---|
| Filename | modeM0/AS1A10_021T08_9000004042_28009cztM0_level2.evt | modeM0/AS1A10_021T08_9000004042_28009cztM0_level2_quad_clean.evt |
| Size (bytes) | 540,578,880 | 105,416,640 |
| Size | 515.5 MB | 100.5 MB |
| Events in quadrant A | 3,714,947 | 693,322 |
| Events in quadrant B | 3,597,679 | 716,209 |
| Events in quadrant C | 3,606,191 | 686,188 |
| Events in quadrant D | 5,020,181 | 651,410 |
| Mode M0 | |||
|---|---|---|---|
| Quadrant | BADHDUFLAG | Total packets | Discarded packets |
| A | 0 | 14924 | 0 |
| B | 0 | 14306 | 0 |
| C | 0 | 14392 | 0 |
| D | 0 | 19147 | 0 |
| Mode M9 | |||
|---|---|---|---|
| Quadrant | BADHDUFLAG | Total packets | Discarded packets |
| A | 0 | 23 | 0 |
| B | 0 | 24 | 0 |
| C | 0 | 24 | 0 |
| D | 0 | 24 | 0 |
| Quadrant | Total seconds | Saturated seconds | Saturation percentage |
|---|---|---|---|
| A | 6390 | 72 | 1.126761% |
| B | 6390 | 96 | 1.502347% |
| C | 6390 | 122 | 1.909233% |
| D | 6390 | 319 | 4.992175% |
Noise dominated data is calculated using 1-second bins in cleaned event files. If a bin has >2000 counts, and if more than 50% of those come from <1% of pixels, then it is considered to be noise-dominated and hence unusable.
| Quadrant | # 1 sec bins | Bins with >0 counts | Bins with >2000 counts | High rate bins dominated by noise | Noise dominated (total time) | Noise dominated (detector-on time) | Marked lightcurve |
|---|---|---|---|---|---|---|---|
| A | 7710 | 6390 | 0 | 0 | 0.00% | 0.00% | 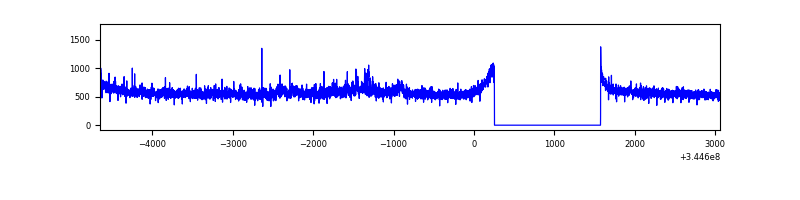 |
| B | 7710 | 6391 | 0 | 0 | 0.00% | 0.00% | 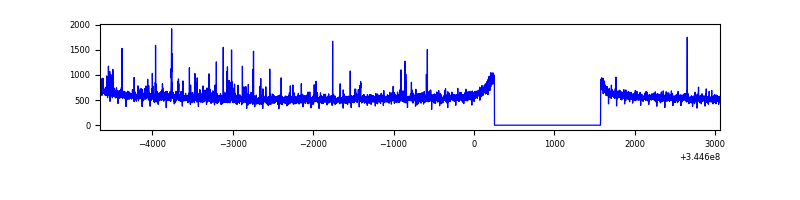 |
| C | 7710 | 6390 | 2 | 2 | 0.03% | 0.03% | 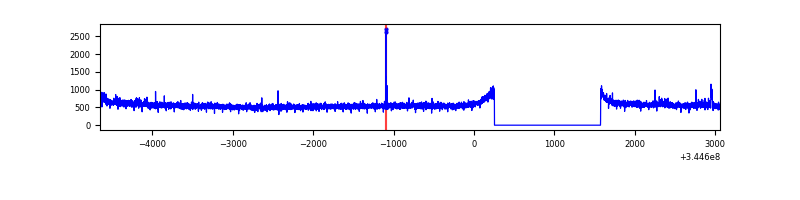 |
| D | 7710 | 6390 | 278 | 278 | 3.61% | 4.35% | 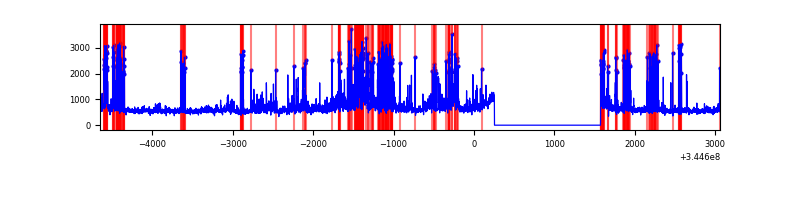 |
Top three noisy pixels from each quadrant. If the there are fewer than three noisy pixels in the level2.evt file, extra rows are filled as -1
| Pixel properties | Quadrant properties | ||||||
|---|---|---|---|---|---|---|---|
| Quadrant | DetID | PixID | Counts | Sigma | Mean | Median | Sigma |
| A | 0 | 13 | 199340 | 1115.39 | 902 | 887 | 177.9 |
| A | 3 | 1 | 31180 | 170.26 | 902 | 887 | 177.9 |
| A | 13 | 254 | 9846 | 50.35 | 902 | 887 | 177.9 |
| B | 10 | 245 | 91927 | 544.33 | 892 | 872 | 167.3 |
| B | 12 | 111 | 19672 | 112.39 | 892 | 872 | 167.3 |
| B | 11 | 111 | 17700 | 100.6 | 892 | 872 | 167.3 |
| C | 14 | 238 | 144333 | 710.54 | 874 | 884 | 201.9 |
| C | 3 | 233 | 45328 | 220.14 | 874 | 884 | 201.9 |
| C | 15 | 208 | 11442 | 52.3 | 874 | 884 | 201.9 |
| D | 8 | 195 | 971367 | 4797.71 | 868 | 851 | 202.3 |
| D | 1 | 52 | 418321 | 2063.75 | 868 | 851 | 202.3 |
| D | 2 | 250 | 118347 | 580.84 | 868 | 851 | 202.3 |
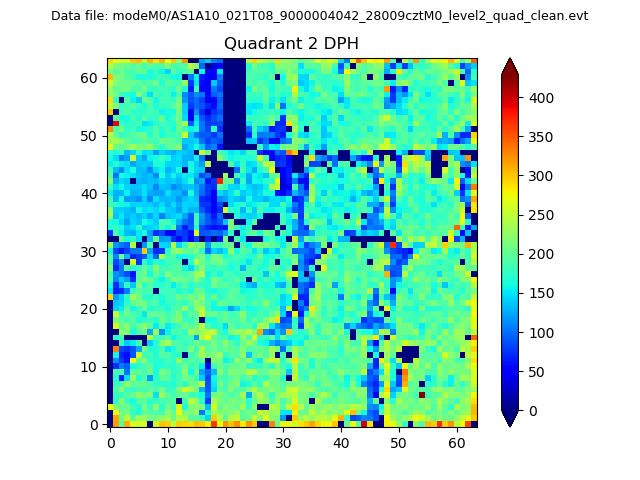
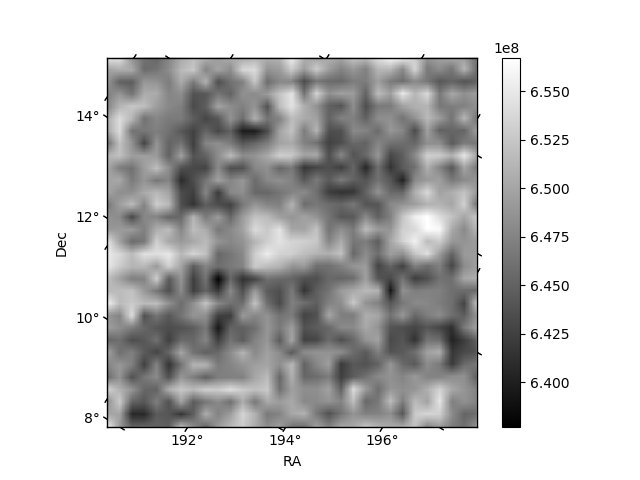
Histogram calculated using DETX and DETY for each event in the final _common_clean file
| Quadrant A | 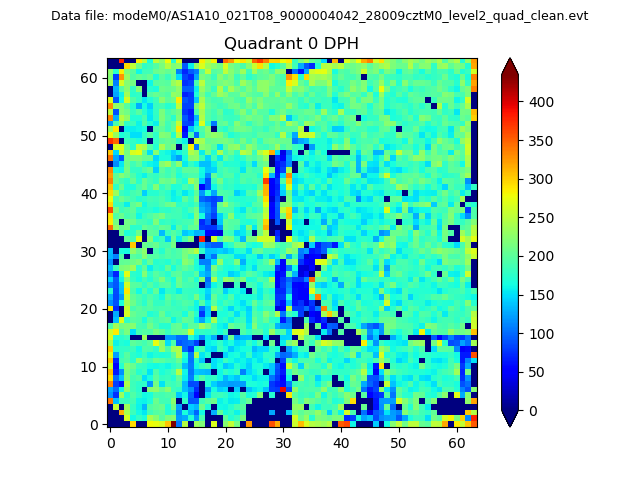 |
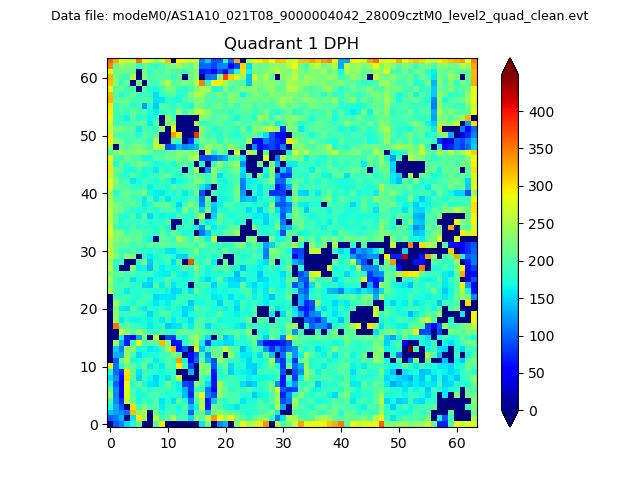 |
Quadrant B |
|---|---|---|---|
| Quadrant D | 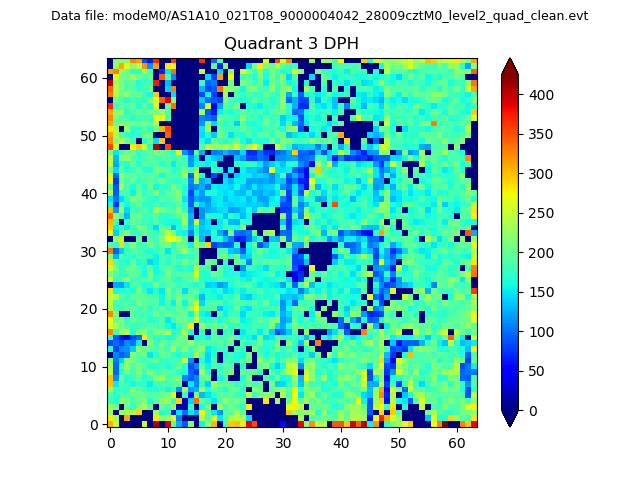 |
 |
Quadrant C |
| Plot type | Count rate plots | Images |
|---|---|---|
| Comparison with Poisson distribution Blue bars denote a histogram of data divided into 1 sec bins. Red curve is a Poisson curve with rate = median count rate of data. |
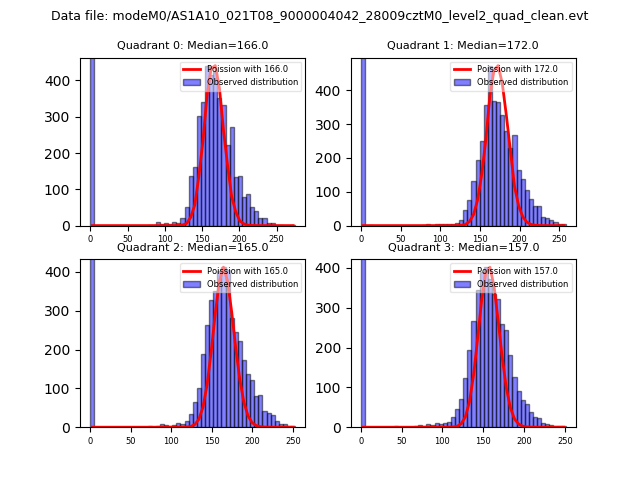 |
 |
| Quadrant-wise count rates Data is divided into 100 sec bins |
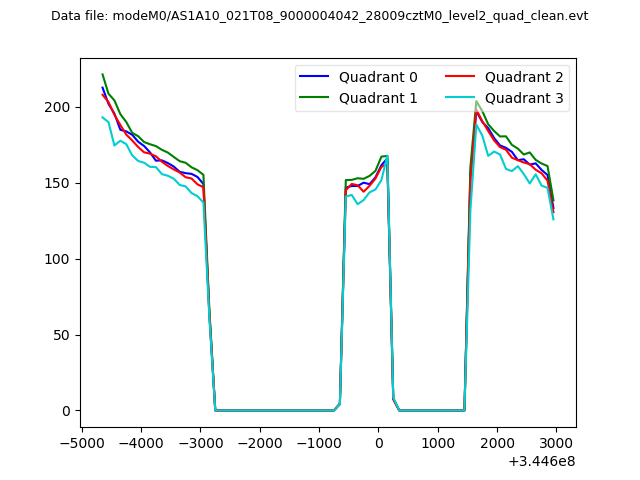 |
|
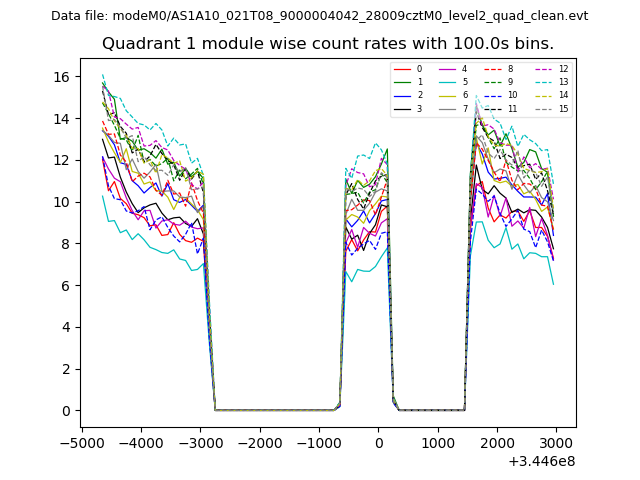
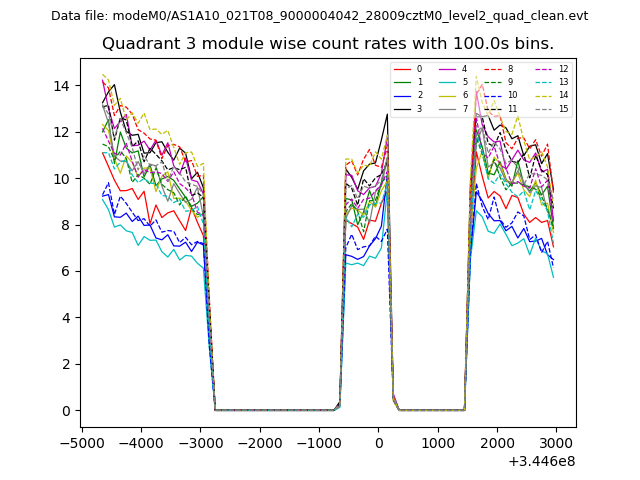
| Module-wise count rates for Quadrant A Data is divided into 100 sec bins |
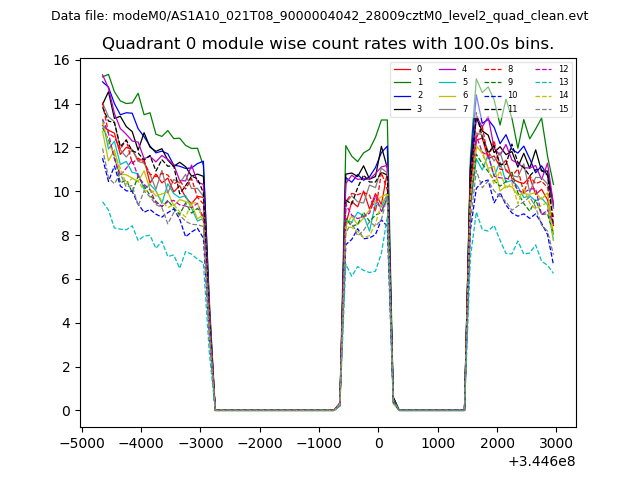 |
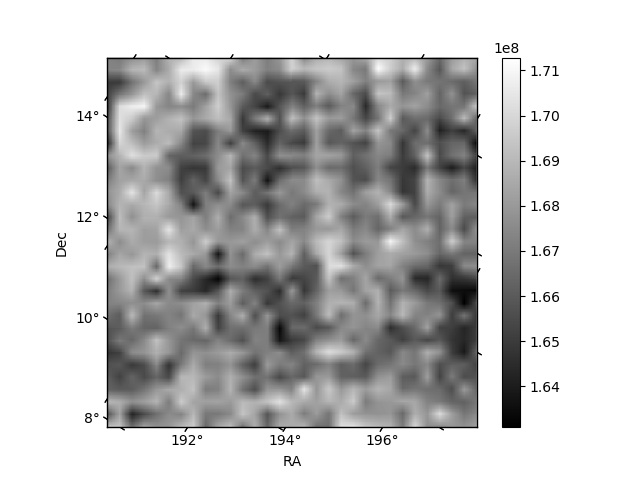 |
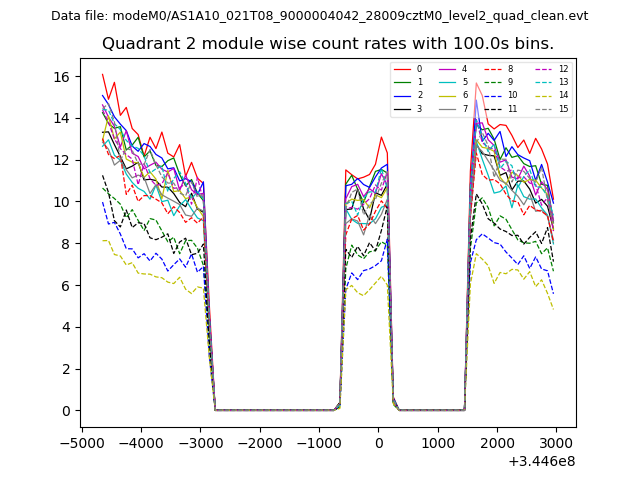
| Module-wise count rates for Quadrant B Data is divided into 100 sec bins |
 |
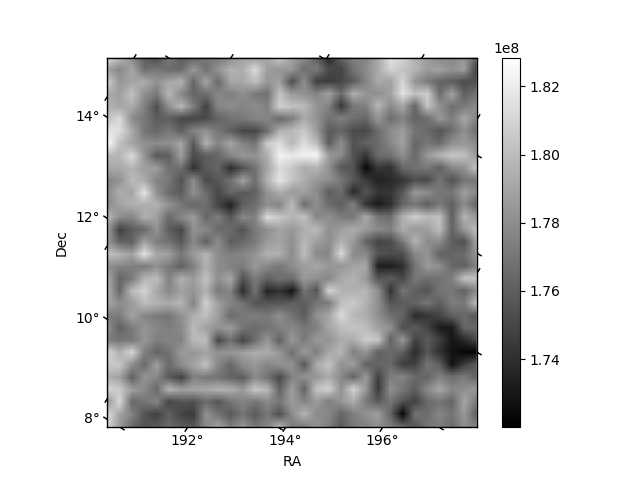 |
| Module-wise count rates for Quadrant C Data is divided into 100 sec bins |
 |
 |
| Module-wise count rates for Quadrant D Data is divided into 100 sec bins |
 |
 |
| Parameter | Plot |
|---|---|
| CZT HV Monitor | 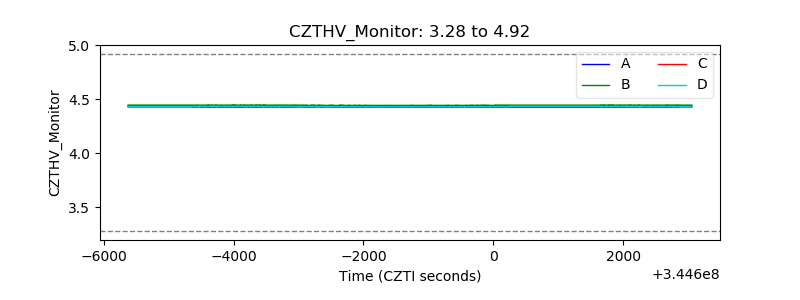 |
| D_VDD | 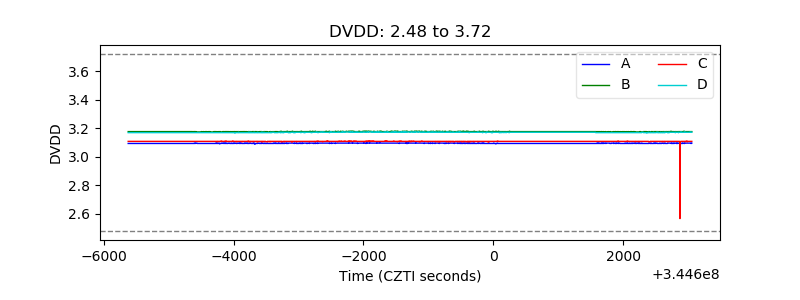 |
| Temperature 1 |  |
| Veto HV Monitor | 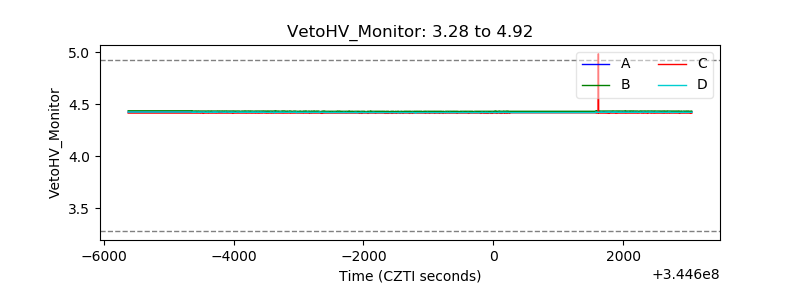 |
| Veto LLD | 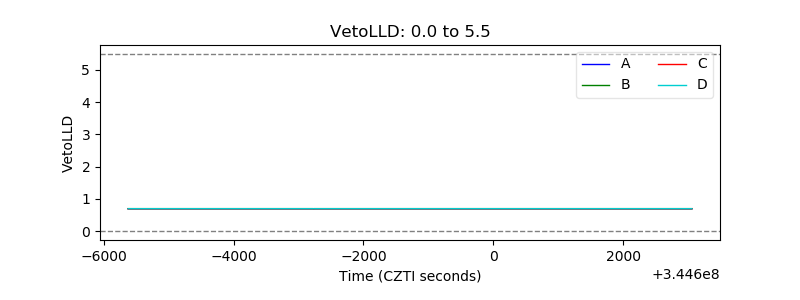 |
| Alpha Counter | 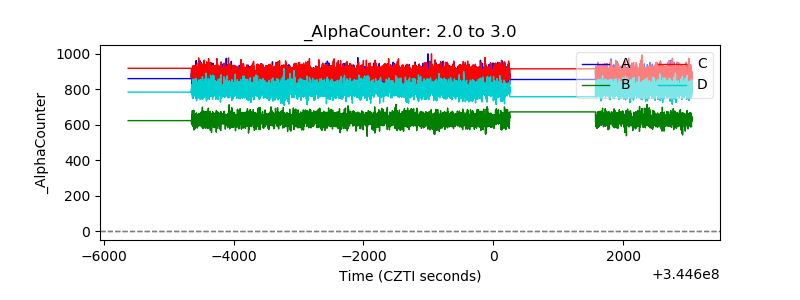 |
| _CPM_Rate | 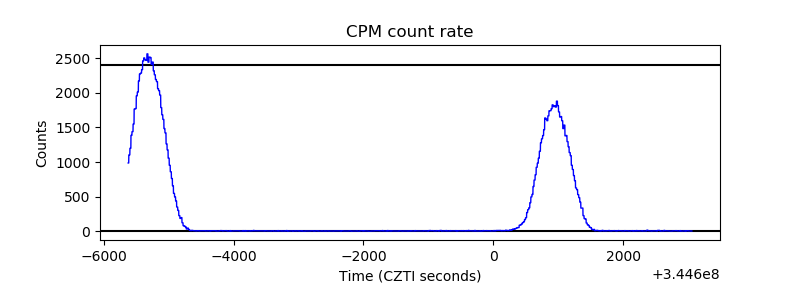 |
| CZT Counter | 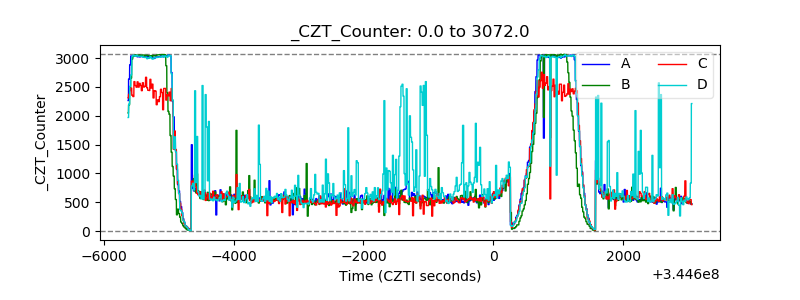 |
| +2.5 Volts monitor |  |
| +5 Volts monitor |  |
| _ROLL_ROT | 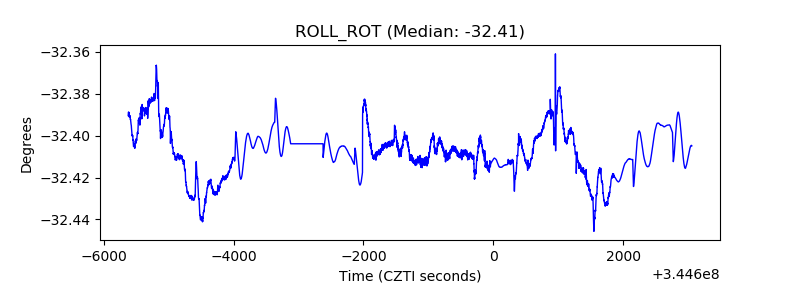 |
| _Roll_DEC | 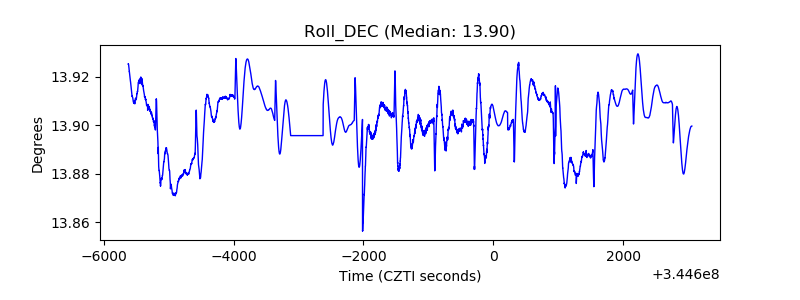 |
| _Roll_RA | 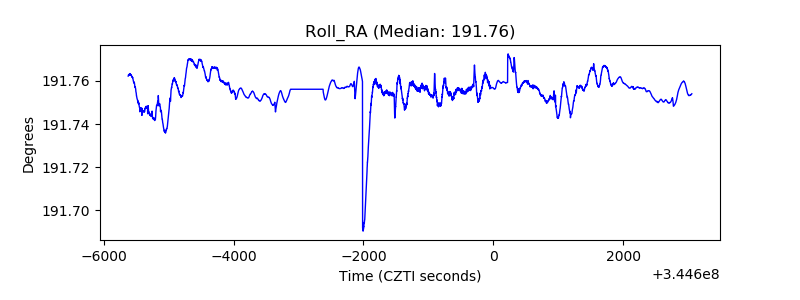 |
| Veto Counter | 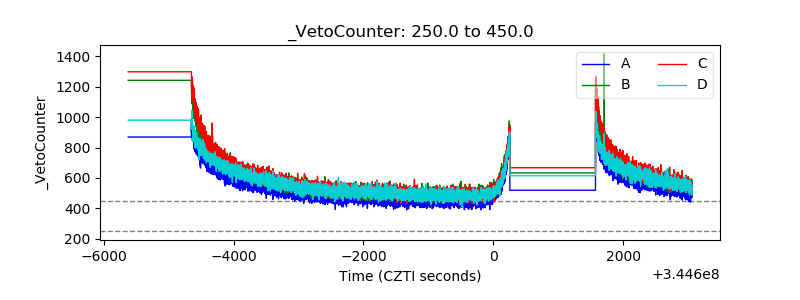 |