| Param | Original file | Final file |
|---|---|---|
| Filename | modeM0/AS1A10_021T08_9000004042_28010cztM0_level2.evt | modeM0/AS1A10_021T08_9000004042_28010cztM0_level2_quad_clean.evt |
| Size (bytes) | 506,448,000 | 90,149,760 |
| Size | 483.0 MB | 86.0 MB |
| Events in quadrant A | 3,342,298 | 581,304 |
| Events in quadrant B | 3,350,709 | 596,136 |
| Events in quadrant C | 3,429,371 | 573,443 |
| Events in quadrant D | 4,797,830 | 549,130 |
| Mode M0 | |||
|---|---|---|---|
| Quadrant | BADHDUFLAG | Total packets | Discarded packets |
| A | 0 | 13200 | 0 |
| B | 0 | 13269 | 0 |
| C | 0 | 13588 | 0 |
| D | 0 | 18436 | 0 |
| Mode M9 | |||
|---|---|---|---|
| Quadrant | BADHDUFLAG | Total packets | Discarded packets |
| A | 0 | 12 | 0 |
| B | 0 | 12 | 0 |
| C | 0 | 12 | 0 |
| D | 0 | 12 | 0 |
| Quadrant | Total seconds | Saturated seconds | Saturation percentage |
|---|---|---|---|
| A | 6156 | 94 | 1.526966% |
| B | 6156 | 107 | 1.738142% |
| C | 6157 | 130 | 2.111418% |
| D | 6156 | 281 | 4.564652% |
Noise dominated data is calculated using 1-second bins in cleaned event files. If a bin has >2000 counts, and if more than 50% of those come from <1% of pixels, then it is considered to be noise-dominated and hence unusable.
| Quadrant | # 1 sec bins | Bins with >0 counts | Bins with >2000 counts | High rate bins dominated by noise | Noise dominated (total time) | Noise dominated (detector-on time) | Marked lightcurve |
|---|---|---|---|---|---|---|---|
| A | 7396 | 6156 | 0 | 0 | 0.00% | 0.00% | 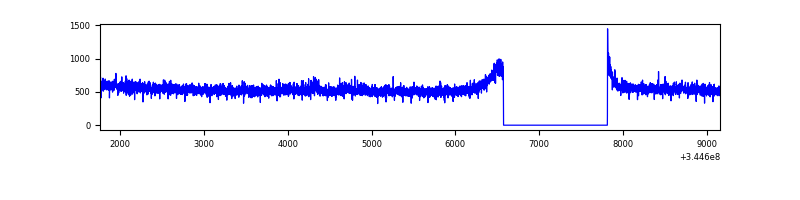 |
| B | 7396 | 6156 | 2 | 2 | 0.03% | 0.03% | 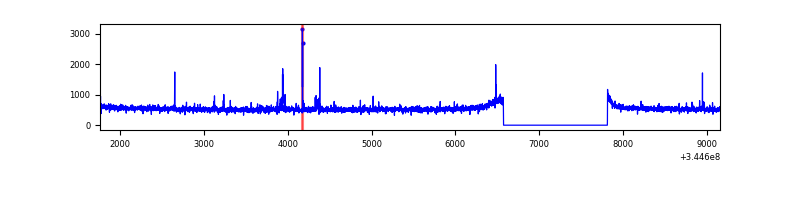 |
| C | 7397 | 6157 | 1 | 1 | 0.01% | 0.02% | 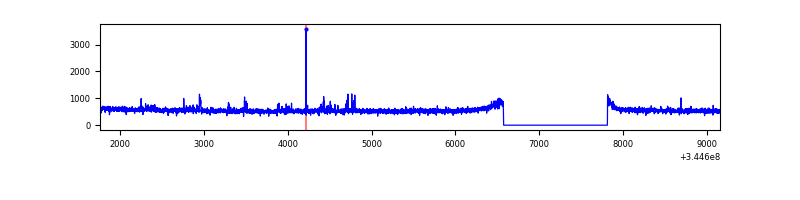 |
| D | 7396 | 6156 | 219 | 219 | 2.96% | 3.56% | 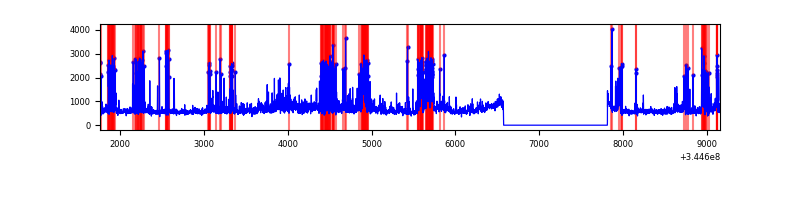 |
Top three noisy pixels from each quadrant. If the there are fewer than three noisy pixels in the level2.evt file, extra rows are filled as -1
| Pixel properties | Quadrant properties | ||||||
|---|---|---|---|---|---|---|---|
| Quadrant | DetID | PixID | Counts | Sigma | Mean | Median | Sigma |
| A | 0 | 13 | 49287 | 284.46 | 853 | 837 | 170.3 |
| A | 13 | 254 | 10033 | 53.99 | 853 | 837 | 170.3 |
| A | 3 | 137 | 7570 | 39.53 | 853 | 837 | 170.3 |
| B | 10 | 245 | 31367 | 192.82 | 839 | 818 | 158.4 |
| B | 12 | 111 | 18824 | 113.65 | 839 | 818 | 158.4 |
| B | 4 | 200 | 18348 | 110.64 | 839 | 818 | 158.4 |
| C | 14 | 238 | 134953 | 701.74 | 824 | 831 | 191.1 |
| C | 3 | 233 | 42975 | 220.5 | 824 | 831 | 191.1 |
| C | 15 | 208 | 37484 | 191.77 | 824 | 831 | 191.1 |
| D | 8 | 195 | 813796 | 4169.39 | 826 | 808 | 195.0 |
| D | 2 | 250 | 428623 | 2194.04 | 826 | 808 | 195.0 |
| D | 1 | 52 | 359852 | 1841.35 | 826 | 808 | 195.0 |
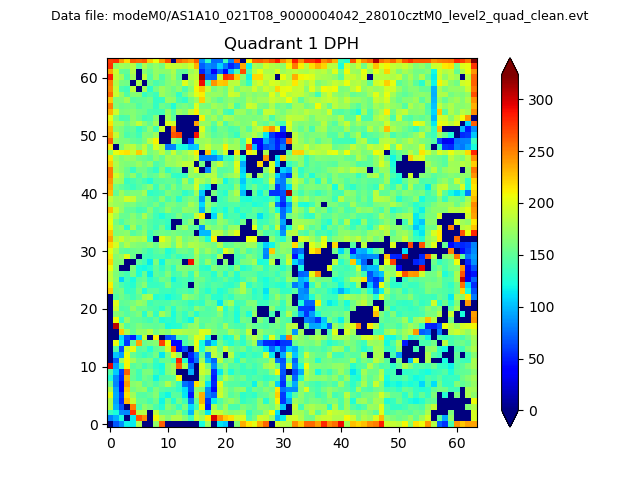
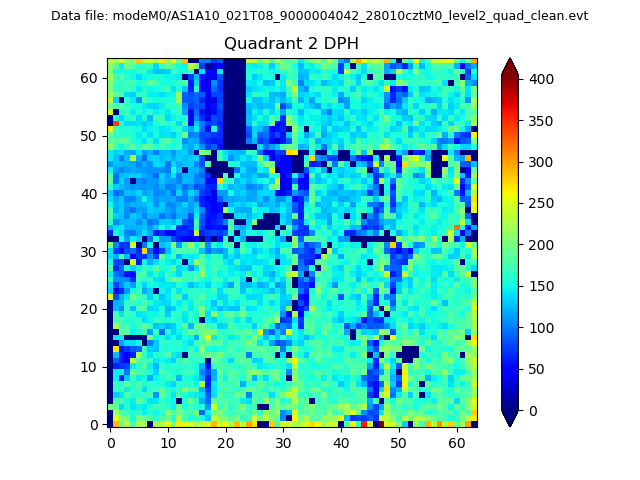
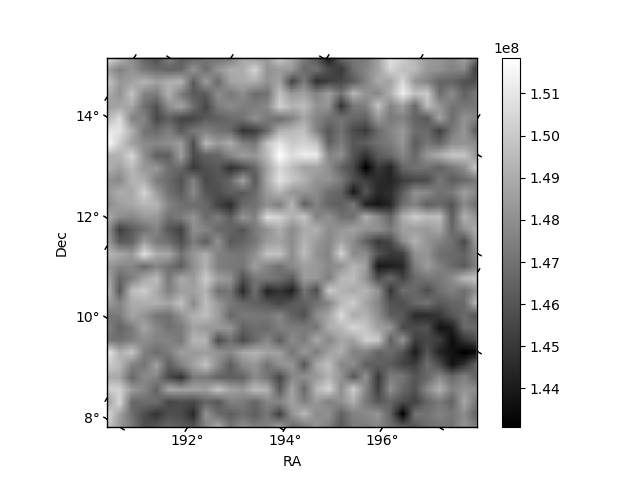
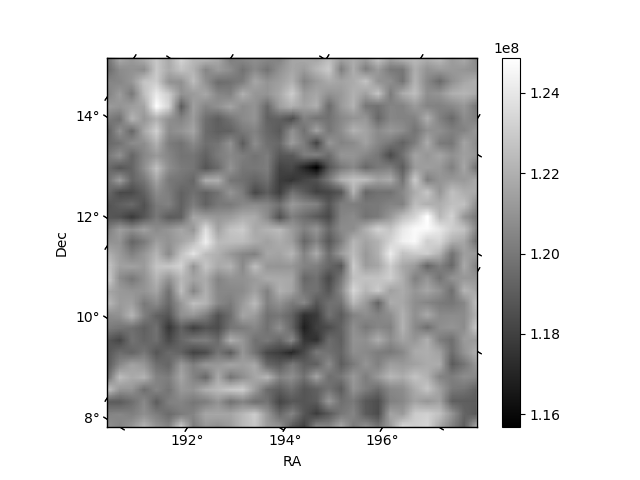
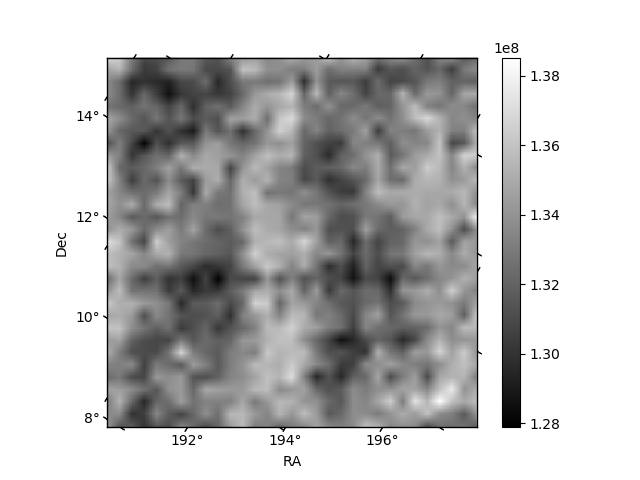
Histogram calculated using DETX and DETY for each event in the final _common_clean file
| Quadrant A |  |
 |
Quadrant B |
|---|---|---|---|
| Quadrant D |  |
 |
Quadrant C |
| Plot type | Count rate plots | Images |
|---|---|---|
| Comparison with Poisson distribution Blue bars denote a histogram of data divided into 1 sec bins. Red curve is a Poisson curve with rate = median count rate of data. |
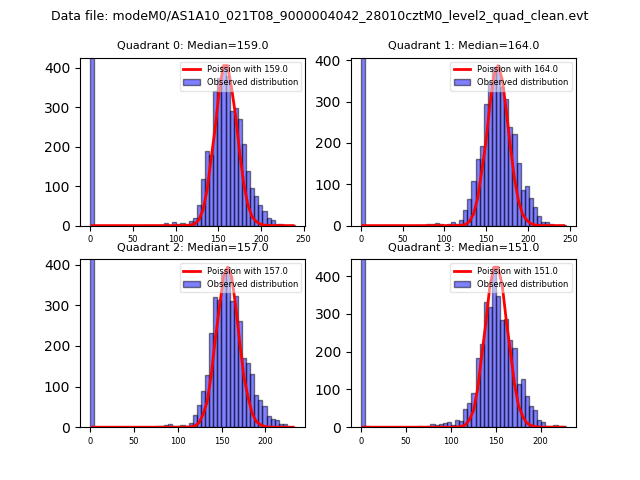 |
 |
| Quadrant-wise count rates Data is divided into 100 sec bins |
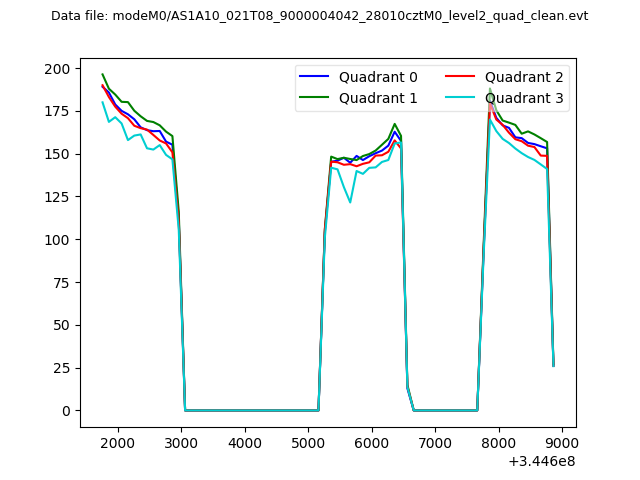 |
|
| Module-wise count rates for Quadrant A Data is divided into 100 sec bins |
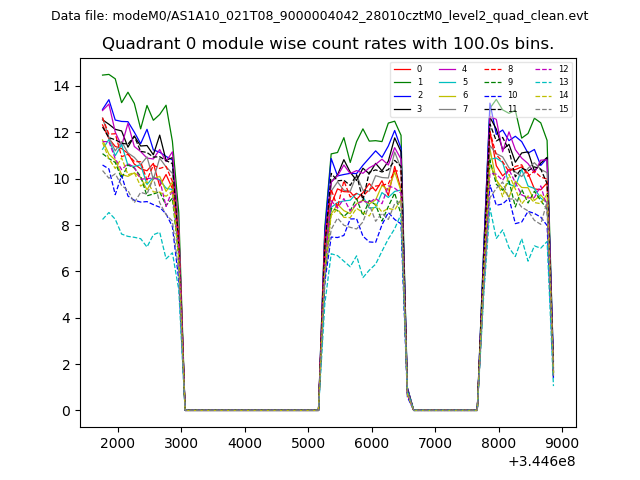 |
 |
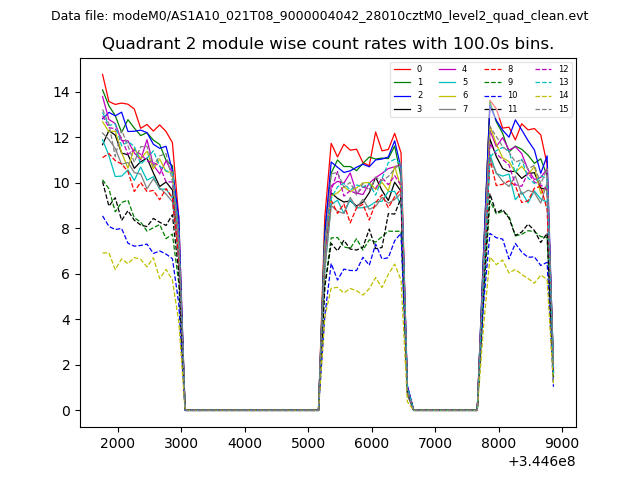
| Module-wise count rates for Quadrant B Data is divided into 100 sec bins |
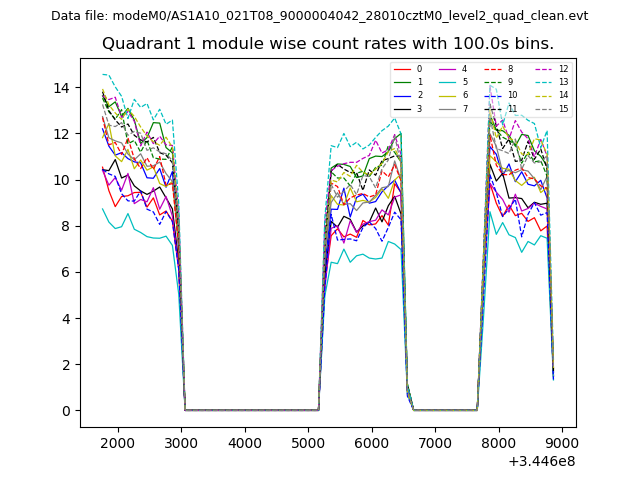 |
 |
| Module-wise count rates for Quadrant C Data is divided into 100 sec bins |
 |
 |
| Module-wise count rates for Quadrant D Data is divided into 100 sec bins |
 |
 |
| Parameter | Plot |
|---|---|
| CZT HV Monitor | 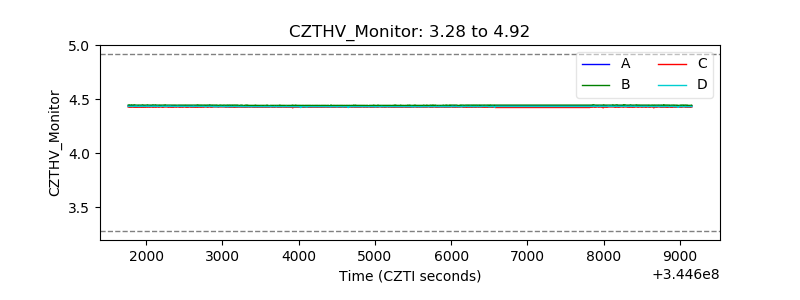 |
| D_VDD | 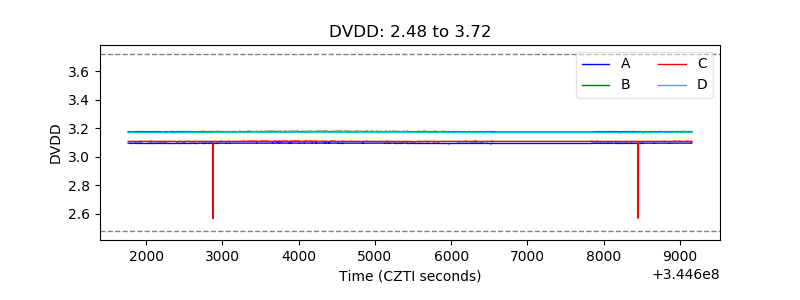 |
| Temperature 1 | 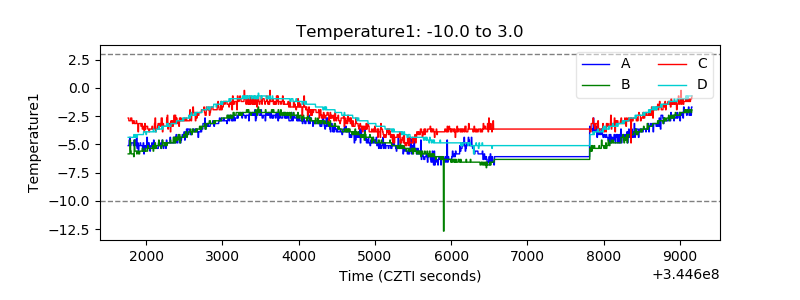 |
| Veto HV Monitor | 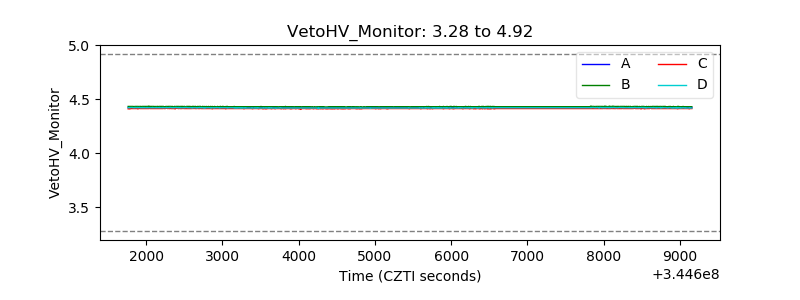 |
| Veto LLD | 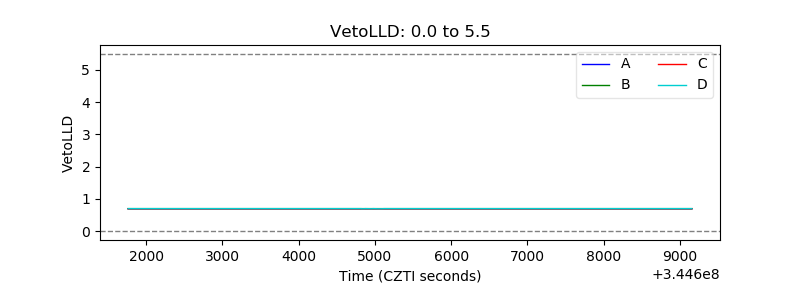 |
| Alpha Counter | 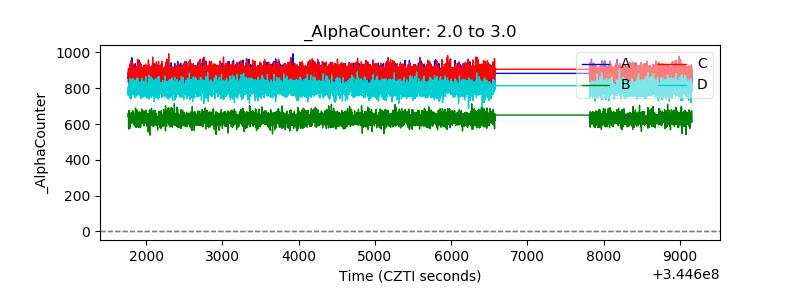 |
| _CPM_Rate | 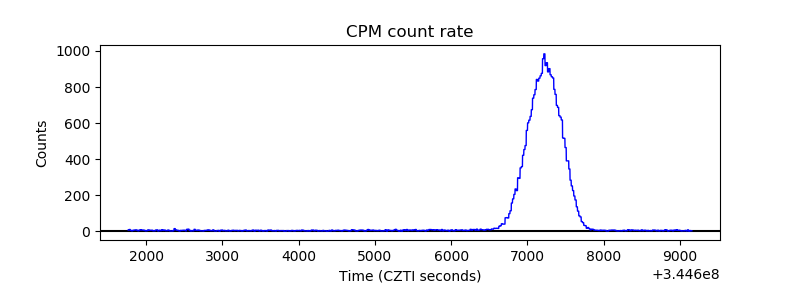 |
| CZT Counter | 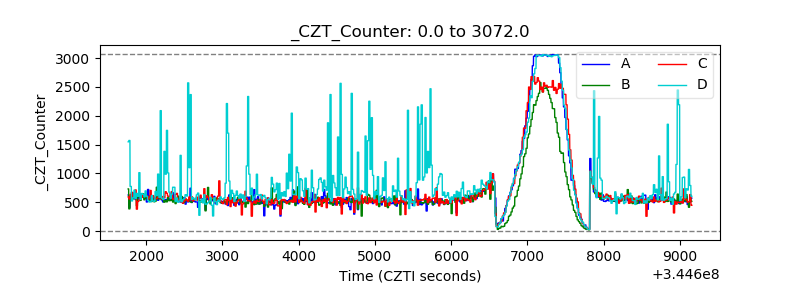 |
| +2.5 Volts monitor | 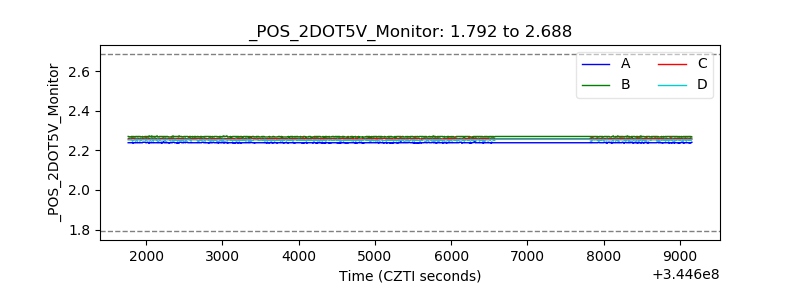 |
| +5 Volts monitor |  |
| _ROLL_ROT | 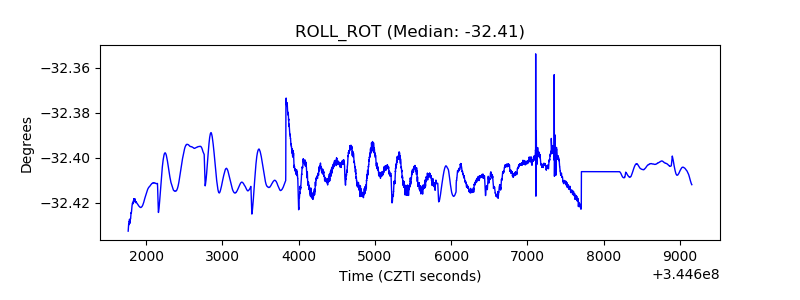 |
| _Roll_DEC | 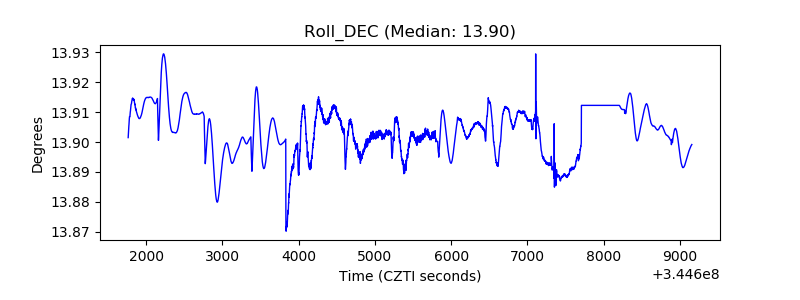 |
| _Roll_RA | 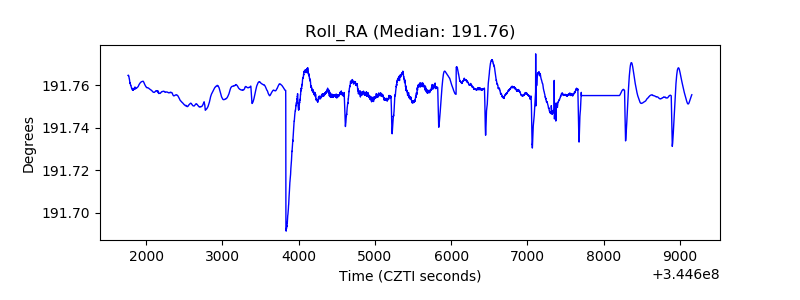 |
| Veto Counter | 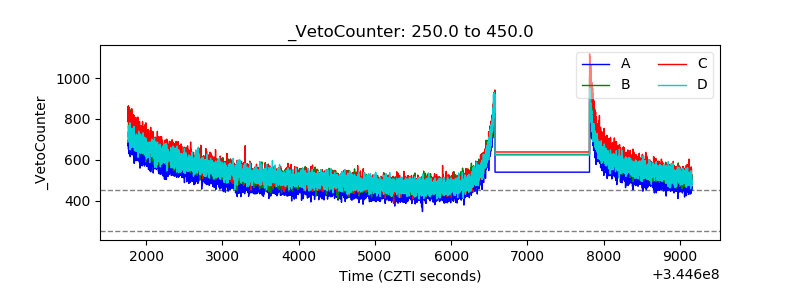 |