| Param | Original file | Final file |
|---|---|---|
| Filename | modeM0/AS1A10_021T08_9000004042_28011cztM0_level2.evt | modeM0/AS1A10_021T08_9000004042_28011cztM0_level2_quad_clean.evt |
| Size (bytes) | 528,721,920 | 77,299,200 |
| Size | 504.2 MB | 73.7 MB |
| Events in quadrant A | 3,274,397 | 480,664 |
| Events in quadrant B | 3,321,621 | 490,298 |
| Events in quadrant C | 3,324,046 | 472,879 |
| Events in quadrant D | 5,665,069 | 457,343 |
| Mode M0 | |||
|---|---|---|---|
| Quadrant | BADHDUFLAG | Total packets | Discarded packets |
| A | 0 | 13194 | 0 |
| B | 0 | 13353 | 0 |
| C | 0 | 13282 | 0 |
| D | 0 | 21170 | 0 |
| Mode M9 | |||
|---|---|---|---|
| Quadrant | BADHDUFLAG | Total packets | Discarded packets |
| A | 0 | 10 | 0 |
| B | 0 | 10 | 0 |
| C | 0 | 10 | 0 |
| D | 0 | 10 | 0 |
| Quadrant | Total seconds | Saturated seconds | Saturation percentage |
|---|---|---|---|
| A | 6296 | 128 | 2.033037% |
| B | 6296 | 130 | 2.064803% |
| C | 6296 | 156 | 2.477764% |
| D | 6296 | 601 | 9.545743% |
Noise dominated data is calculated using 1-second bins in cleaned event files. If a bin has >2000 counts, and if more than 50% of those come from <1% of pixels, then it is considered to be noise-dominated and hence unusable.
| Quadrant | # 1 sec bins | Bins with >0 counts | Bins with >2000 counts | High rate bins dominated by noise | Noise dominated (total time) | Noise dominated (detector-on time) | Marked lightcurve |
|---|---|---|---|---|---|---|---|
| A | 7281 | 6296 | 0 | 0 | 0.00% | 0.00% | 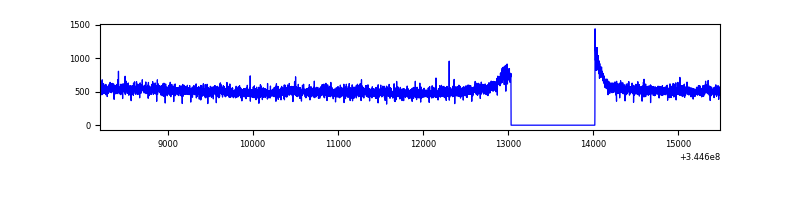 |
| B | 7281 | 6296 | 3 | 3 | 0.04% | 0.05% | 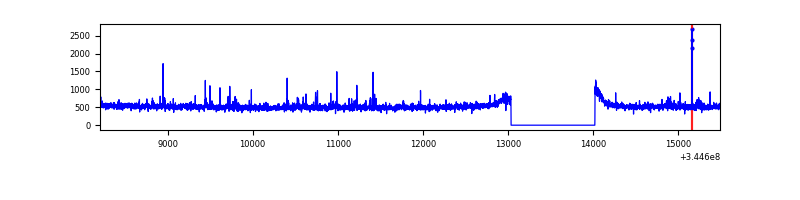 |
| C | 7281 | 6296 | 1 | 1 | 0.01% | 0.02% | 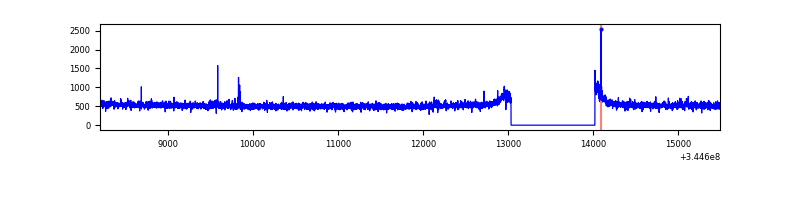 |
| D | 7281 | 6296 | 447 | 447 | 6.14% | 7.10% | 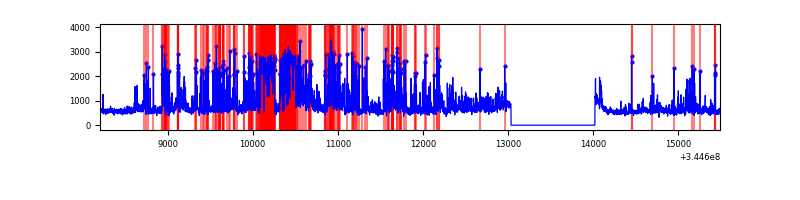 |
Top three noisy pixels from each quadrant. If the there are fewer than three noisy pixels in the level2.evt file, extra rows are filled as -1
| Pixel properties | Quadrant properties | ||||||
|---|---|---|---|---|---|---|---|
| Quadrant | DetID | PixID | Counts | Sigma | Mean | Median | Sigma |
| A | 0 | 13 | 37275 | 215.28 | 838 | 819 | 169.3 |
| A | 13 | 254 | 10919 | 59.64 | 838 | 819 | 169.3 |
| A | 3 | 137 | 7734 | 40.83 | 838 | 819 | 169.3 |
| B | 10 | 245 | 37817 | 236.48 | 825 | 803 | 156.5 |
| B | 4 | 200 | 19279 | 118.04 | 825 | 803 | 156.5 |
| B | 12 | 111 | 18873 | 115.45 | 825 | 803 | 156.5 |
| C | 14 | 238 | 129350 | 680.55 | 808 | 814 | 188.9 |
| C | 3 | 233 | 37770 | 195.67 | 808 | 814 | 188.9 |
| C | 2 | 16 | 5540 | 25.02 | 808 | 814 | 188.9 |
| D | 1 | 52 | 1736422 | 9318.38 | 783 | 763 | 186.3 |
| D | 8 | 195 | 620870 | 3329.22 | 783 | 763 | 186.3 |
| D | 2 | 250 | 251338 | 1345.28 | 783 | 763 | 186.3 |
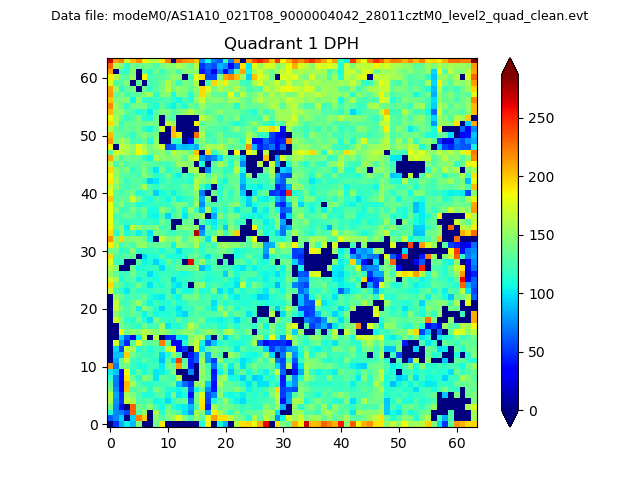
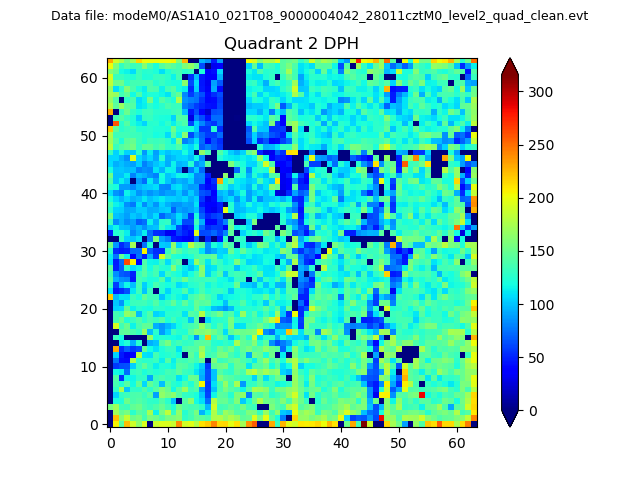
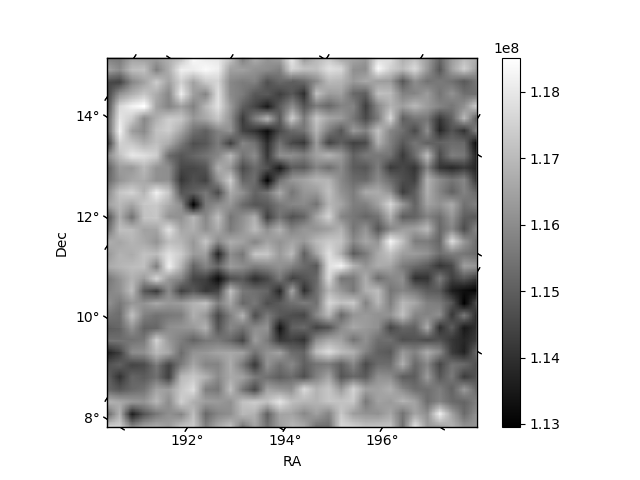
Histogram calculated using DETX and DETY for each event in the final _common_clean file
| Quadrant A |  |
 |
Quadrant B |
|---|---|---|---|
| Quadrant D |  |
 |
Quadrant C |
| Plot type | Count rate plots | Images |
|---|---|---|
| Comparison with Poisson distribution Blue bars denote a histogram of data divided into 1 sec bins. Red curve is a Poisson curve with rate = median count rate of data. |
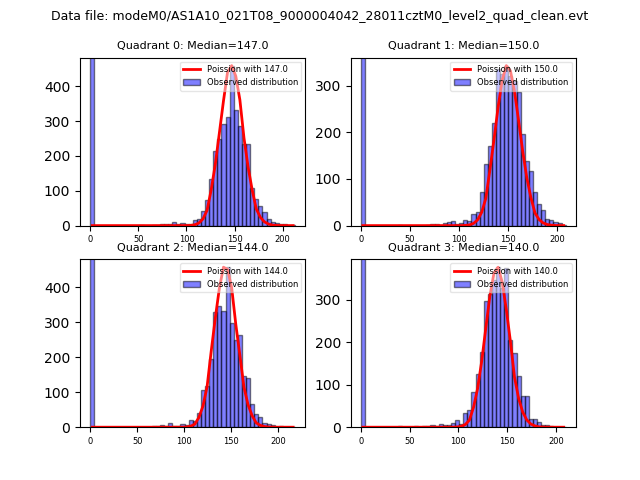 |
 |
| Quadrant-wise count rates Data is divided into 100 sec bins |
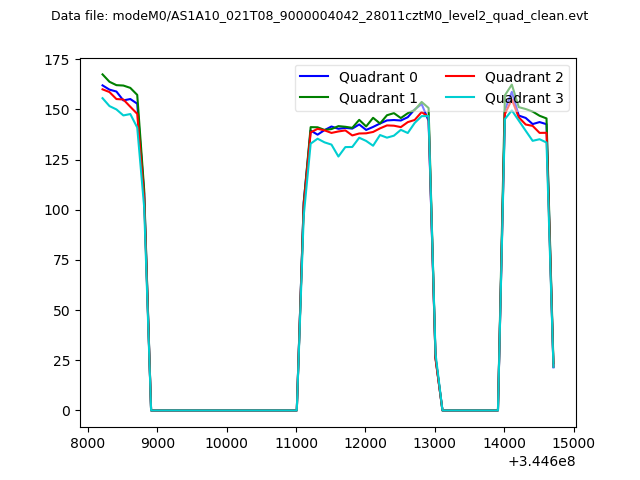 |
|
| Module-wise count rates for Quadrant A Data is divided into 100 sec bins |
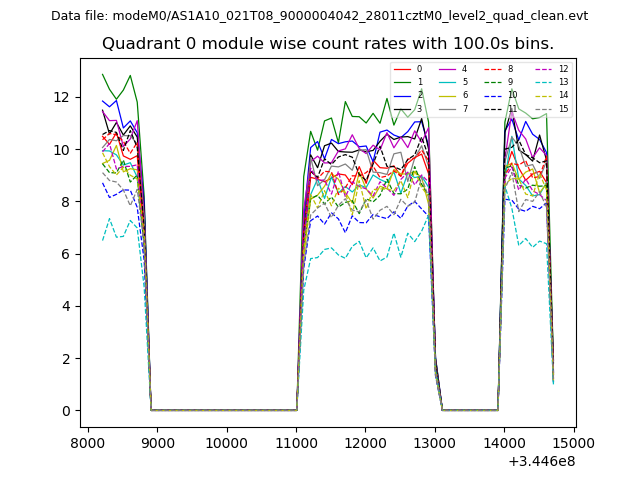 |
 |
| Module-wise count rates for Quadrant B Data is divided into 100 sec bins |
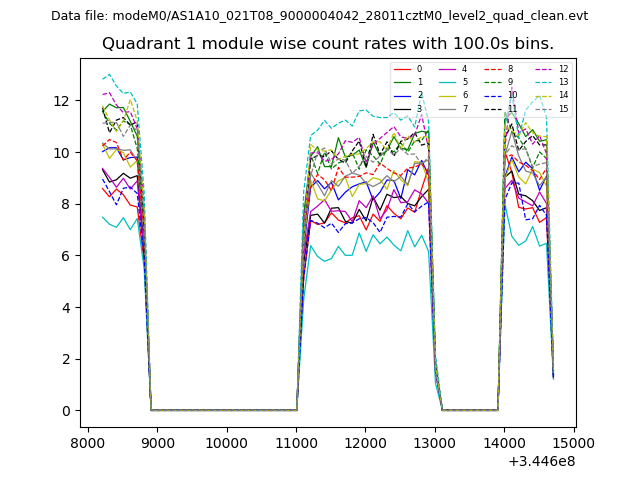 |
 |
| Module-wise count rates for Quadrant C Data is divided into 100 sec bins |
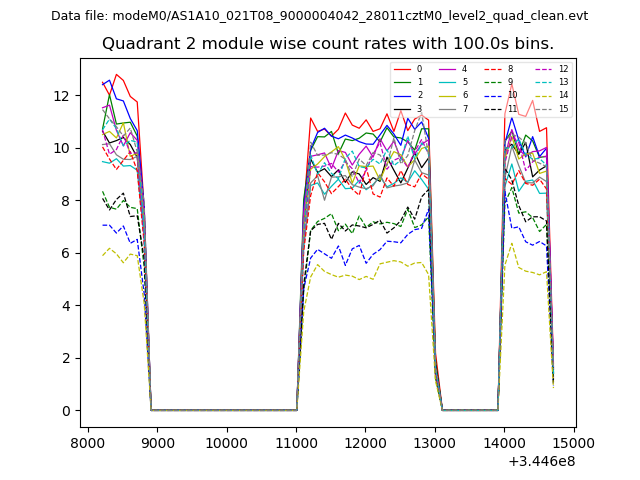 |
 |
| Module-wise count rates for Quadrant D Data is divided into 100 sec bins |
 |
 |
| Parameter | Plot |
|---|---|
| CZT HV Monitor | 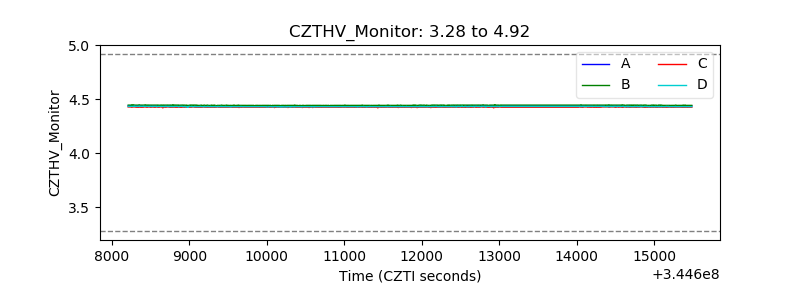 |
| D_VDD | 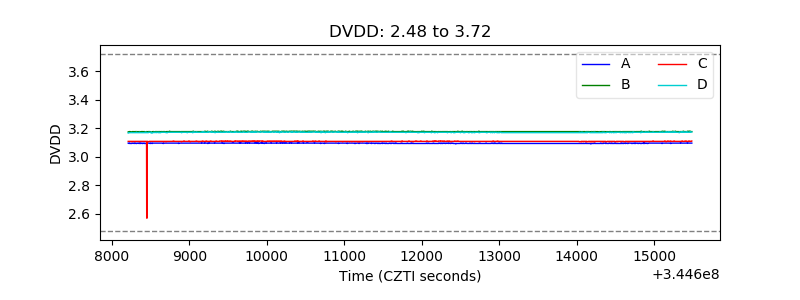 |
| Temperature 1 | 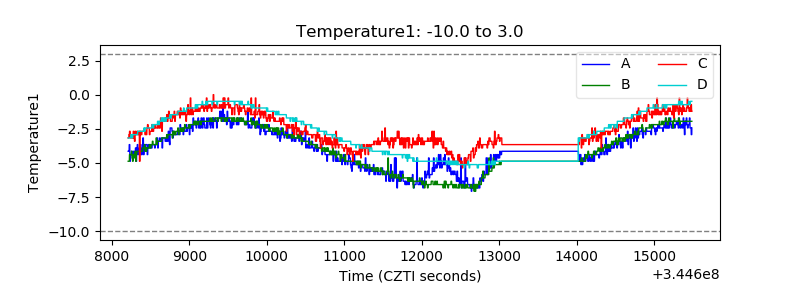 |
| Veto HV Monitor | 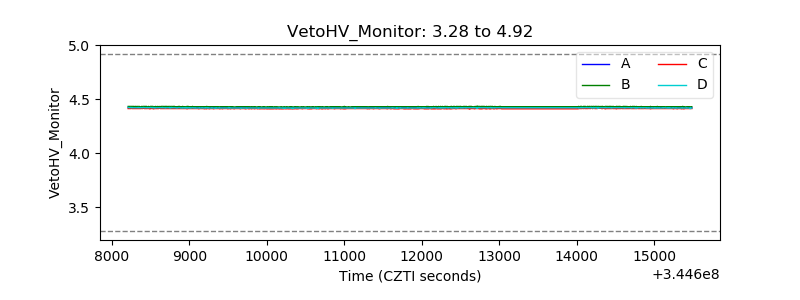 |
| Veto LLD | 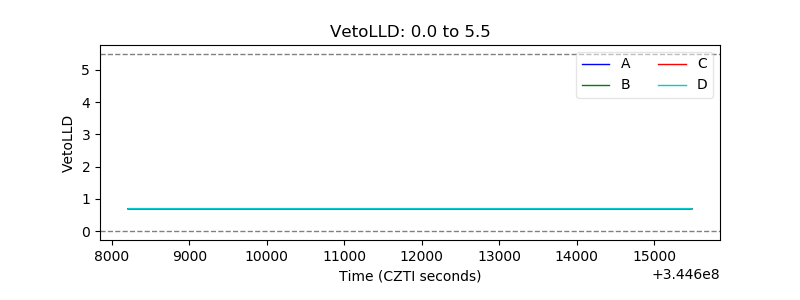 |
| Alpha Counter | 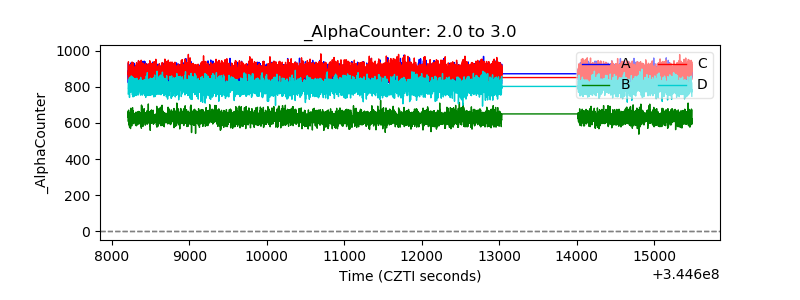 |
| _CPM_Rate | 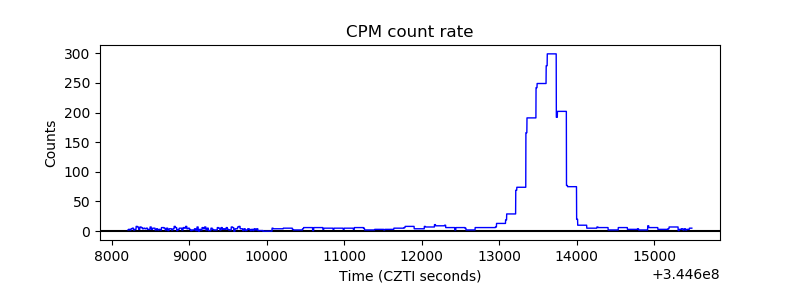 |
| CZT Counter | 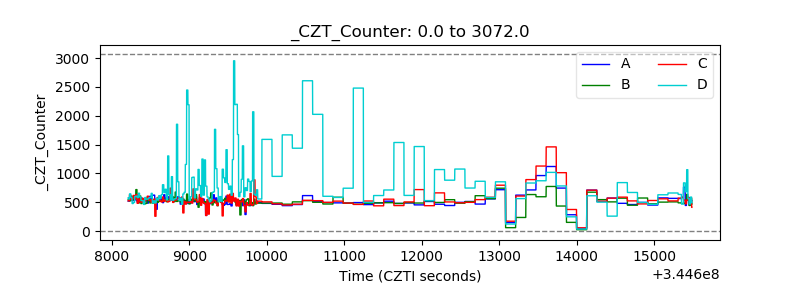 |
| +2.5 Volts monitor |  |
| +5 Volts monitor | 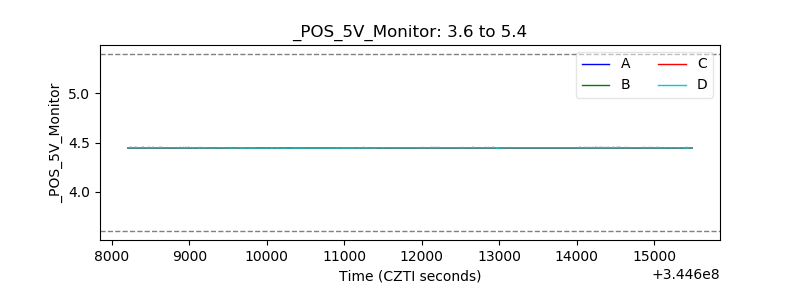 |
| _ROLL_ROT |  |
| _Roll_DEC | 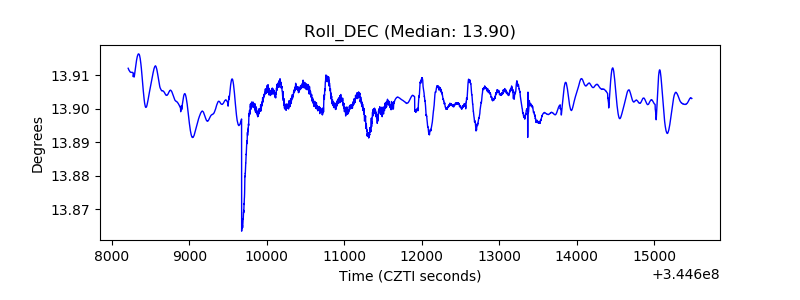 |
| _Roll_RA | 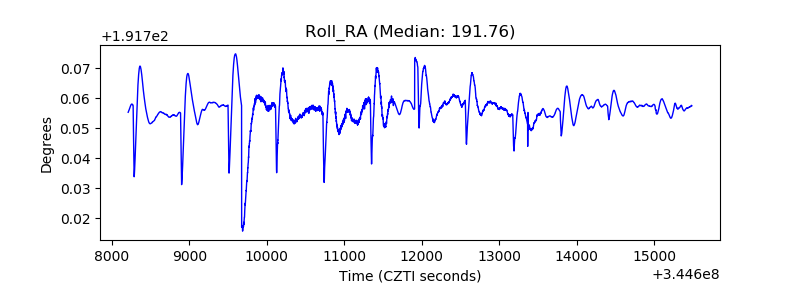 |
| Veto Counter | 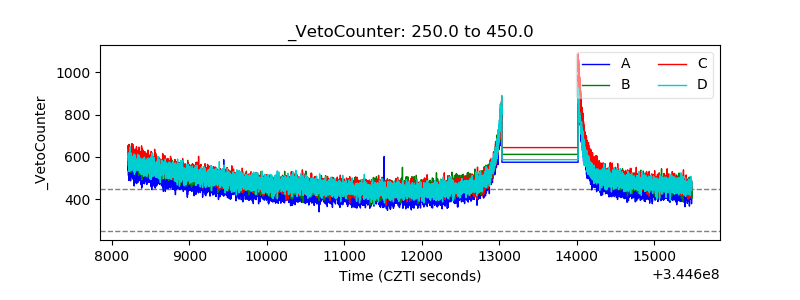 |