| Param | Original file | Final file |
|---|---|---|
| Filename | modeM0/AS1A10_021T08_9000004042_28012cztM0_level2.evt | modeM0/AS1A10_021T08_9000004042_28012cztM0_level2_quad_clean.evt |
| Size (bytes) | 576,138,240 | 82,964,160 |
| Size | 549.4 MB | 79.1 MB |
| Events in quadrant A | 3,614,062 | 513,928 |
| Events in quadrant B | 3,658,173 | 524,514 |
| Events in quadrant C | 4,245,752 | 499,245 |
| Events in quadrant D | 5,452,897 | 483,520 |
| Mode M0 | |||
|---|---|---|---|
| Quadrant | BADHDUFLAG | Total packets | Discarded packets |
| A | 0 | 14857 | 0 |
| B | 0 | 14969 | 0 |
| C | 0 | 16946 | 0 |
| D | 0 | 20858 | 0 |
| Mode M9 | |||
|---|---|---|---|
| Quadrant | BADHDUFLAG | Total packets | Discarded packets |
| A | 0 | 6 | 0 |
| B | 0 | 7 | 0 |
| C | 0 | 7 | 0 |
| D | 0 | 7 | 0 |
| Quadrant | Total seconds | Saturated seconds | Saturation percentage |
|---|---|---|---|
| A | 7041 | 172 | 2.442835% |
| B | 7041 | 203 | 2.883113% |
| C | 7041 | 285 | 4.047720% |
| D | 7041 | 451 | 6.405340% |
Noise dominated data is calculated using 1-second bins in cleaned event files. If a bin has >2000 counts, and if more than 50% of those come from <1% of pixels, then it is considered to be noise-dominated and hence unusable.
| Quadrant | # 1 sec bins | Bins with >0 counts | Bins with >2000 counts | High rate bins dominated by noise | Noise dominated (total time) | Noise dominated (detector-on time) | Marked lightcurve |
|---|---|---|---|---|---|---|---|
| A | 7626 | 7041 | 0 | 0 | 0.00% | 0.00% | 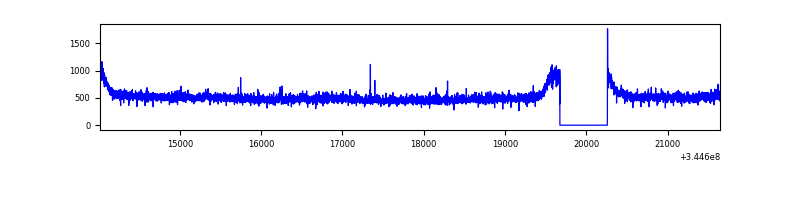 |
| B | 7626 | 7041 | 4 | 4 | 0.05% | 0.06% | 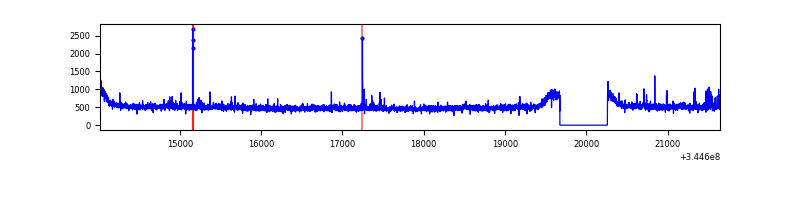 |
| C | 7626 | 7041 | 10 | 10 | 0.13% | 0.14% | 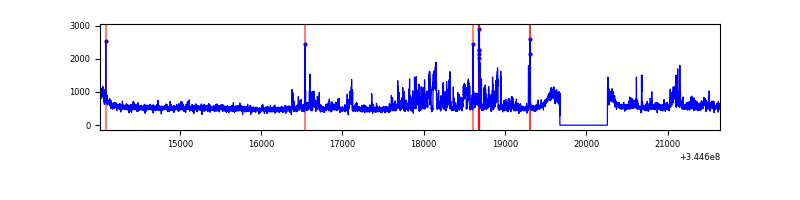 |
| D | 7626 | 7041 | 260 | 260 | 3.41% | 3.69% | 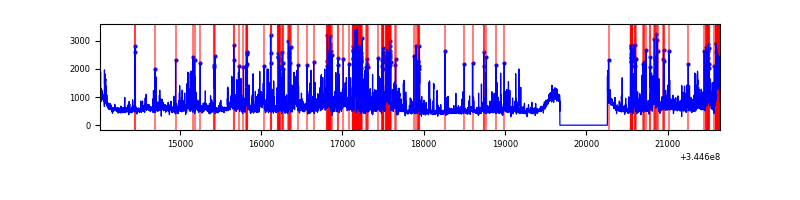 |
Top three noisy pixels from each quadrant. If the there are fewer than three noisy pixels in the level2.evt file, extra rows are filled as -1
| Pixel properties | Quadrant properties | ||||||
|---|---|---|---|---|---|---|---|
| Quadrant | DetID | PixID | Counts | Sigma | Mean | Median | Sigma |
| A | 0 | 13 | 44942 | 237.04 | 920 | 900 | 185.8 |
| A | 13 | 254 | 12410 | 61.95 | 920 | 900 | 185.8 |
| A | 3 | 137 | 8936 | 43.25 | 920 | 900 | 185.8 |
| B | 10 | 245 | 35897 | 200.5 | 910 | 888 | 174.6 |
| B | 4 | 200 | 26690 | 147.77 | 910 | 888 | 174.6 |
| B | 12 | 111 | 21514 | 118.13 | 910 | 888 | 174.6 |
| C | 3 | 233 | 658677 | 3165.04 | 884 | 890 | 207.8 |
| C | 14 | 238 | 141015 | 674.23 | 884 | 890 | 207.8 |
| C | 13 | 61 | 5963 | 24.41 | 884 | 890 | 207.8 |
| D | 1 | 52 | 1209490 | 5694.57 | 886 | 863 | 212.2 |
| D | 8 | 195 | 471282 | 2216.43 | 886 | 863 | 212.2 |
| D | 2 | 250 | 269162 | 1264.12 | 886 | 863 | 212.2 |
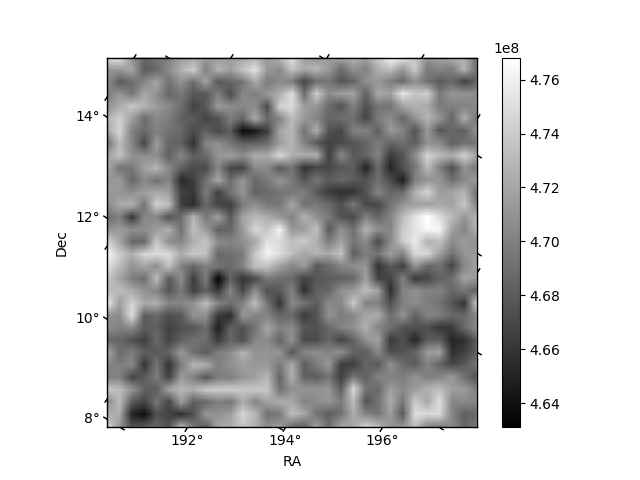
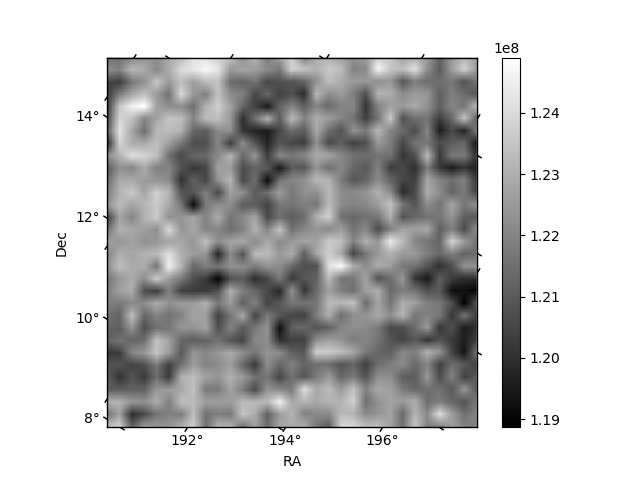
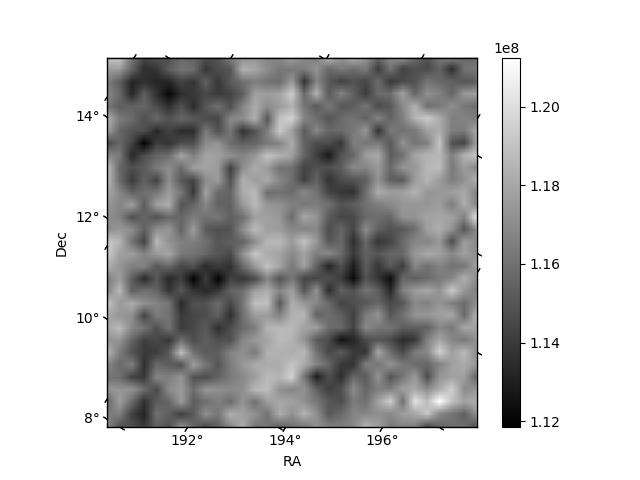
Histogram calculated using DETX and DETY for each event in the final _common_clean file
| Quadrant A | 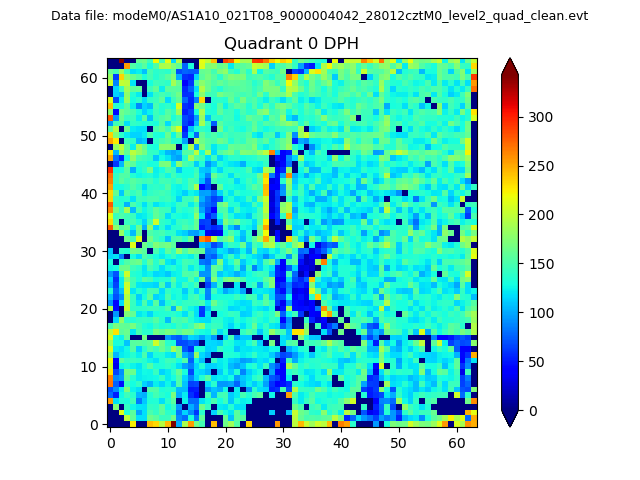 |
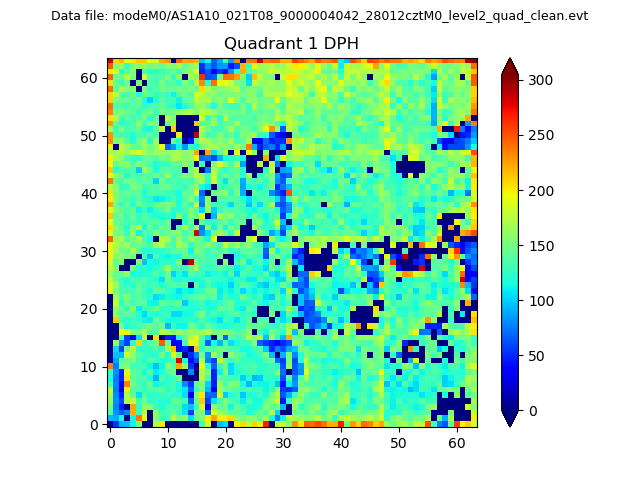 |
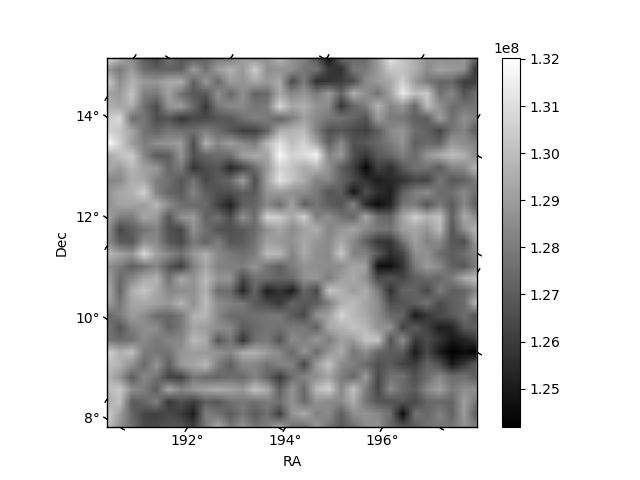
Quadrant B |
|---|---|---|---|
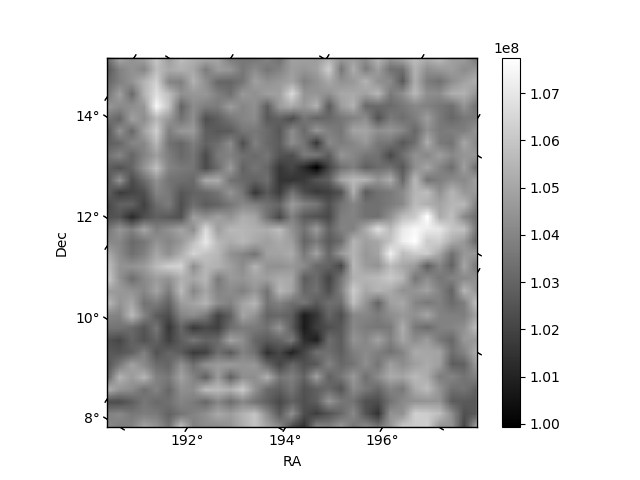
| Quadrant D | 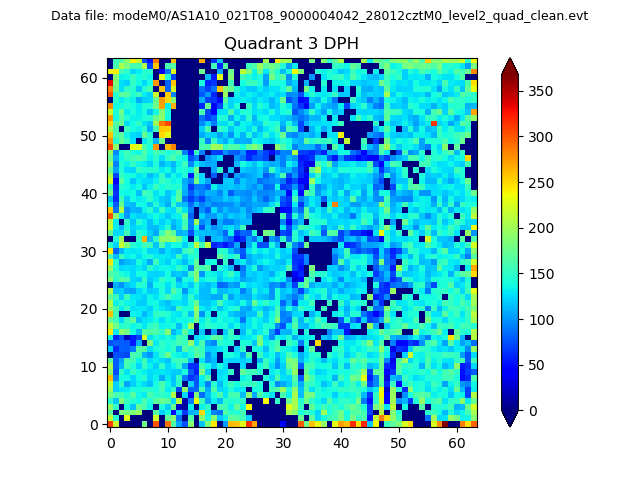 |
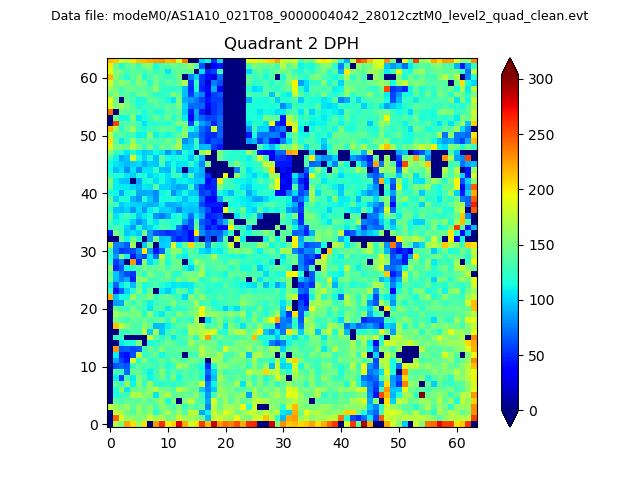 |
Quadrant C |
| Plot type | Count rate plots | Images |
|---|---|---|
| Comparison with Poisson distribution Blue bars denote a histogram of data divided into 1 sec bins. Red curve is a Poisson curve with rate = median count rate of data. |
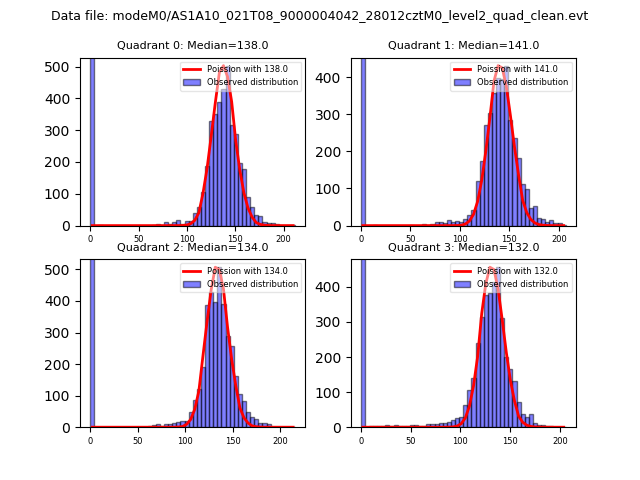 |
 |
| Quadrant-wise count rates Data is divided into 100 sec bins |
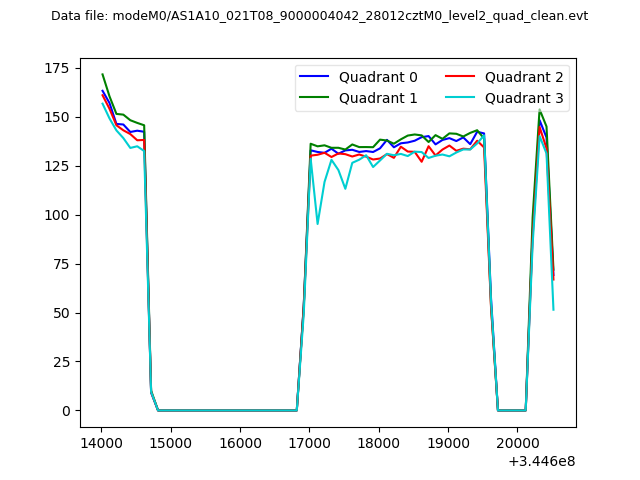 |
|
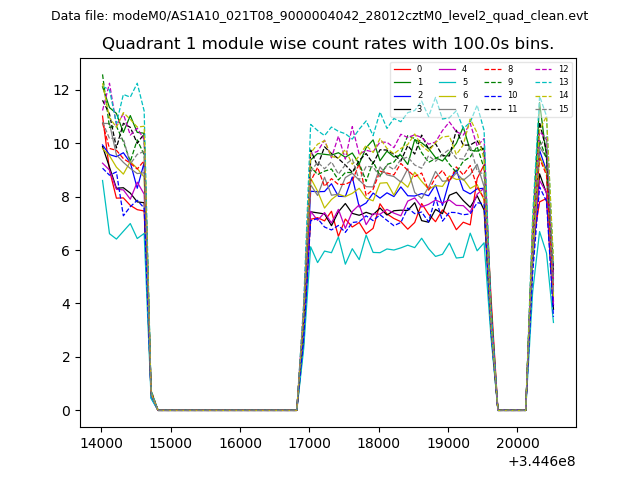
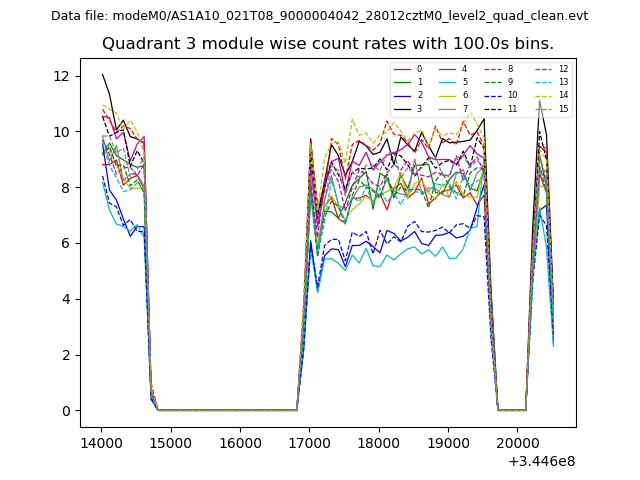
| Module-wise count rates for Quadrant A Data is divided into 100 sec bins |
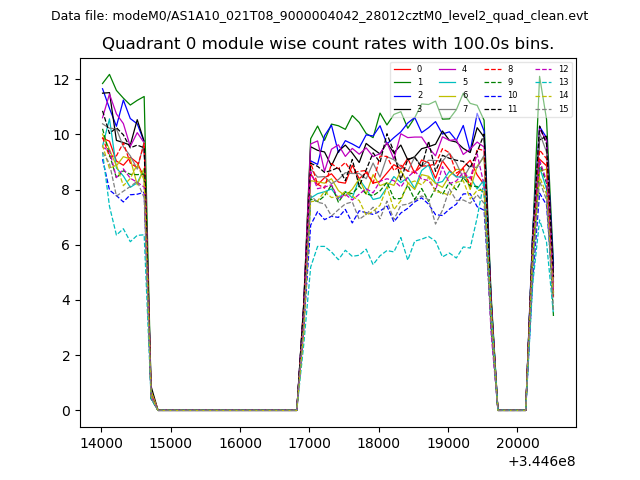 |
 |
| Module-wise count rates for Quadrant B Data is divided into 100 sec bins |
 |
 |
| Module-wise count rates for Quadrant C Data is divided into 100 sec bins |
 |
 |
| Module-wise count rates for Quadrant D Data is divided into 100 sec bins |
 |
 |
| Parameter | Plot |
|---|---|
| CZT HV Monitor | 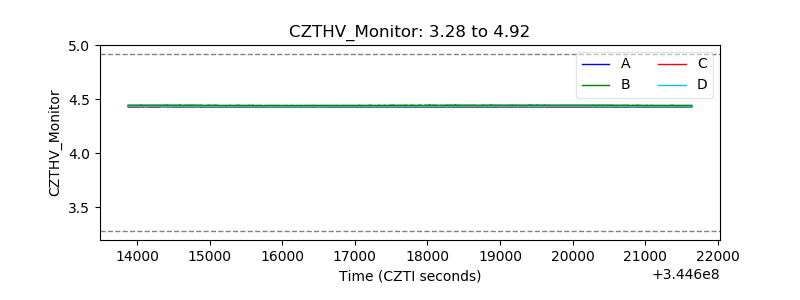 |
| D_VDD | 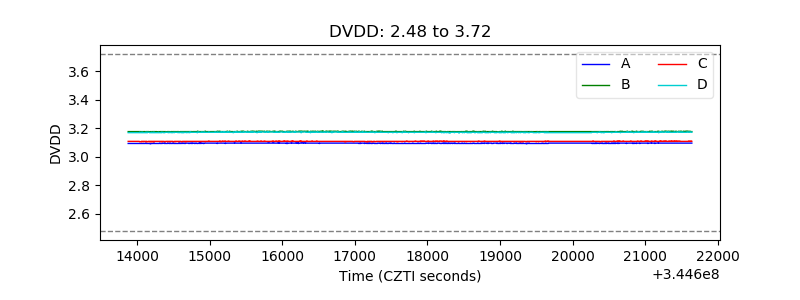 |
| Temperature 1 | 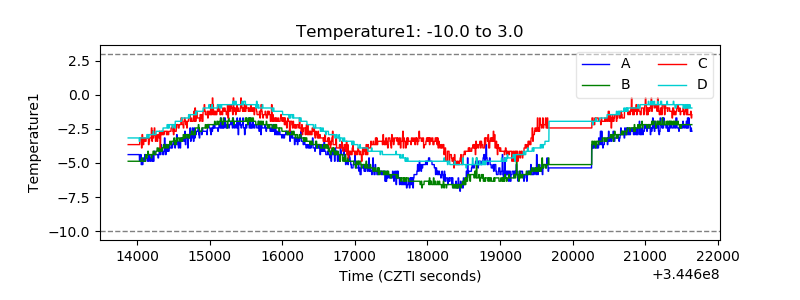 |
| Veto HV Monitor | 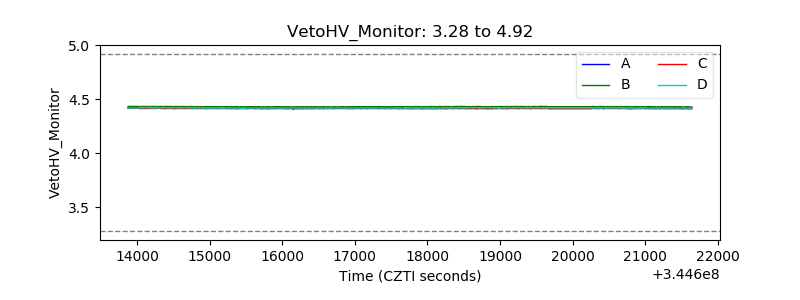 |
| Veto LLD | 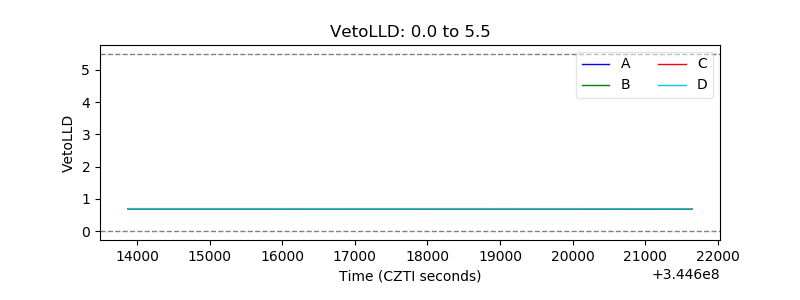 |
| Alpha Counter | 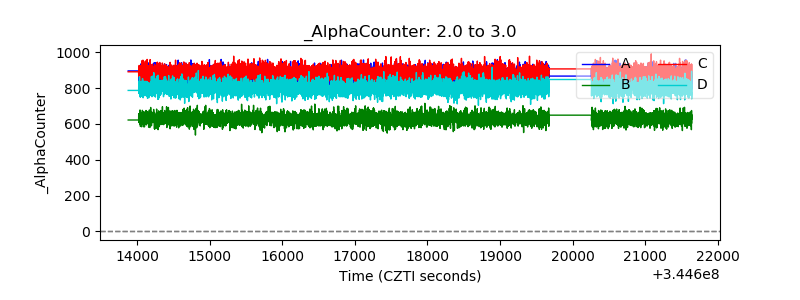 |
| _CPM_Rate | 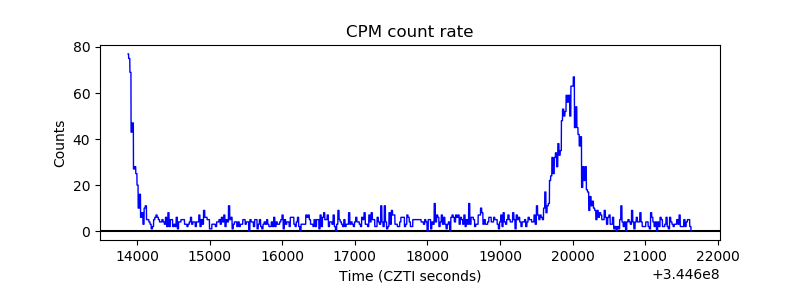 |
| CZT Counter | 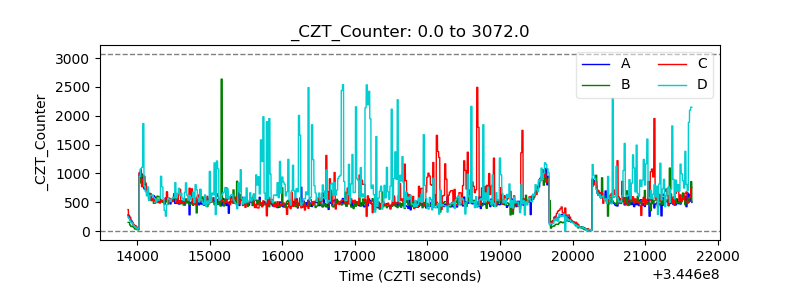 |
| +2.5 Volts monitor |  |
| +5 Volts monitor |  |
| _ROLL_ROT | 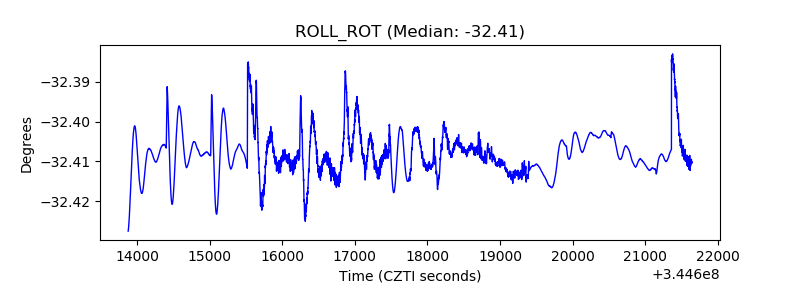 |
| _Roll_DEC | 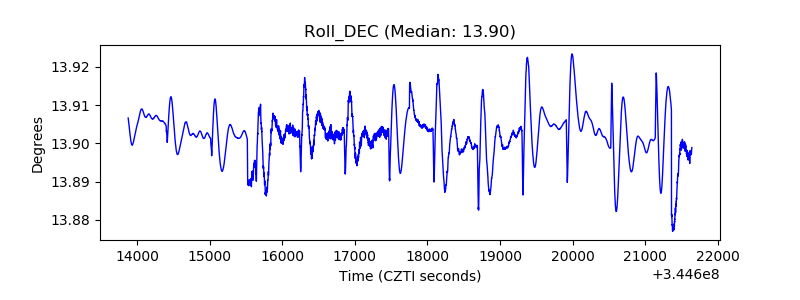 |
| _Roll_RA | 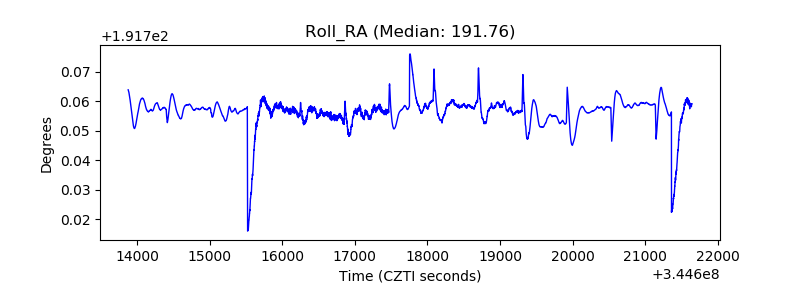 |
| Veto Counter | 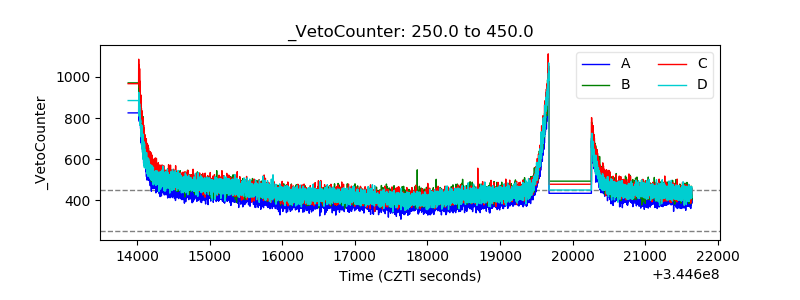 |