| Param | Original file | Final file |
|---|---|---|
| Filename | modeM0/AS1A10_021T08_9000004042_28013cztM0_level2.evt | modeM0/AS1A10_021T08_9000004042_28013cztM0_level2_quad_clean.evt |
| Size (bytes) | 307,935,360 | 23,679,360 |
| Size | 293.7 MB | 22.6 MB |
| Events in quadrant A | 1,580,153 | 125,903 |
| Events in quadrant B | 1,688,660 | 127,985 |
| Events in quadrant C | 1,812,967 | 123,054 |
| Events in quadrant D | 4,025,751 | 112,066 |
| Mode M0 | |||
|---|---|---|---|
| Quadrant | BADHDUFLAG | Total packets | Discarded packets |
| A | 0 | 6621 | 0 |
| B | 0 | 6919 | 0 |
| C | 0 | 7365 | 0 |
| D | 0 | 14173 | 0 |
| Quadrant | Total seconds | Saturated seconds | Saturation percentage |
|---|---|---|---|
| A | 3196 | 13 | 0.406758% |
| B | 3197 | 41 | 1.282452% |
| C | 3197 | 70 | 2.189553% |
| D | 3197 | 747 | 23.365655% |
Noise dominated data is calculated using 1-second bins in cleaned event files. If a bin has >2000 counts, and if more than 50% of those come from <1% of pixels, then it is considered to be noise-dominated and hence unusable.
| Quadrant | # 1 sec bins | Bins with >0 counts | Bins with >2000 counts | High rate bins dominated by noise | Noise dominated (total time) | Noise dominated (detector-on time) | Marked lightcurve |
|---|---|---|---|---|---|---|---|
| A | 3196 | 3196 | 0 | 0 | 0.00% | 0.00% | 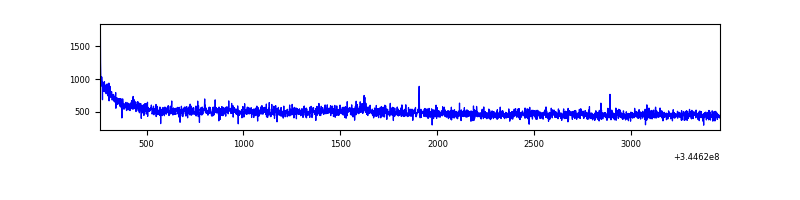 |
| B | 3197 | 3197 | 19 | 19 | 0.59% | 0.59% | 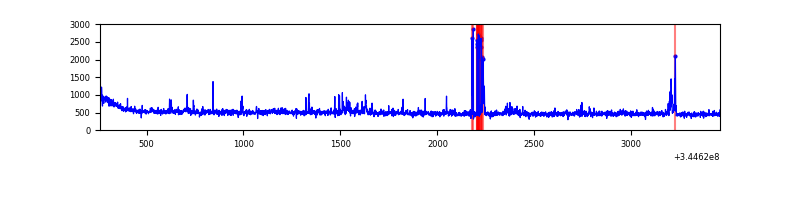 |
| C | 3197 | 3197 | 0 | 0 | 0.00% | 0.00% | 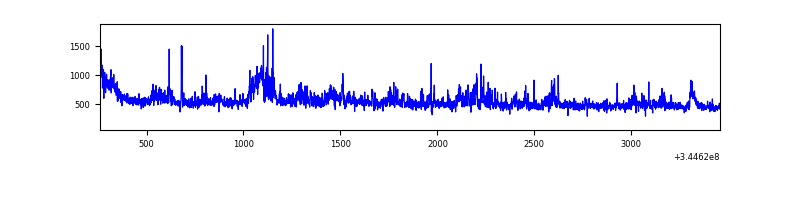 |
| D | 3197 | 3197 | 672 | 672 | 21.02% | 21.02% | 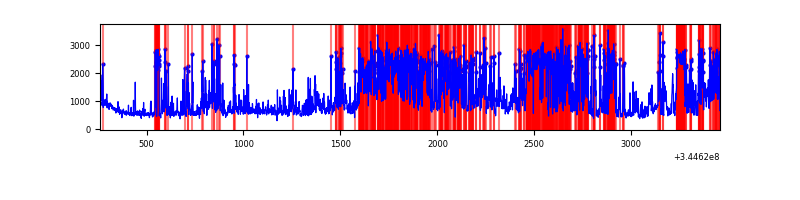 |
Top three noisy pixels from each quadrant. If the there are fewer than three noisy pixels in the level2.evt file, extra rows are filled as -1
| Pixel properties | Quadrant properties | ||||||
|---|---|---|---|---|---|---|---|
| Quadrant | DetID | PixID | Counts | Sigma | Mean | Median | Sigma |
| A | 0 | 13 | 18327 | 220.58 | 402 | 393 | 81.3 |
| A | 13 | 254 | 5528 | 63.16 | 402 | 393 | 81.3 |
| A | 3 | 137 | 3945 | 43.69 | 402 | 393 | 81.3 |
| B | 10 | 245 | 91236 | 1164.93 | 398 | 389 | 78.0 |
| B | 4 | 200 | 16871 | 211.34 | 398 | 389 | 78.0 |
| B | 12 | 111 | 9353 | 114.94 | 398 | 389 | 78.0 |
| C | 3 | 233 | 235742 | 2528.75 | 388 | 390 | 93.1 |
| C | 14 | 238 | 62760 | 670.14 | 388 | 390 | 93.1 |
| C | 13 | 61 | 2673 | 24.53 | 388 | 390 | 93.1 |
| D | 1 | 52 | 1824866 | 21086.65 | 355 | 346 | 86.5 |
| D | 7 | 80 | 311584 | 3597.09 | 355 | 346 | 86.5 |
| D | 8 | 195 | 253693 | 2928.02 | 355 | 346 | 86.5 |
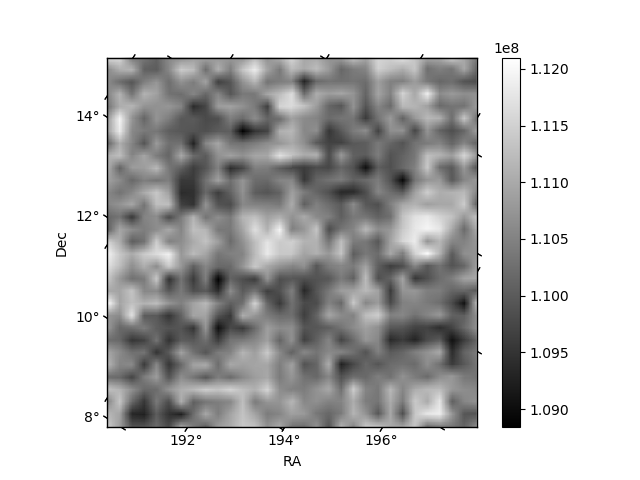
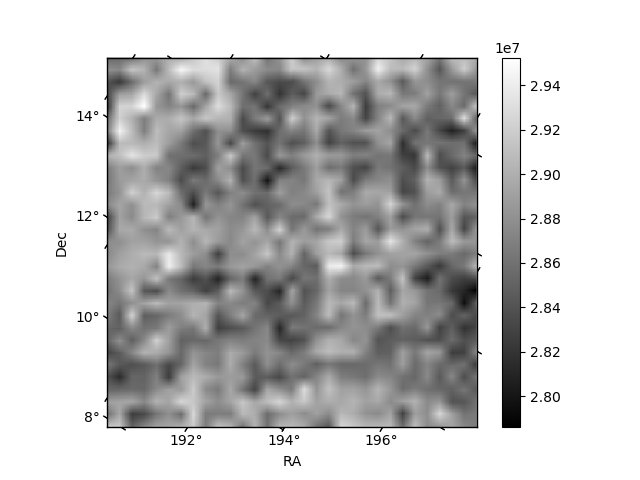
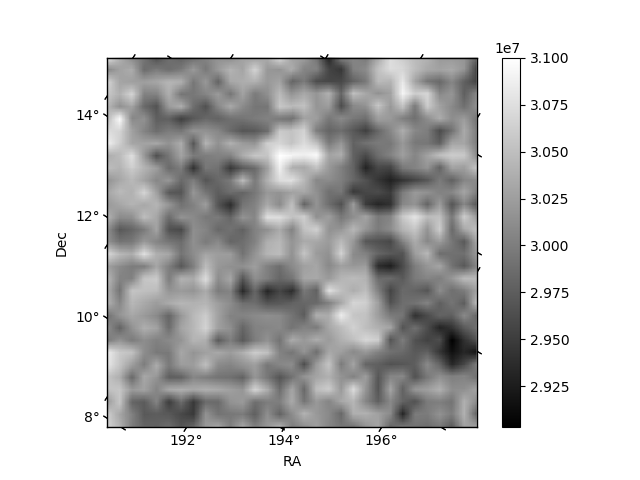
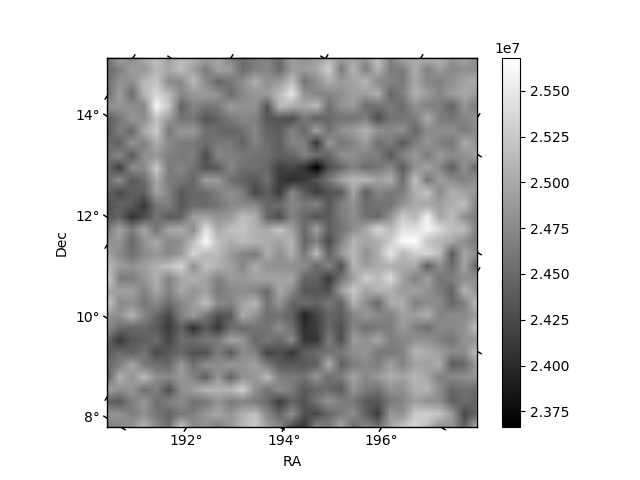
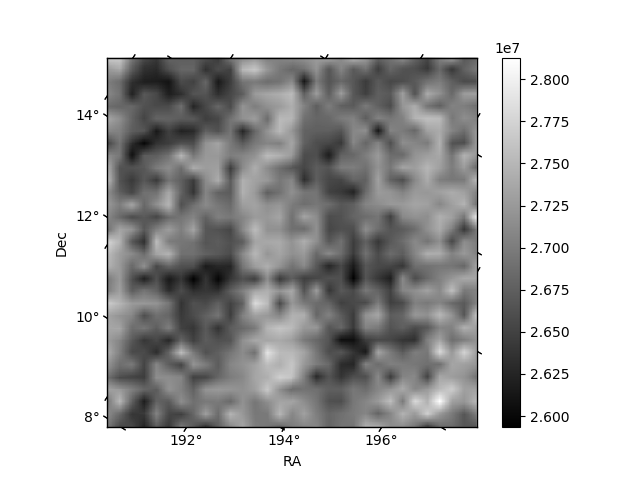
Histogram calculated using DETX and DETY for each event in the final _common_clean file
| Quadrant A | 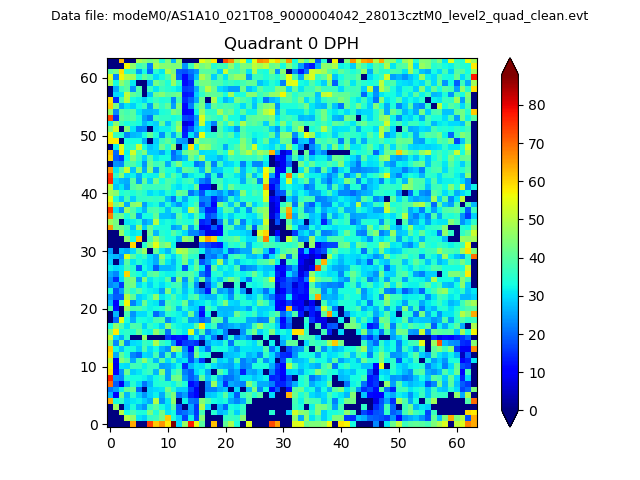 |
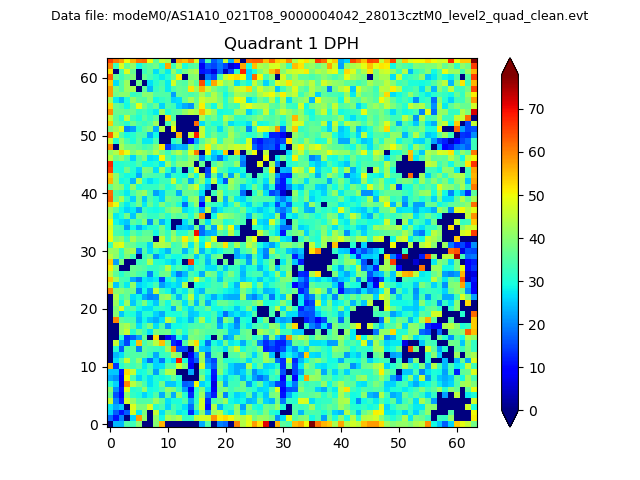 |
Quadrant B |
|---|---|---|---|
| Quadrant D | 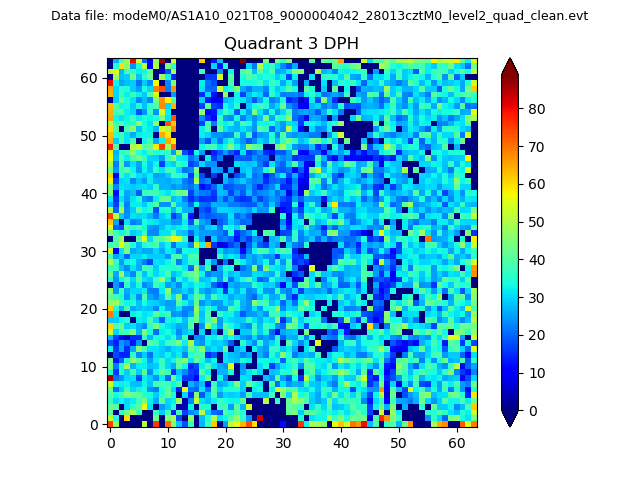 |
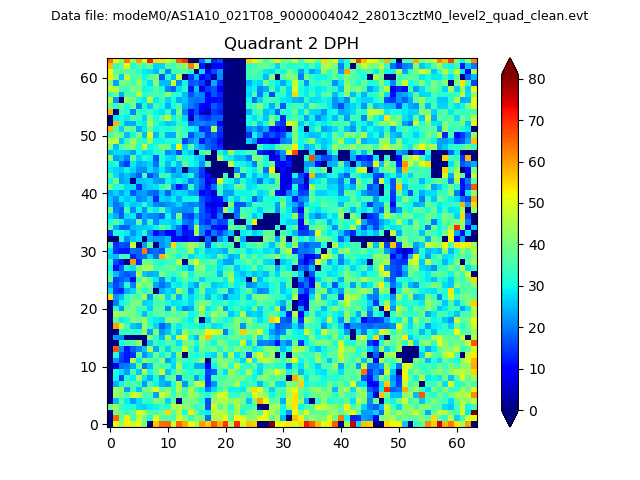 |
Quadrant C |
| Plot type | Count rate plots | Images |
|---|---|---|
| Comparison with Poisson distribution Blue bars denote a histogram of data divided into 1 sec bins. Red curve is a Poisson curve with rate = median count rate of data. |
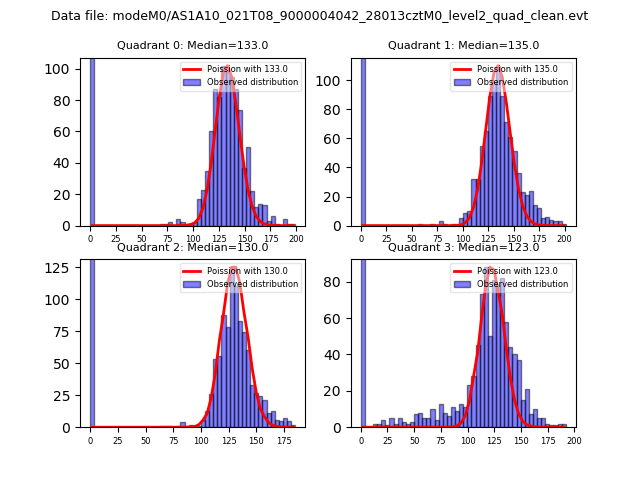 |
 |
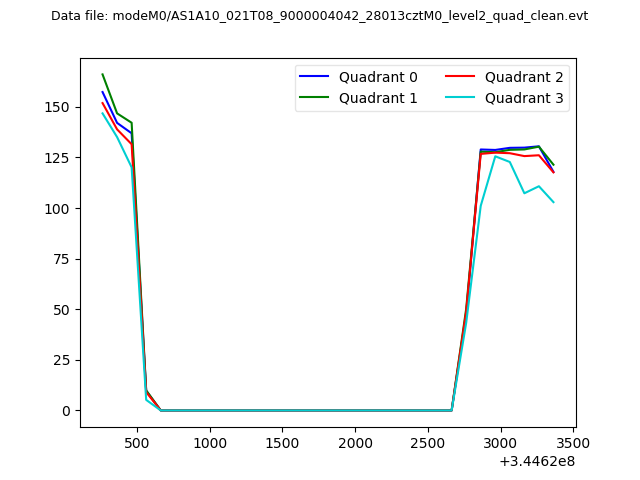
| Quadrant-wise count rates Data is divided into 100 sec bins |
 |
|
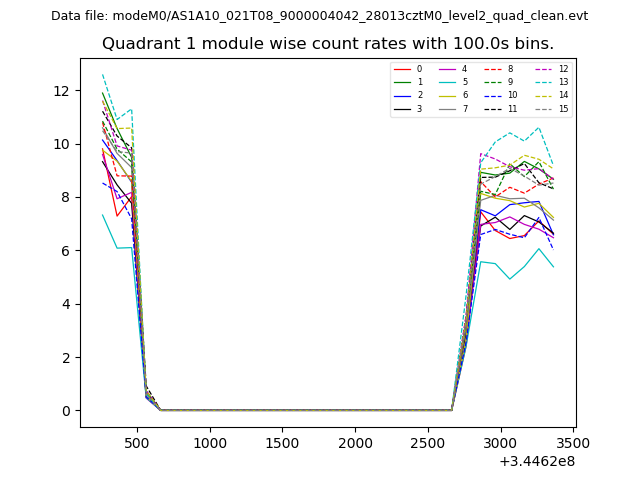
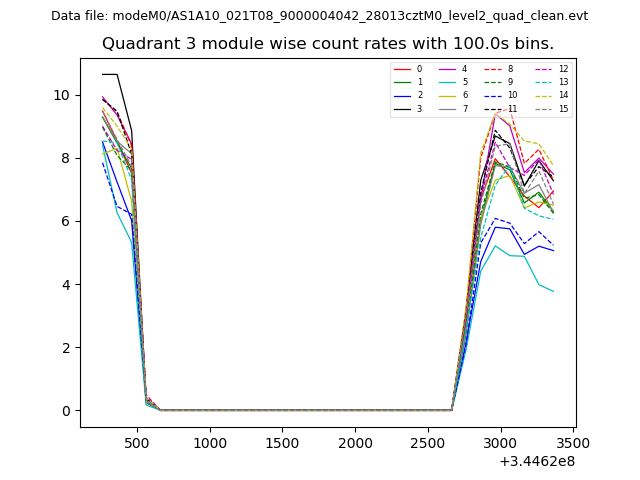
| Module-wise count rates for Quadrant A Data is divided into 100 sec bins |
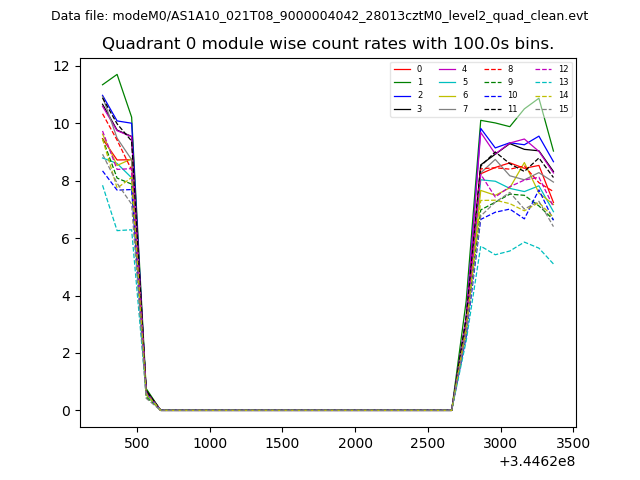 |
 |
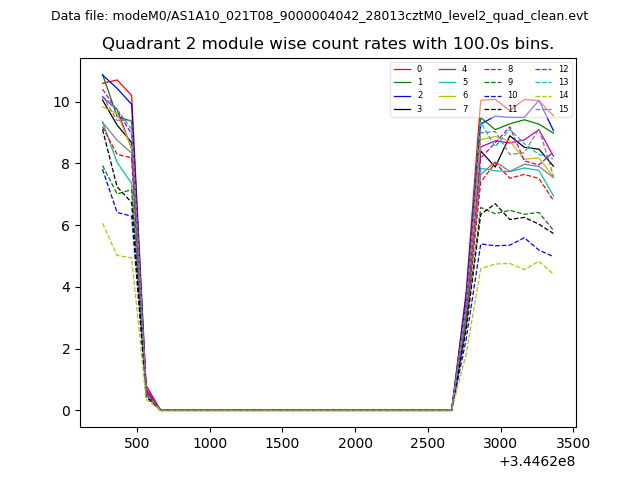
| Module-wise count rates for Quadrant B Data is divided into 100 sec bins |
 |
 |
| Module-wise count rates for Quadrant C Data is divided into 100 sec bins |
 |
 |
| Module-wise count rates for Quadrant D Data is divided into 100 sec bins |
 |
 |
| Parameter | Plot |
|---|---|
| CZT HV Monitor | 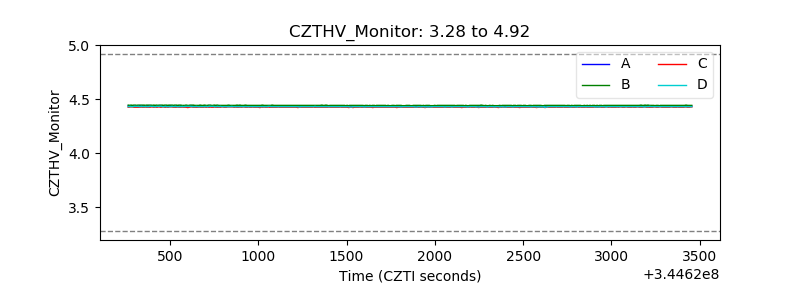 |
| D_VDD | 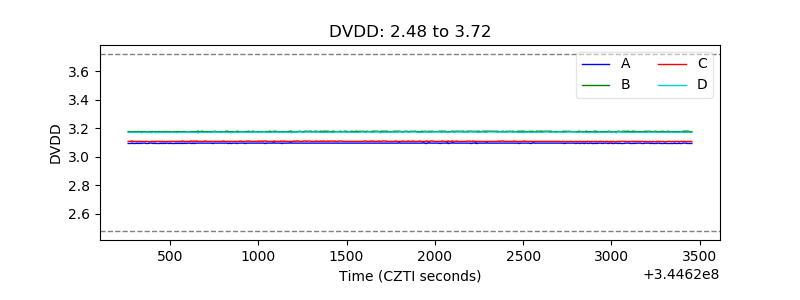 |
| Temperature 1 | 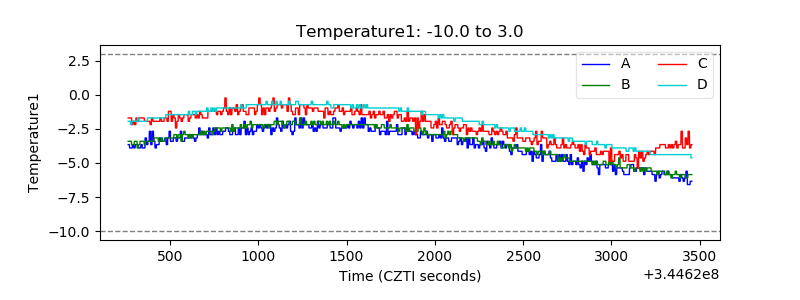 |
| Veto HV Monitor | 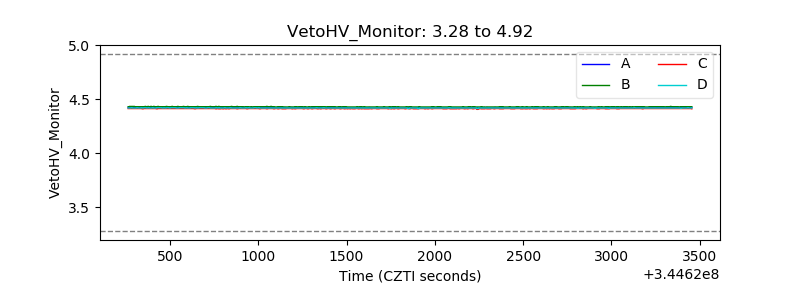 |
| Veto LLD | 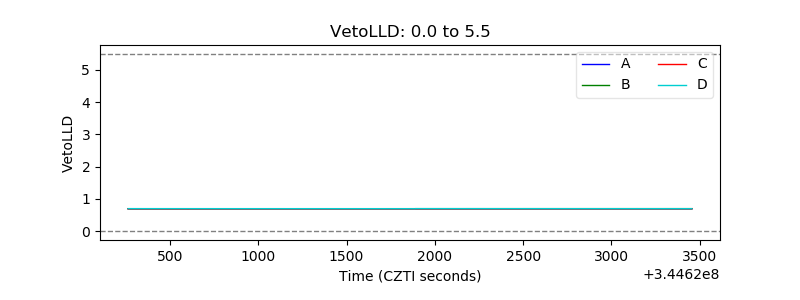 |
| Alpha Counter | 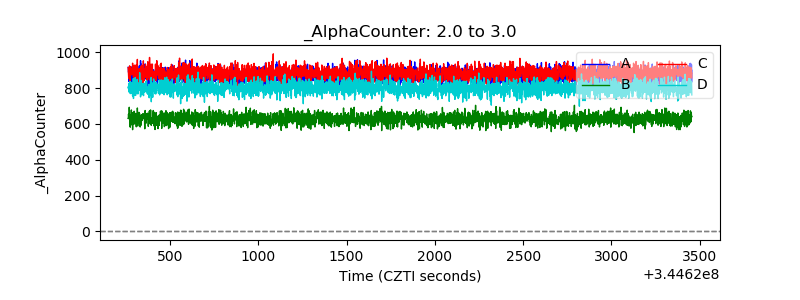 |
| _CPM_Rate | 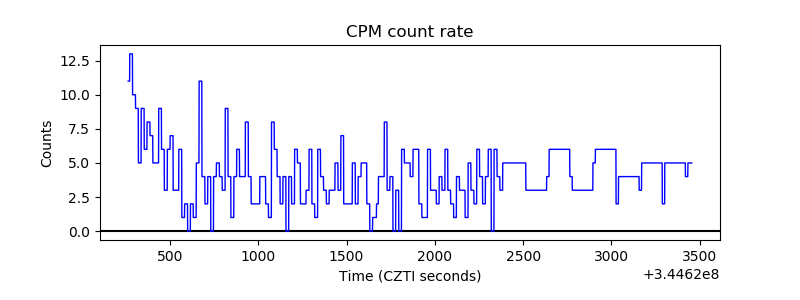 |
| CZT Counter | 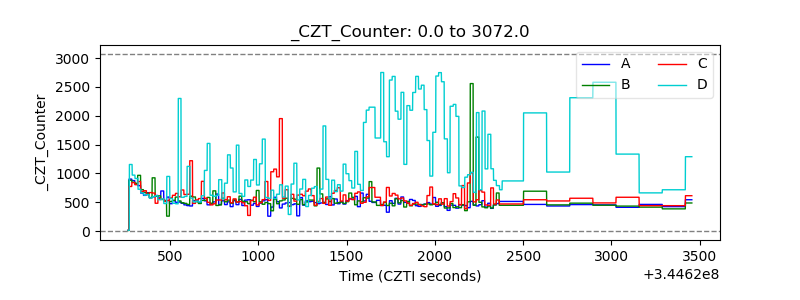 |
| +2.5 Volts monitor |  |
| +5 Volts monitor |  |
| _ROLL_ROT |  |
| _Roll_DEC |  |
| _Roll_RA | 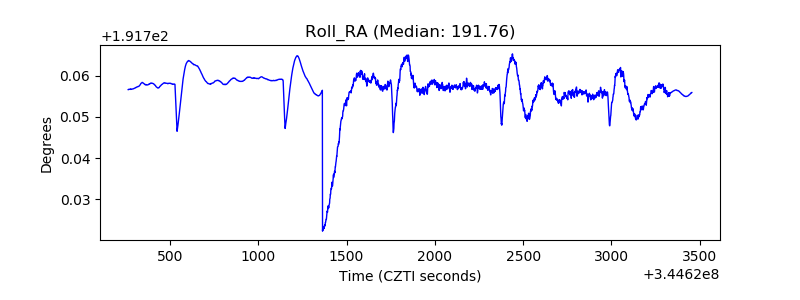 |
| Veto Counter |  |