| Param | Original file | Final file |
|---|---|---|
| Filename | modeM0/AS1A10_021T08_9000004042_28185cztM0_level2.evt | modeM0/AS1A10_021T08_9000004042_28185cztM0_level2_quad_clean.evt |
| Size (bytes) | 72,351,360 | 12,021,120 |
| Size | 69.0 MB | 11.5 MB |
| Events in quadrant A | 495,833 | 71,325 |
| Events in quadrant B | 525,728 | 72,747 |
| Events in quadrant C | 495,685 | 70,530 |
| Events in quadrant D | 596,564 | 65,536 |
| Mode M0 | |||
|---|---|---|---|
| Quadrant | BADHDUFLAG | Total packets | Discarded packets |
| A | 0 | 2125 | 0 |
| B | 0 | 2236 | 0 |
| C | 0 | 2136 | 0 |
| D | 0 | 2427 | 0 |
| Mode M9 | |||
|---|---|---|---|
| Quadrant | BADHDUFLAG | Total packets | Discarded packets |
| A | 0 | 9 | 3 |
| B | 0 | 9 | 4 |
| C | 0 | 9 | 4 |
| D | 0 | 9 | 3 |
| Quadrant | Total seconds | Saturated seconds | Saturation percentage |
|---|---|---|---|
| A | 1033 | 11 | 1.064860% |
| B | 1056 | 29 | 2.746212% |
| C | 1033 | 27 | 2.613746% |
| D | 1014 | 15 | 1.479290% |
Noise dominated data is calculated using 1-second bins in cleaned event files. If a bin has >2000 counts, and if more than 50% of those come from <1% of pixels, then it is considered to be noise-dominated and hence unusable.
| Quadrant | # 1 sec bins | Bins with >0 counts | Bins with >2000 counts | High rate bins dominated by noise | Noise dominated (total time) | Noise dominated (detector-on time) | Marked lightcurve |
|---|---|---|---|---|---|---|---|
| A | 2843 | 1159 | 0 | 0 | 0.00% | 0.00% | 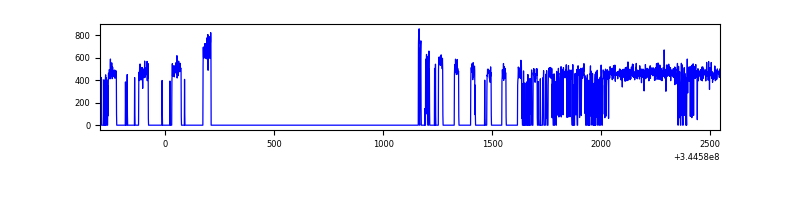 |
| B | 2841 | 1181 | 5 | 5 | 0.18% | 0.42% | 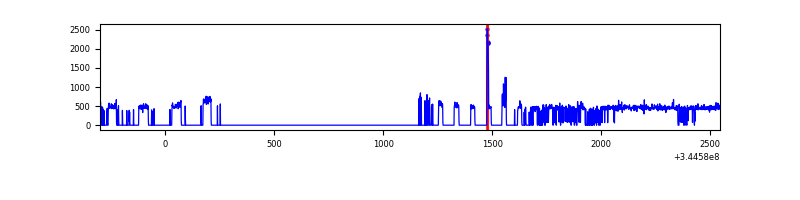 |
| C | 2842 | 1148 | 0 | 0 | 0.00% | 0.00% | 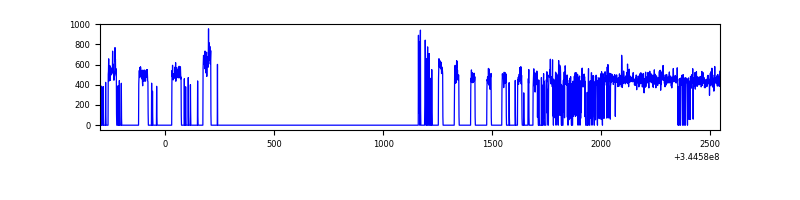 |
| D | 2844 | 1124 | 8 | 8 | 0.28% | 0.71% | 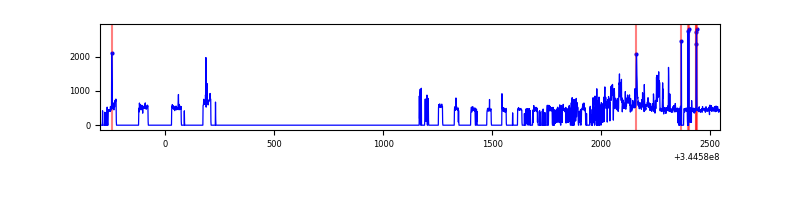 |
Top three noisy pixels from each quadrant. If the there are fewer than three noisy pixels in the level2.evt file, extra rows are filled as -1
| Pixel properties | Quadrant properties | ||||||
|---|---|---|---|---|---|---|---|
| Quadrant | DetID | PixID | Counts | Sigma | Mean | Median | Sigma |
| A | 13 | 254 | 1497 | 49.18 | 127 | 125 | 27.9 |
| A | 3 | 137 | 1258 | 40.61 | 127 | 125 | 27.9 |
| A | 0 | 226 | 1171 | 37.49 | 127 | 125 | 27.9 |
| B | 10 | 245 | 19318 | 708.76 | 128 | 124 | 27.1 |
| B | 12 | 111 | 3099 | 109.86 | 128 | 124 | 27.1 |
| B | 11 | 111 | 2877 | 101.66 | 128 | 124 | 27.1 |
| C | 14 | 238 | 19188 | 640.47 | 119 | 120 | 29.8 |
| C | 3 | 233 | 6294 | 207.38 | 119 | 120 | 29.8 |
| C | 15 | 208 | 2403 | 76.68 | 119 | 120 | 29.8 |
| D | 1 | 52 | 112315 | 3717.13 | 119 | 115 | 30.2 |
| D | 8 | 195 | 19274 | 634.73 | 119 | 115 | 30.2 |
| D | 5 | 222 | 12160 | 399.04 | 119 | 115 | 30.2 |
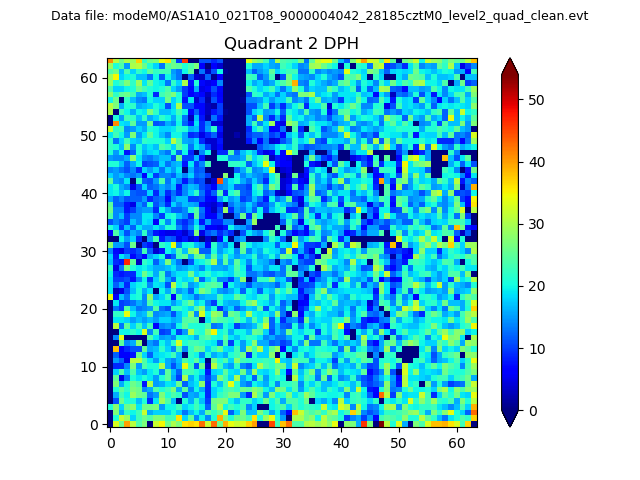
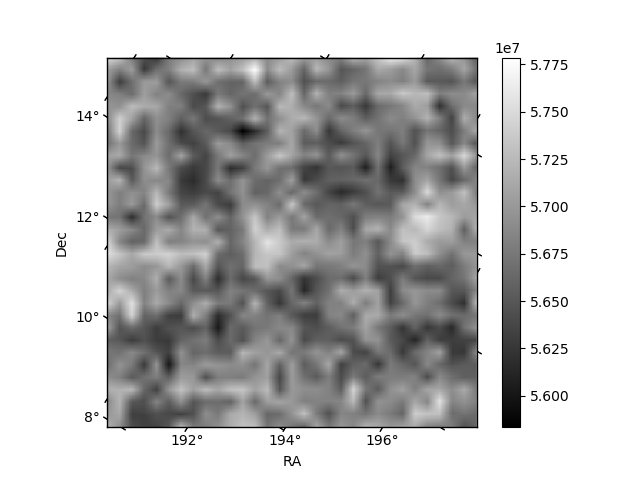
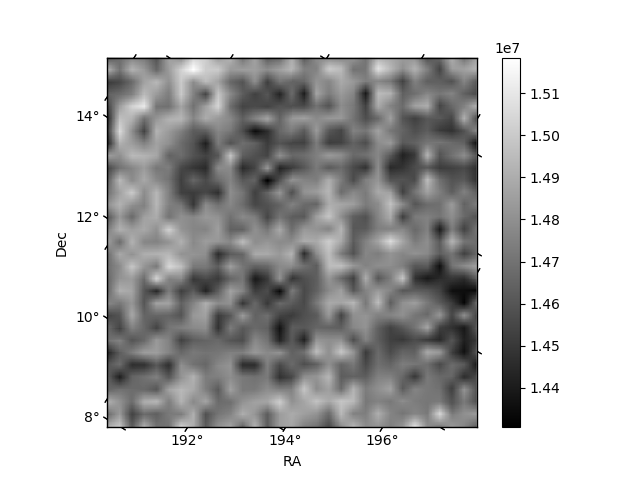
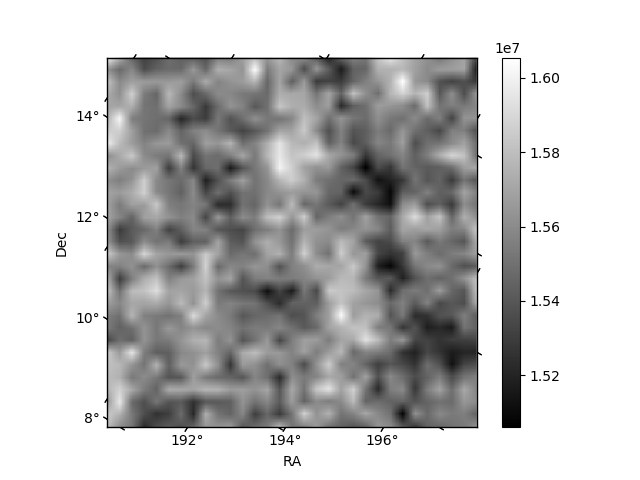
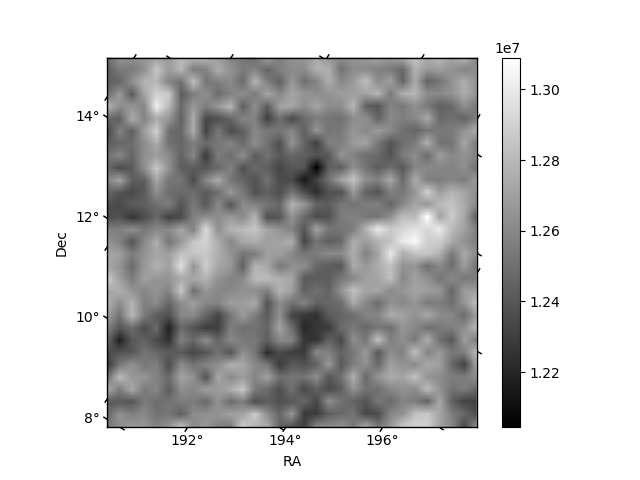
Histogram calculated using DETX and DETY for each event in the final _common_clean file
| Quadrant A | 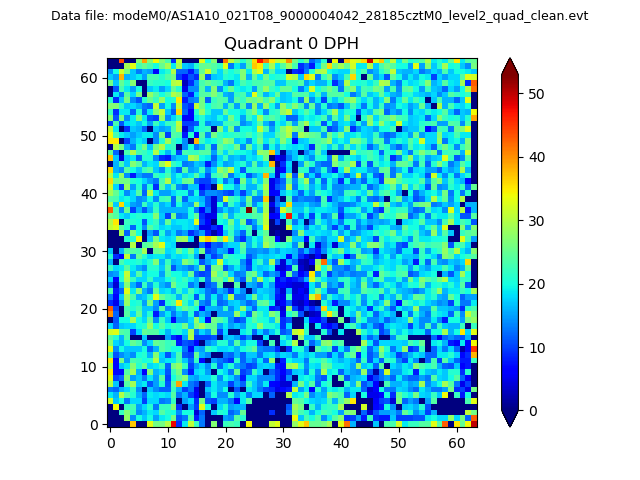 |
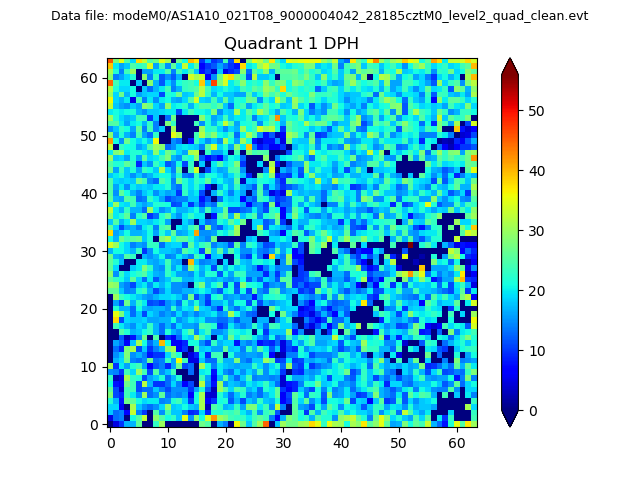 |
Quadrant B |
|---|---|---|---|
| Quadrant D | 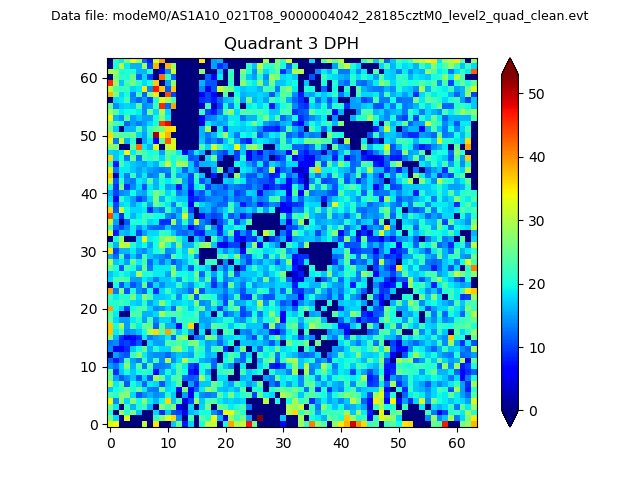 |
 |
Quadrant C |
| Plot type | Count rate plots | Images |
|---|---|---|
| Comparison with Poisson distribution Blue bars denote a histogram of data divided into 1 sec bins. Red curve is a Poisson curve with rate = median count rate of data. |
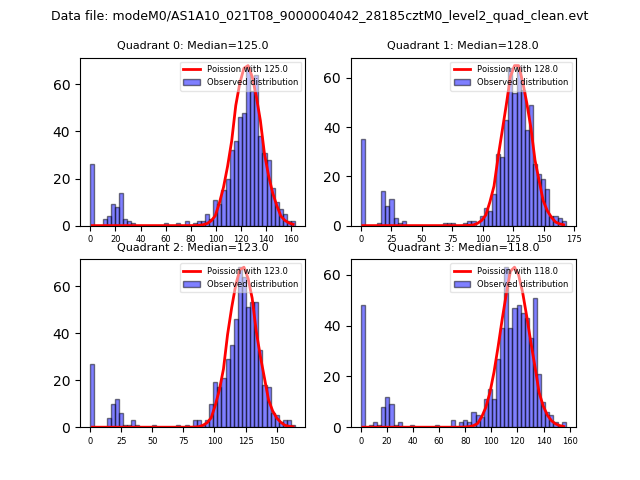 |
 |
| Quadrant-wise count rates Data is divided into 100 sec bins |
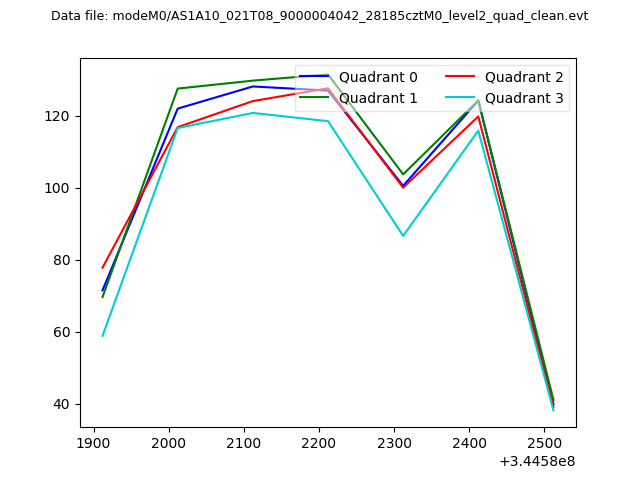 |
|
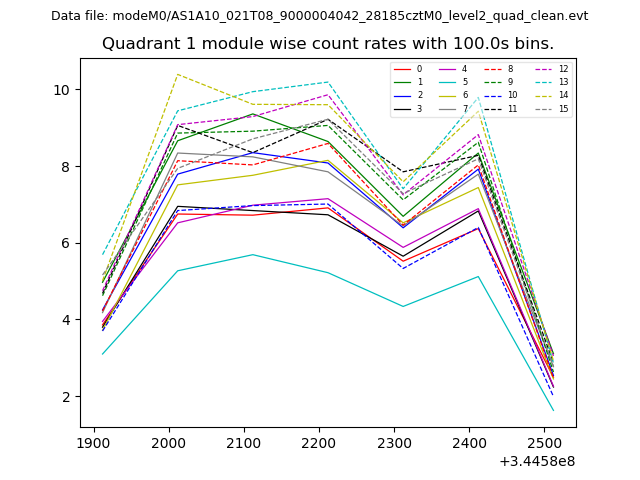
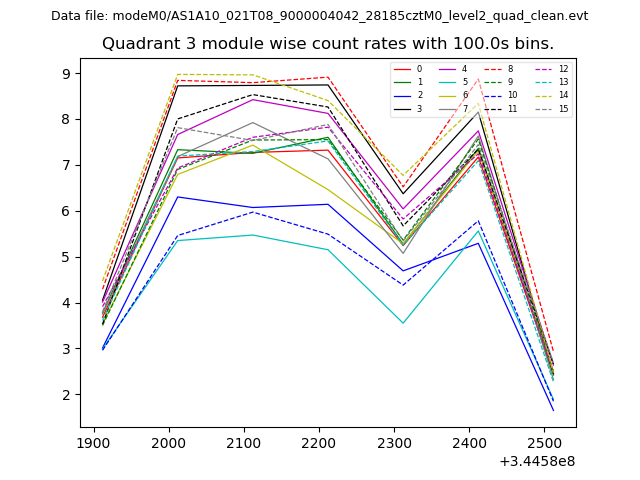
| Module-wise count rates for Quadrant A Data is divided into 100 sec bins |
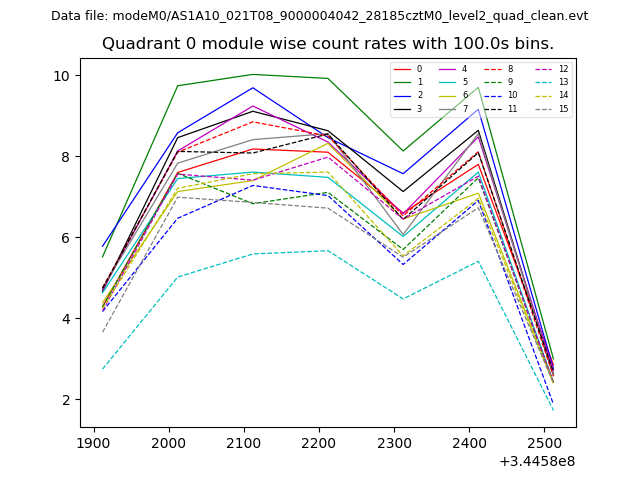 |
 |
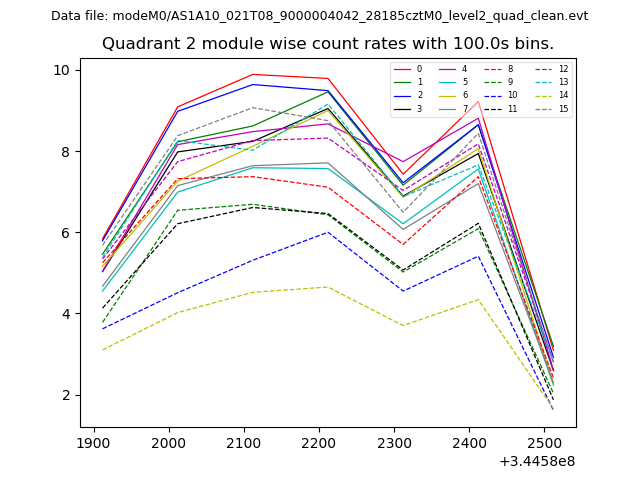
| Module-wise count rates for Quadrant B Data is divided into 100 sec bins |
 |
 |
| Module-wise count rates for Quadrant C Data is divided into 100 sec bins |
 |
 |
| Module-wise count rates for Quadrant D Data is divided into 100 sec bins |
 |
 |
| Parameter | Plot |
|---|---|
| CZT HV Monitor | 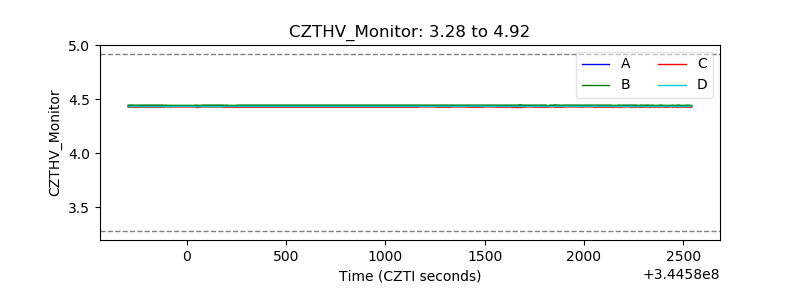 |
| D_VDD |  |
| Temperature 1 | 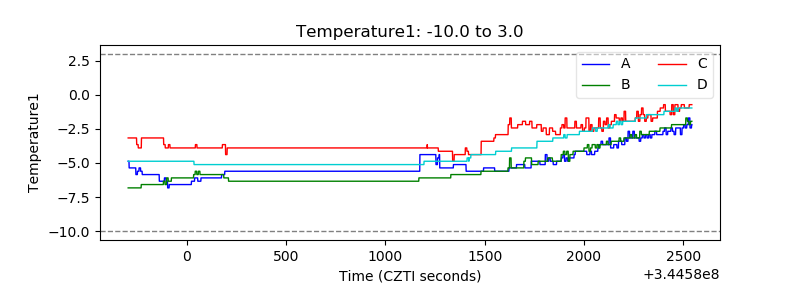 |
| Veto HV Monitor | 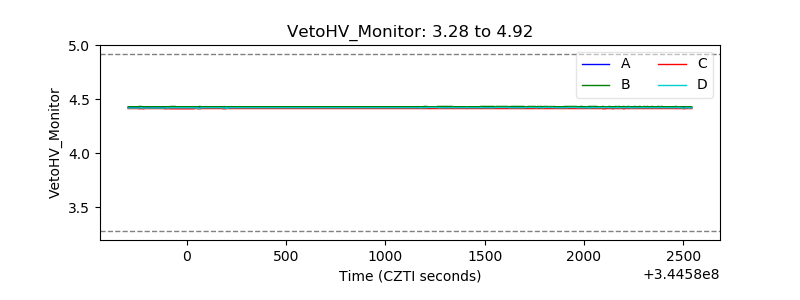 |
| Veto LLD | 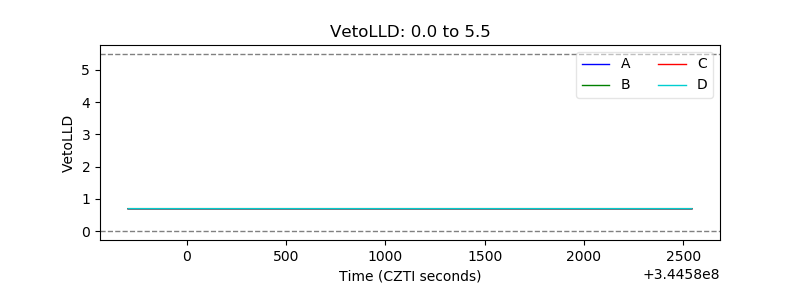 |
| Alpha Counter | 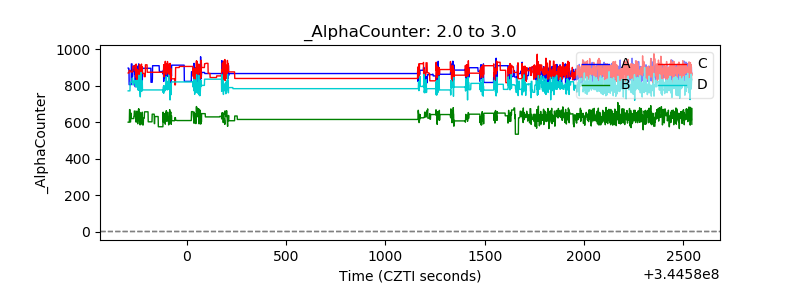 |
| _CPM_Rate | 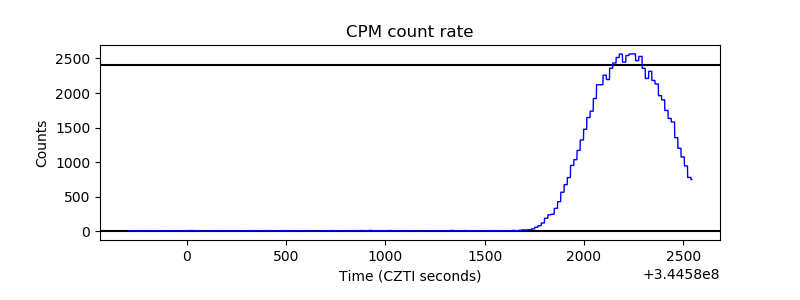 |
| CZT Counter | 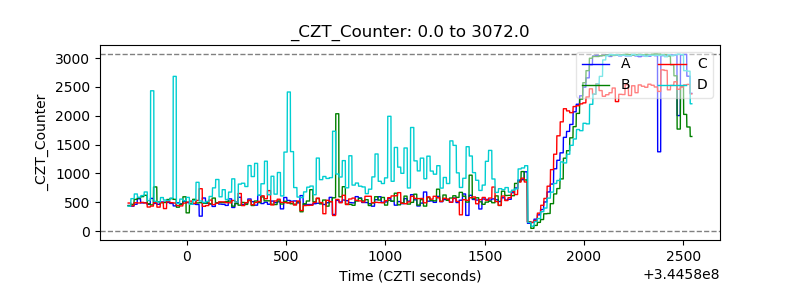 |
| +2.5 Volts monitor |  |
| +5 Volts monitor |  |
| _ROLL_ROT | 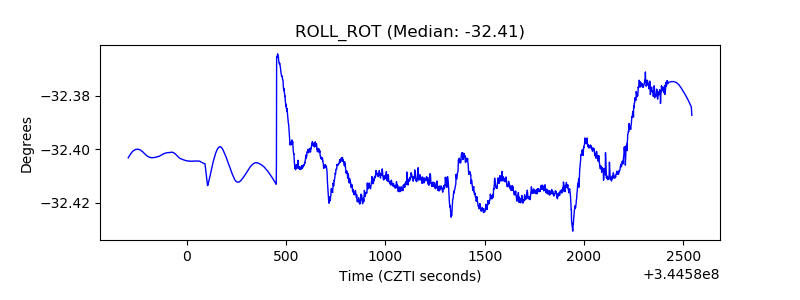 |
| _Roll_DEC | 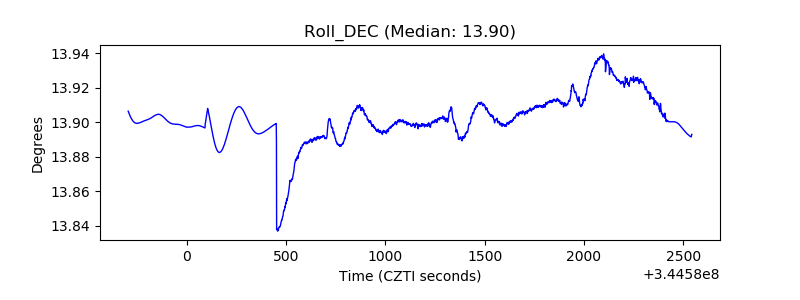 |
| _Roll_RA | 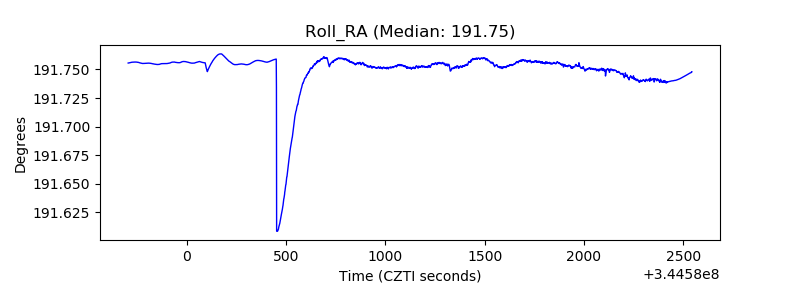 |
| Veto Counter | 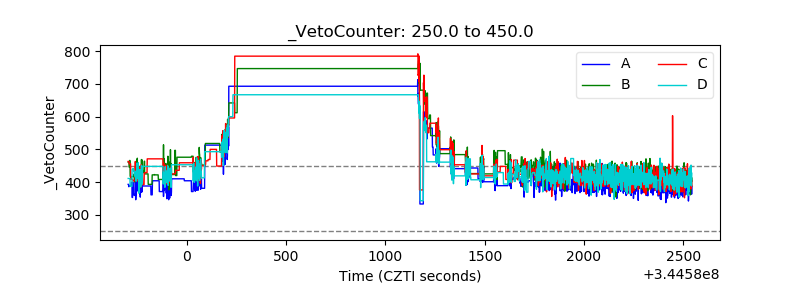 |