| Param | Original file | Final file |
|---|---|---|
| Filename | modeM0/AS1A10_021T08_9000004042_28186cztM0_level2.evt | modeM0/AS1A10_021T08_9000004042_28186cztM0_level2_quad_clean.evt |
| Size (bytes) | 748,647,360 | 91,558,080 |
| Size | 714.0 MB | 87.3 MB |
| Events in quadrant A | 3,486,199 | 622,842 |
| Events in quadrant B | 3,774,604 | 623,530 |
| Events in quadrant C | 3,615,850 | 584,710 |
| Events in quadrant D | 11,300,120 | 430,995 |
| Mode M0 | |||
|---|---|---|---|
| Quadrant | BADHDUFLAG | Total packets | Discarded packets |
| A | 0 | 15069 | 0 |
| B | 0 | 15911 | 0 |
| C | 0 | 15410 | 0 |
| D | 0 | 38432 | 0 |
| Mode M9 | |||
|---|---|---|---|
| Quadrant | BADHDUFLAG | Total packets | Discarded packets |
| A | 0 | 5 | 0 |
| B | 0 | 5 | 0 |
| C | 0 | 5 | 0 |
| D | 0 | 5 | 0 |
| Quadrant | Total seconds | Saturated seconds | Saturation percentage |
|---|---|---|---|
| A | 7317 | 170 | 2.323357% |
| B | 7322 | 225 | 3.072931% |
| C | 7322 | 209 | 2.854411% |
| D | 7309 | 3127 | 42.782870% |
Noise dominated data is calculated using 1-second bins in cleaned event files. If a bin has >2000 counts, and if more than 50% of those come from <1% of pixels, then it is considered to be noise-dominated and hence unusable.
| Quadrant | # 1 sec bins | Bins with >0 counts | Bins with >2000 counts | High rate bins dominated by noise | Noise dominated (total time) | Noise dominated (detector-on time) | Marked lightcurve |
|---|---|---|---|---|---|---|---|
| A | 7833 | 7334 | 0 | 0 | 0.00% | 0.00% | 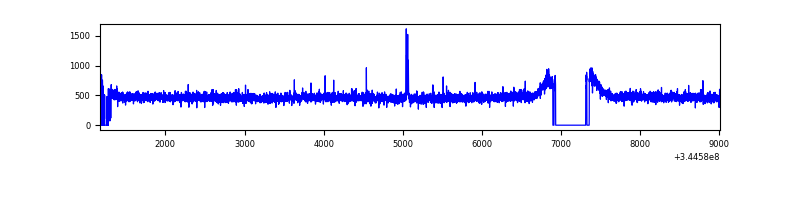 |
| B | 7833 | 7337 | 19 | 19 | 0.24% | 0.26% | 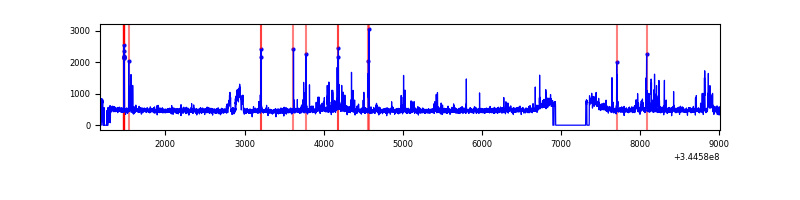 |
| C | 7834 | 7339 | 4 | 4 | 0.05% | 0.05% | 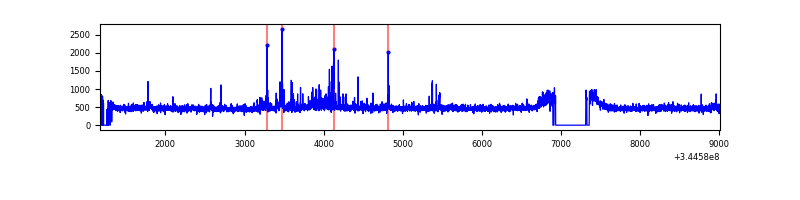 |
| D | 7832 | 7323 | 2936 | 2936 | 37.49% | 40.09% | 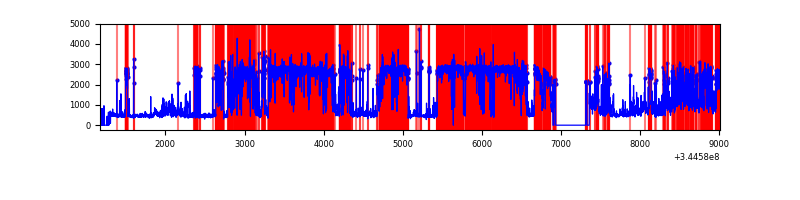 |
Top three noisy pixels from each quadrant. If the there are fewer than three noisy pixels in the level2.evt file, extra rows are filled as -1
| Pixel properties | Quadrant properties | ||||||
|---|---|---|---|---|---|---|---|
| Quadrant | DetID | PixID | Counts | Sigma | Mean | Median | Sigma |
| A | 15 | 174 | 21017 | 111.8 | 896 | 876 | 180.1 |
| A | 13 | 254 | 11141 | 56.98 | 896 | 876 | 180.1 |
| A | 3 | 137 | 8658 | 43.2 | 896 | 876 | 180.1 |
| B | 10 | 246 | 86817 | 510.54 | 880 | 856 | 168.4 |
| B | 15 | 32 | 80395 | 472.4 | 880 | 856 | 168.4 |
| B | 12 | 17 | 40891 | 237.78 | 880 | 856 | 168.4 |
| C | 14 | 238 | 134694 | 678.64 | 844 | 849 | 197.2 |
| C | 3 | 233 | 121922 | 613.89 | 844 | 849 | 197.2 |
| C | 15 | 208 | 64945 | 324.99 | 844 | 849 | 197.2 |
| D | 1 | 52 | 7720189 | 49444.62 | 648 | 629 | 156.1 |
| D | 7 | 80 | 609256 | 3898.32 | 648 | 629 | 156.1 |
| D | 5 | 222 | 165646 | 1056.95 | 648 | 629 | 156.1 |
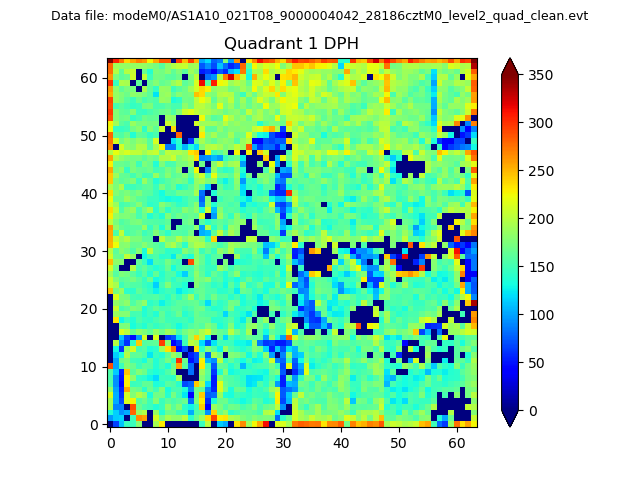
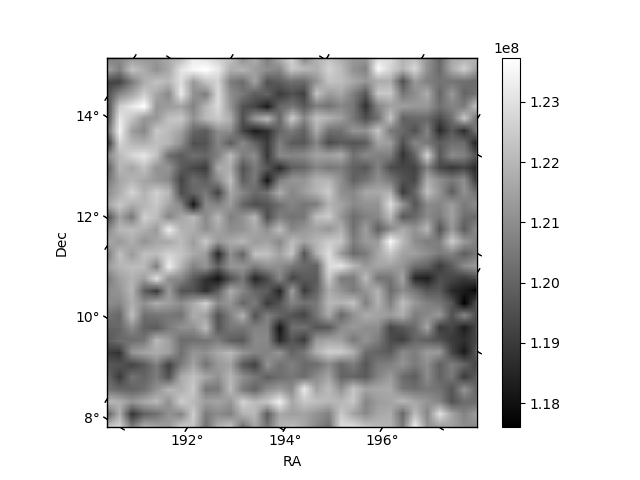
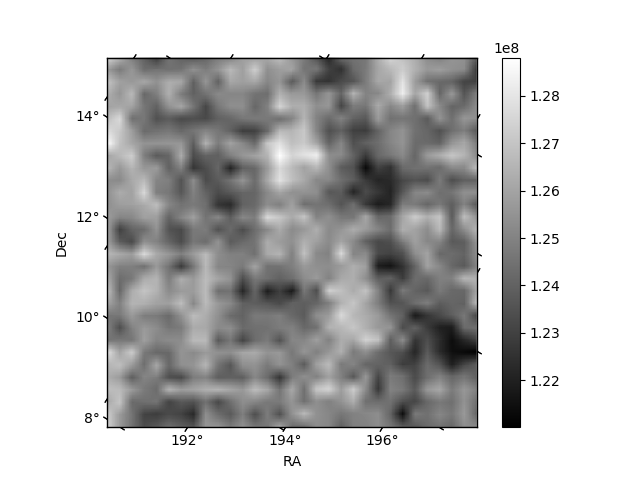
Histogram calculated using DETX and DETY for each event in the final _common_clean file
| Quadrant A |  |
 |
Quadrant B |
|---|---|---|---|
| Quadrant D | 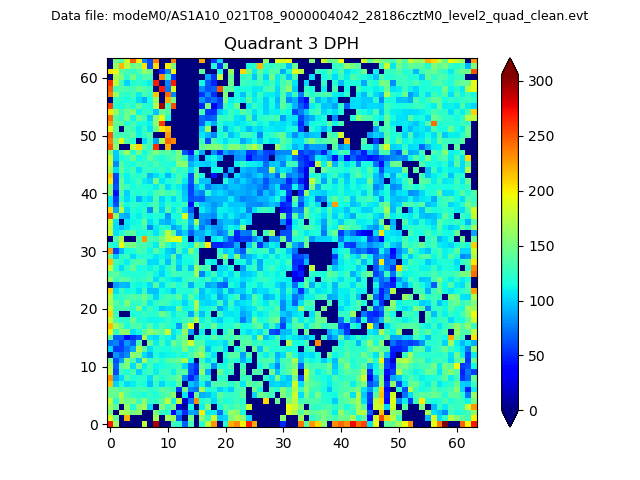 |
 |
Quadrant C |
| Plot type | Count rate plots | Images |
|---|---|---|
| Comparison with Poisson distribution Blue bars denote a histogram of data divided into 1 sec bins. Red curve is a Poisson curve with rate = median count rate of data. |
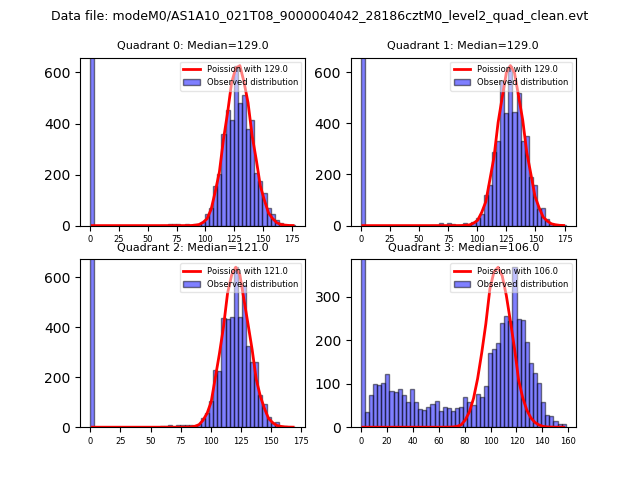 |
 |
| Quadrant-wise count rates Data is divided into 100 sec bins |
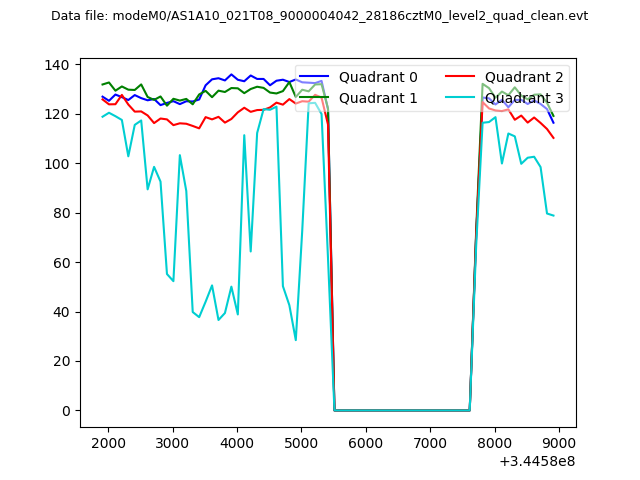 |
|
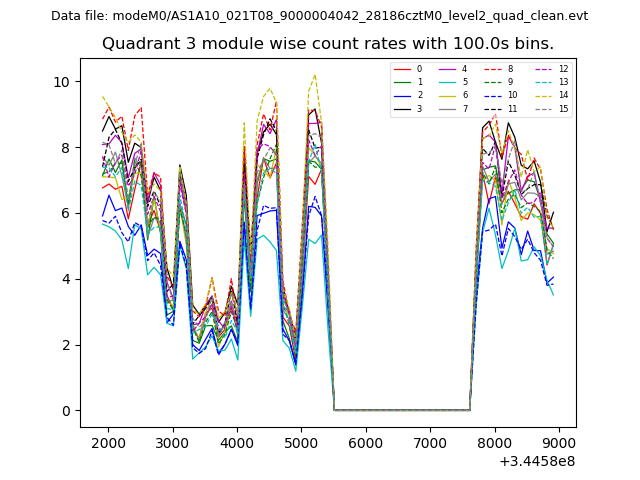
| Module-wise count rates for Quadrant A Data is divided into 100 sec bins |
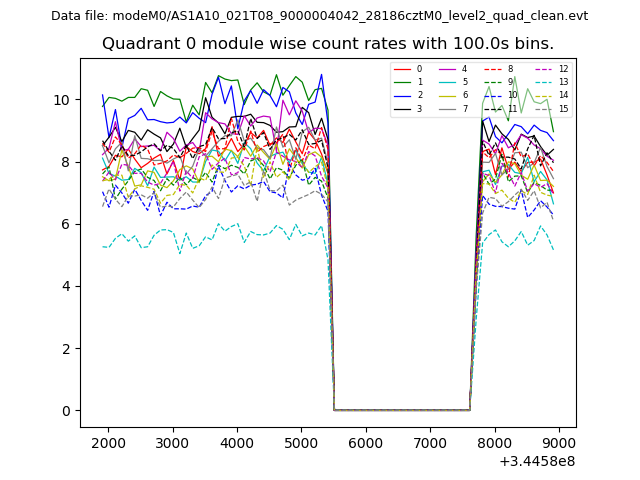 |
 |
| Module-wise count rates for Quadrant B Data is divided into 100 sec bins |
 |
 |
| Module-wise count rates for Quadrant C Data is divided into 100 sec bins |
 |
 |
| Module-wise count rates for Quadrant D Data is divided into 100 sec bins |
 |
 |
| Parameter | Plot |
|---|---|
| CZT HV Monitor | 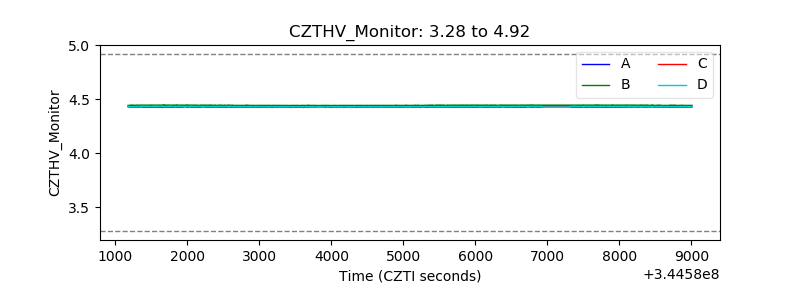 |
| D_VDD | 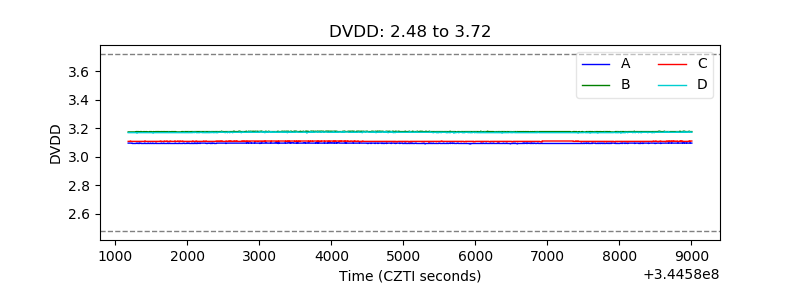 |
| Temperature 1 | 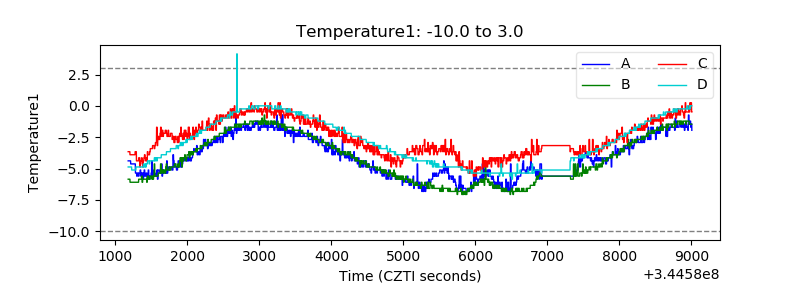 |
| Veto HV Monitor | 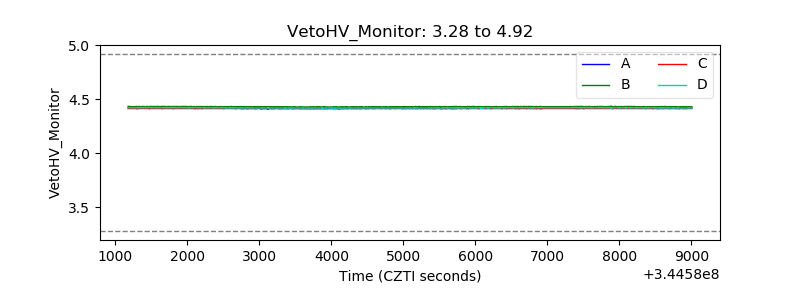 |
| Veto LLD | 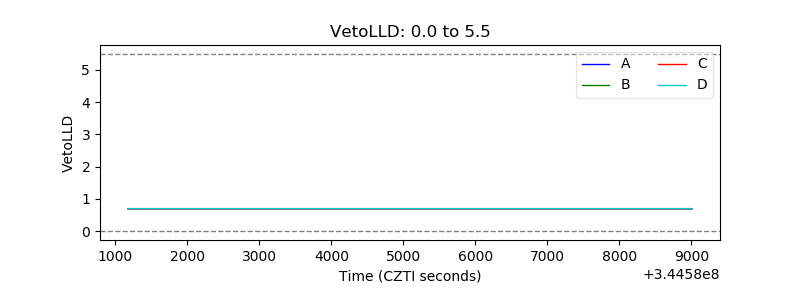 |
| Alpha Counter |  |
| _CPM_Rate | 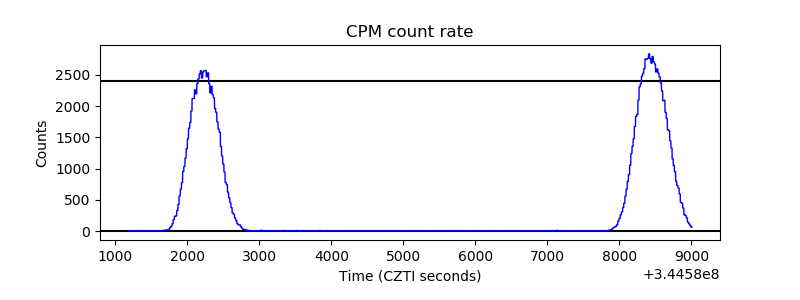 |
| CZT Counter | 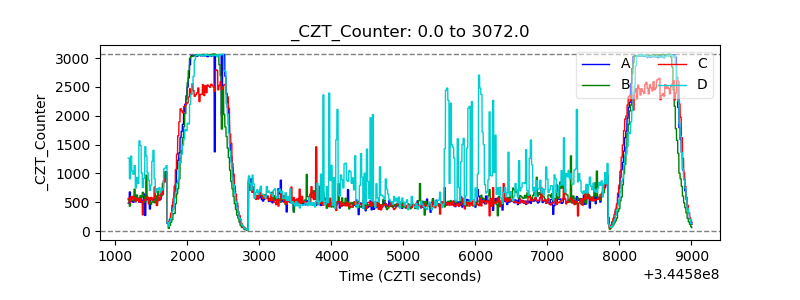 |
| +2.5 Volts monitor |  |
| +5 Volts monitor |  |
| _ROLL_ROT | 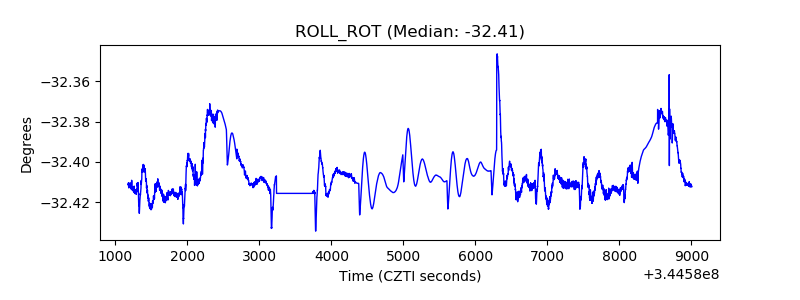 |
| _Roll_DEC | 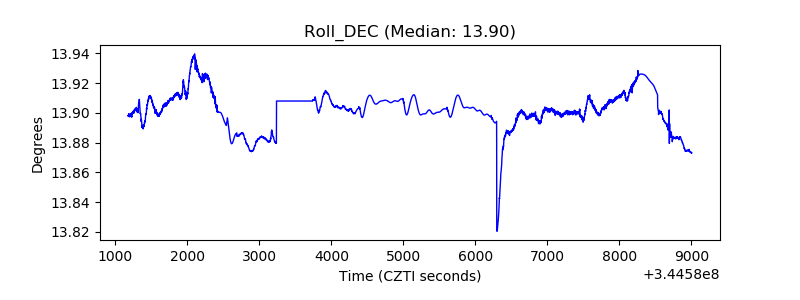 |
| _Roll_RA |  |
| Veto Counter | 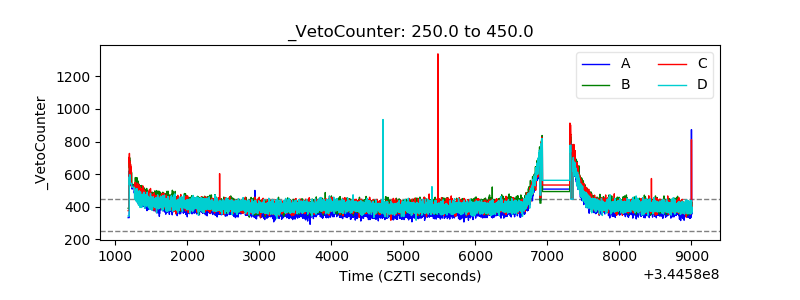 |