| Param | Original file | Final file |
|---|---|---|
| Filename | modeM0/AS1A10_021T01_9000004044cztM0_level2.fits | modeM0/AS1A10_021T01_9000004044cztM0_level2_quad_clean.evt |
| Size (bytes) | 239,060,160 | 220,014,720 |
| Size | 228.0 MB | 209.8 MB |
| Events in quadrant A | 1,464,788 | 1,320,385 |
| Events in quadrant B | 1,409,522 | 1,301,262 |
| Events in quadrant C | 1,427,350 | 1,216,820 |
| Events in quadrant D | 1,229,988 | 1,115,934 |
| Mode M9 | |||
|---|---|---|---|
| Quadrant | BADHDUFLAG | Total packets | Discarded packets |
| A | 0 | 15 | 0 |
| B | 0 | 15 | 0 |
| C | 0 | 15 | 0 |
| D | 0 | 15 | 0 |
| Mode SS | |||
|---|---|---|---|
| Quadrant | BADHDUFLAG | Total packets | Discarded packets |
| A | 0 | 508 | 0 |
| B | 0 | 508 | 0 |
| C | 0 | 508 | 0 |
| D | 0 | 508 | 0 |
| Mode M0 | |||
|---|---|---|---|
| Quadrant | BADHDUFLAG | Total packets | Discarded packets |
| A | 0 | 51371 | 0 |
| B | 0 | 51767 | 0 |
| C | 0 | 53022 | 0 |
| D | 0 | 73359 | 0 |
| Quadrant | Total seconds | Saturated seconds | Saturation percentage |
|---|---|---|---|
| A | 24831 | 220 | 0.885989% |
| B | 24831 | 370 | 1.490073% |
| C | 24831 | 442 | 1.780033% |
| D | 24831 | 1372 | 5.525351% |
Noise dominated data is calculated using 1-second bins in cleaned event files. If a bin has >2000 counts, and if more than 50% of those come from <1% of pixels, then it is considered to be noise-dominated and hence unusable.
| Quadrant | # 1 sec bins | Bins with >0 counts | Bins with >2000 counts | High rate bins dominated by noise | Noise dominated (total time) | Noise dominated (detector-on time) | Marked lightcurve |
|---|---|---|---|---|---|---|---|
| A | 26131 | 24830 | 0 | 0 | 0.00% | 0.00% |  |
| B | 26130 | 24827 | 0 | 0 | 0.00% | 0.00% |  |
| C | 26130 | 24829 | 0 | 0 | 0.00% | 0.00% |  |
| D | 26131 | 24827 | 0 | 0 | 0.00% | 0.00% |  |
Top three noisy pixels from each quadrant. If the there are fewer than three noisy pixels in the level2.evt file, extra rows are filled as -1
| Pixel properties | Quadrant properties | ||||||
|---|---|---|---|---|---|---|---|
| Quadrant | DetID | PixID | Counts | Sigma | Mean | Median | Sigma |
| A | 0 | 29 | 1175 | 8.53 | 381 | 356 | 96.1 |
| A | 7 | 110 | 1135 | 8.11 | 381 | 356 | 96.1 |
| A | 14 | 79 | 1042 | 7.14 | 381 | 356 | 96.1 |
| B | 2 | 9 | 1138 | 10.38 | 371 | 354 | 75.5 |
| B | 3 | 17 | 958 | 8.0 | 371 | 354 | 75.5 |
| B | 2 | 8 | 919 | 7.48 | 371 | 354 | 75.5 |
| C | 3 | 126 | 996 | 6.56 | 377 | 352 | 98.1 |
| C | 12 | 241 | 995 | 6.55 | 377 | 352 | 98.1 |
| C | 9 | 209 | 968 | 6.28 | 377 | 352 | 98.1 |
| D | 3 | 14 | 917 | 6.28 | 350 | 319 | 95.2 |
| D | 6 | 67 | 876 | 5.85 | 350 | 319 | 95.2 |
| D | 12 | 6 | 869 | 5.77 | 350 | 319 | 95.2 |
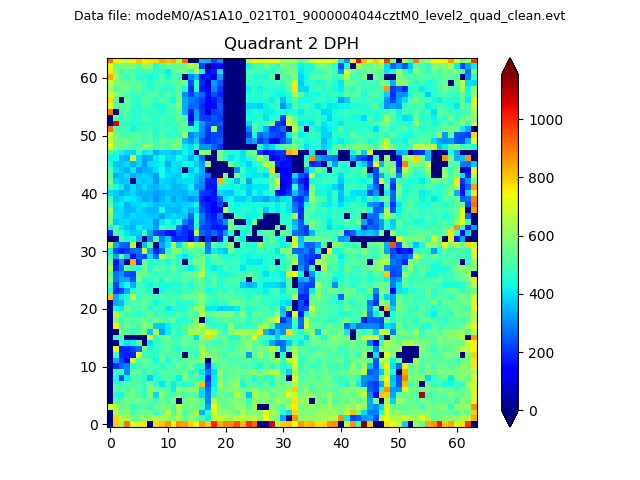
Histogram calculated using DETX and DETY for each event in the final _common_clean file
| Quadrant A | 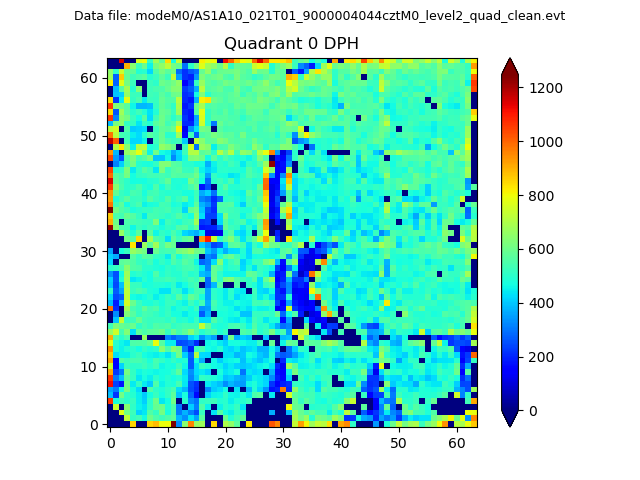 |
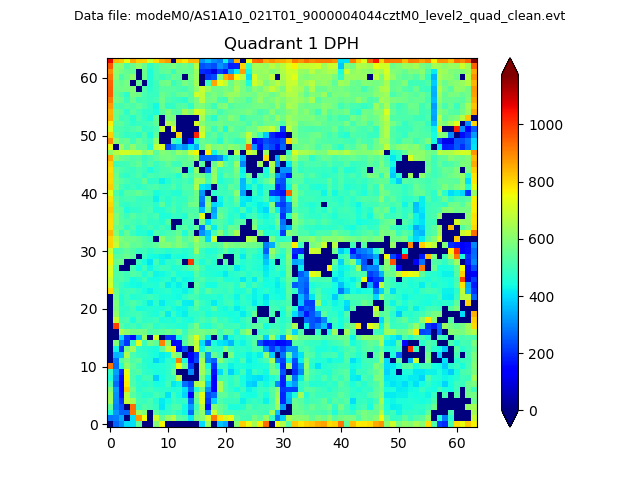 |
Quadrant B |
|---|---|---|---|
| Quadrant D | 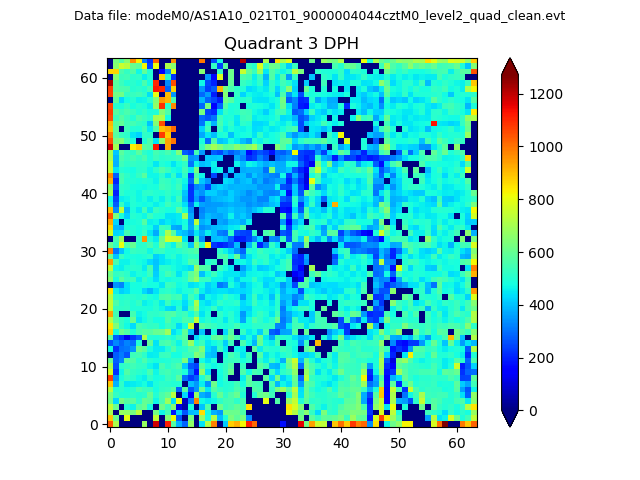 |
 |
Quadrant C |
| Plot type | Count rate plots | Images |
|---|---|---|
| Comparison with Poisson distribution Blue bars denote a histogram of data divided into 1 sec bins. Red curve is a Poisson curve with rate = median count rate of data. |
 |
 |
| Quadrant-wise count rates Data is divided into 100 sec bins |
 |
|
| Module-wise count rates for Quadrant A Data is divided into 100 sec bins |
 |
 |
| Module-wise count rates for Quadrant B Data is divided into 100 sec bins |
 |
 |
| Module-wise count rates for Quadrant C Data is divided into 100 sec bins |
 |
 |
| Module-wise count rates for Quadrant D Data is divided into 100 sec bins |
 |
 |
| Parameter | Plot |
|---|---|
| CZT HV Monitor |  |
| D_VDD | 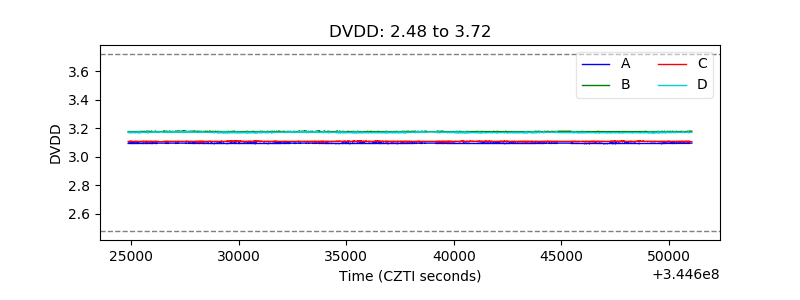 |
| Temperature 1 |  |
| Veto HV Monitor |  |
| Veto LLD |  |
| Alpha Counter |  |
| _CPM_Rate |  |
| CZT Counter |  |
| +2.5 Volts monitor |  |
| +5 Volts monitor |  |
| _ROLL_ROT |  |
| _Roll_DEC |  |
| _Roll_RA |  |
| Veto Counter |  |