| Param | Original file | Final file |
|---|---|---|
| Filename | modeM0/AS1A10_021T01_9000004044_28013cztM0_level2.evt | modeM0/AS1A10_021T01_9000004044_28013cztM0_level2_quad_clean.evt |
| Size (bytes) | 268,672,320 | 34,338,240 |
| Size | 256.2 MB | 32.7 MB |
| Events in quadrant A | 1,575,667 | 215,609 |
| Events in quadrant B | 1,591,587 | 215,383 |
| Events in quadrant C | 1,640,800 | 205,151 |
| Events in quadrant D | 3,127,415 | 193,120 |
| Mode M9 | |||
|---|---|---|---|
| Quadrant | BADHDUFLAG | Total packets | Discarded packets |
| A | 0 | 3 | 0 |
| B | 0 | 3 | 0 |
| C | 0 | 3 | 0 |
| D | 0 | 3 | 0 |
| Mode M0 | |||
|---|---|---|---|
| Quadrant | BADHDUFLAG | Total packets | Discarded packets |
| A | 0 | 6398 | 0 |
| B | 0 | 6471 | 0 |
| C | 0 | 6869 | 0 |
| D | 0 | 11354 | 0 |
| Quadrant | Total seconds | Saturated seconds | Saturation percentage |
|---|---|---|---|
| A | 2949 | 53 | 1.797219% |
| B | 2949 | 84 | 2.848423% |
| C | 2949 | 87 | 2.950153% |
| D | 2948 | 314 | 10.651289% |
Noise dominated data is calculated using 1-second bins in cleaned event files. If a bin has >2000 counts, and if more than 50% of those come from <1% of pixels, then it is considered to be noise-dominated and hence unusable.
| Quadrant | # 1 sec bins | Bins with >0 counts | Bins with >2000 counts | High rate bins dominated by noise | Noise dominated (total time) | Noise dominated (detector-on time) | Marked lightcurve |
|---|---|---|---|---|---|---|---|
| A | 3204 | 2950 | 1 | 1 | 0.03% | 0.03% | 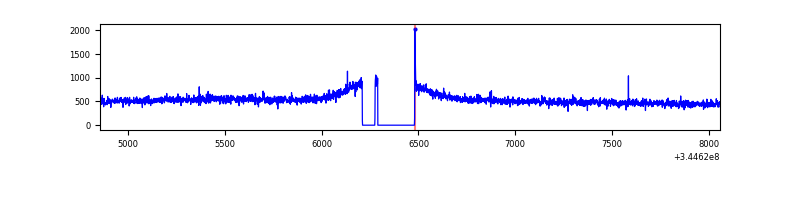 |
| B | 3204 | 2950 | 2 | 2 | 0.06% | 0.07% | 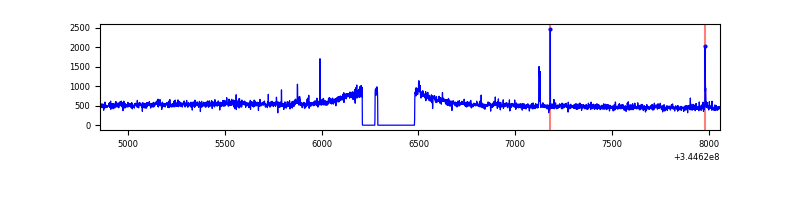 |
| C | 3204 | 2950 | 0 | 0 | 0.00% | 0.00% | 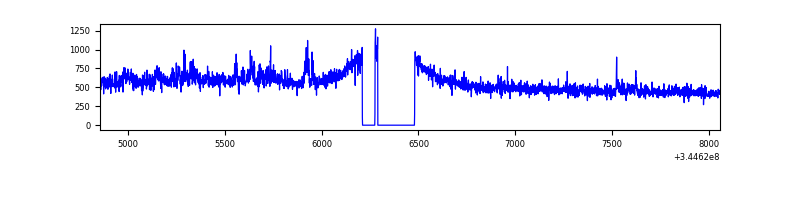 |
| D | 3203 | 2950 | 201 | 201 | 6.28% | 6.81% | 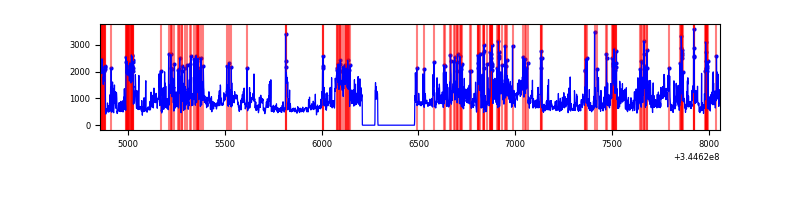 |
Top three noisy pixels from each quadrant. If the there are fewer than three noisy pixels in the level2.evt file, extra rows are filled as -1
| Pixel properties | Quadrant properties | ||||||
|---|---|---|---|---|---|---|---|
| Quadrant | DetID | PixID | Counts | Sigma | Mean | Median | Sigma |
| A | 0 | 13 | 8624 | 98.18 | 405 | 396 | 83.8 |
| A | 13 | 254 | 4724 | 51.65 | 405 | 396 | 83.8 |
| A | 8 | 192 | 4529 | 49.32 | 405 | 396 | 83.8 |
| B | 4 | 200 | 11486 | 140.0 | 397 | 386 | 79.3 |
| B | 12 | 111 | 10052 | 121.92 | 397 | 386 | 79.3 |
| B | 0 | 190 | 9909 | 120.11 | 397 | 386 | 79.3 |
| C | 3 | 233 | 99112 | 1082.56 | 380 | 381 | 91.2 |
| C | 14 | 238 | 60656 | 660.9 | 380 | 381 | 91.2 |
| C | 13 | 61 | 2576 | 24.07 | 380 | 381 | 91.2 |
| D | 1 | 52 | 1011535 | 10927.98 | 377 | 365 | 92.5 |
| D | 7 | 80 | 442636 | 4779.74 | 377 | 365 | 92.5 |
| D | 8 | 195 | 145504 | 1568.56 | 377 | 365 | 92.5 |
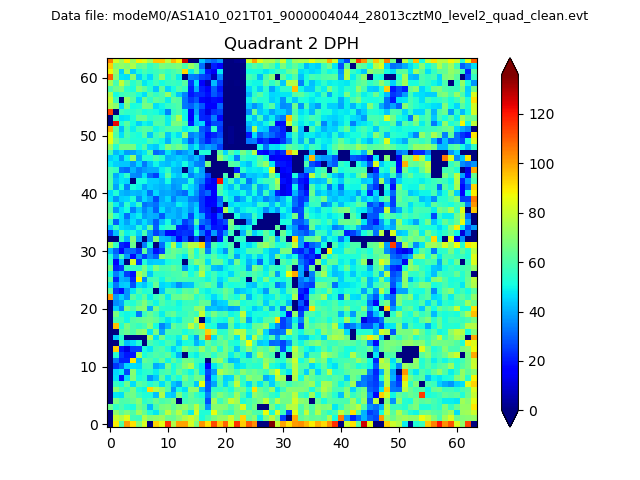
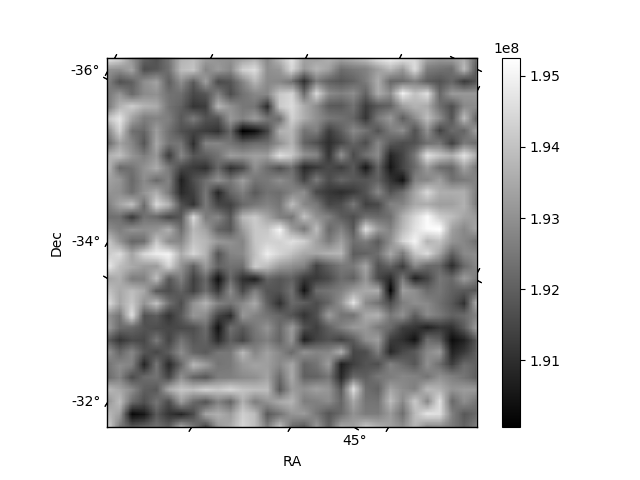
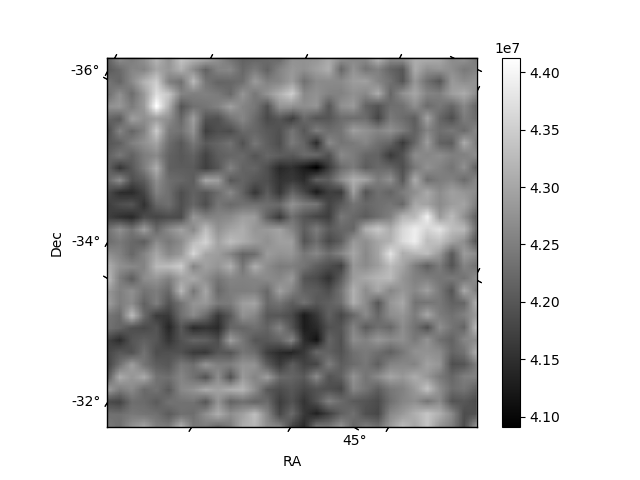
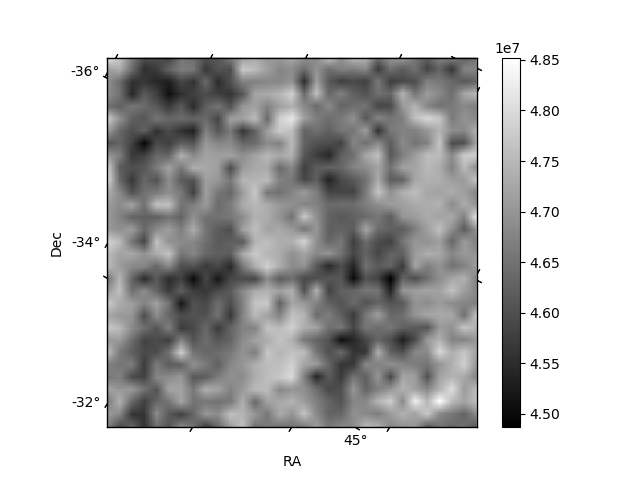
Histogram calculated using DETX and DETY for each event in the final _common_clean file
| Quadrant A | 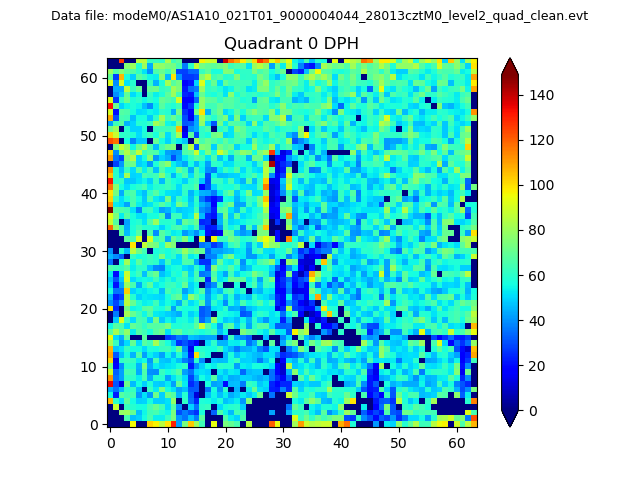 |
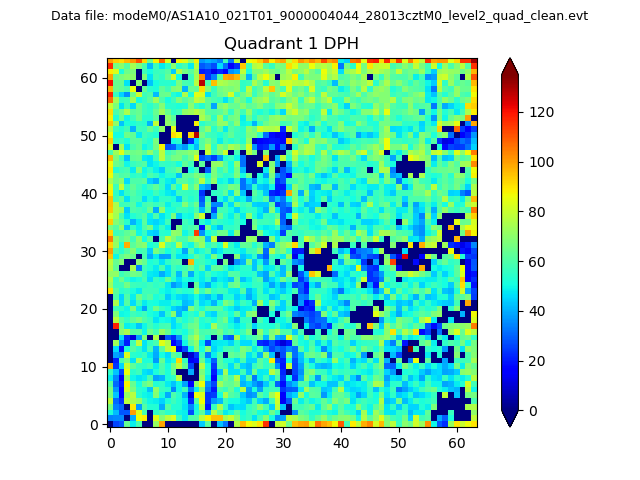 |
Quadrant B |
|---|---|---|---|
| Quadrant D | 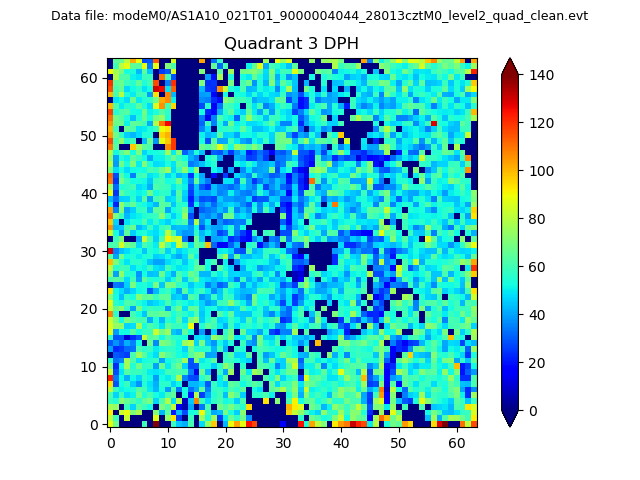 |
 |
Quadrant C |
| Plot type | Count rate plots | Images |
|---|---|---|
| Comparison with Poisson distribution Blue bars denote a histogram of data divided into 1 sec bins. Red curve is a Poisson curve with rate = median count rate of data. |
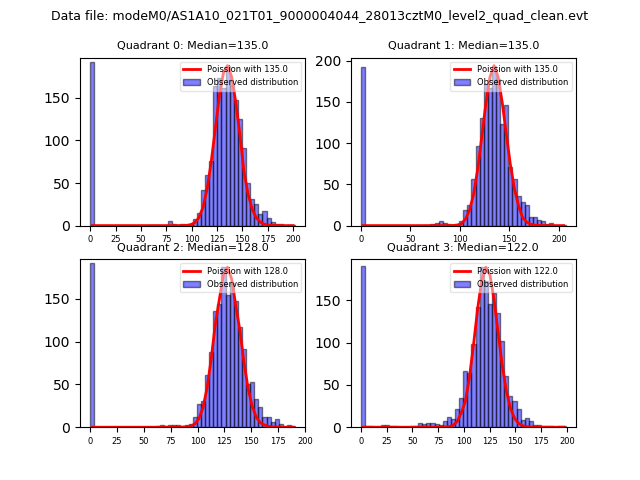 |
 |
| Quadrant-wise count rates Data is divided into 100 sec bins |
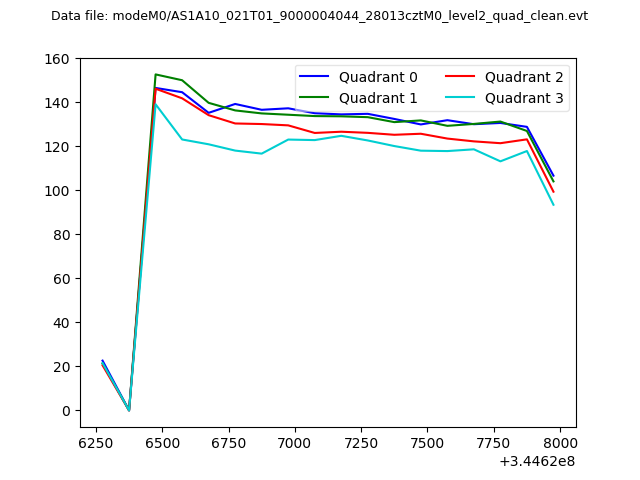 |
|
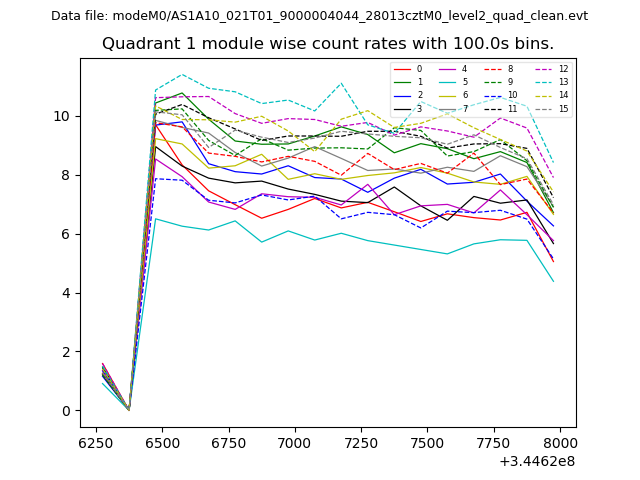
| Module-wise count rates for Quadrant A Data is divided into 100 sec bins |
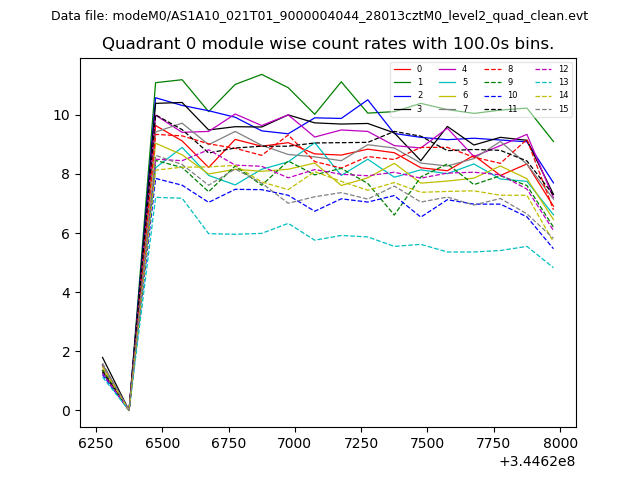 |
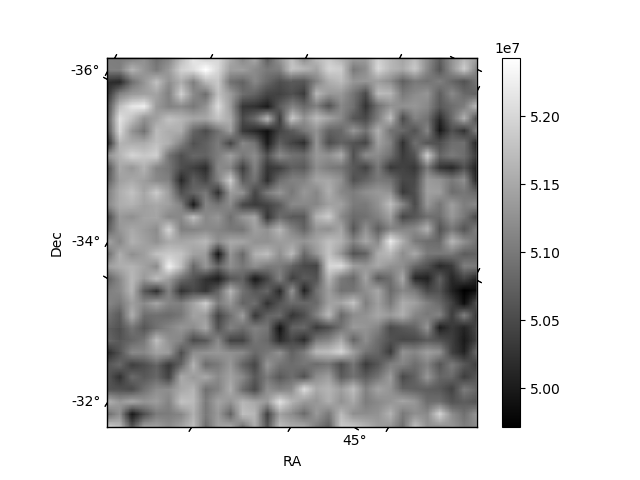 |
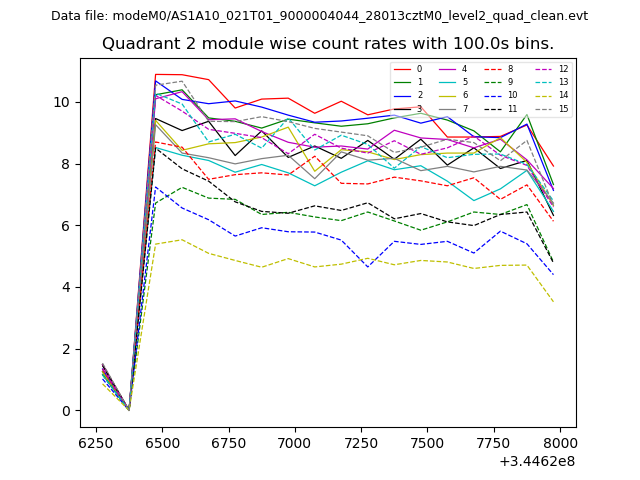
| Module-wise count rates for Quadrant B Data is divided into 100 sec bins |
 |
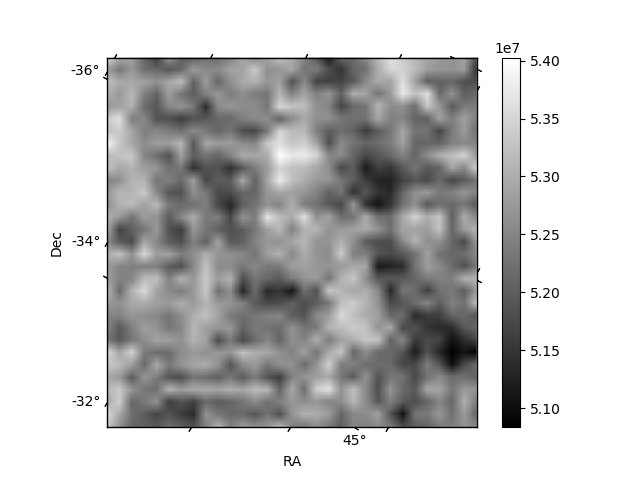 |
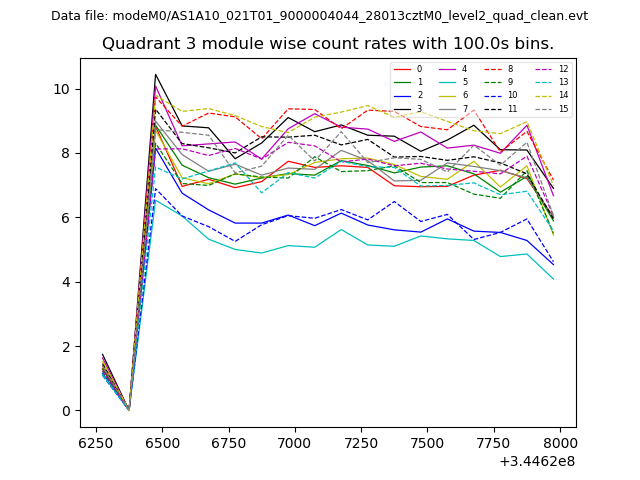
| Module-wise count rates for Quadrant C Data is divided into 100 sec bins |
 |
 |
| Module-wise count rates for Quadrant D Data is divided into 100 sec bins |
 |
 |
| Parameter | Plot |
|---|---|
| CZT HV Monitor | 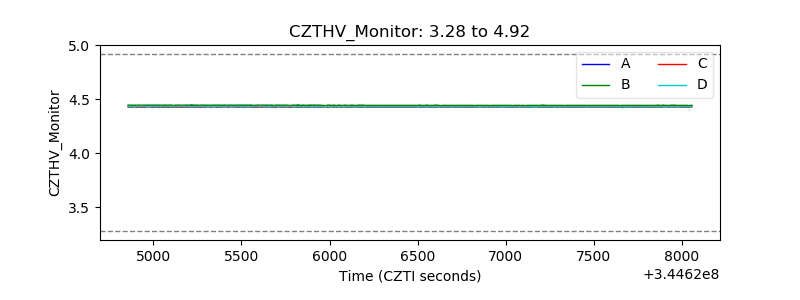 |
| D_VDD | 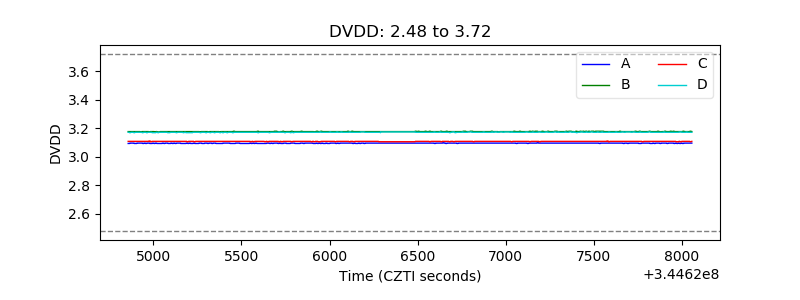 |
| Temperature 1 |  |
| Veto HV Monitor |  |
| Veto LLD | 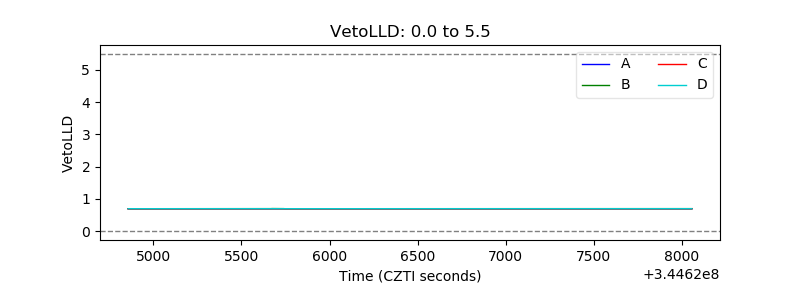 |
| Alpha Counter | 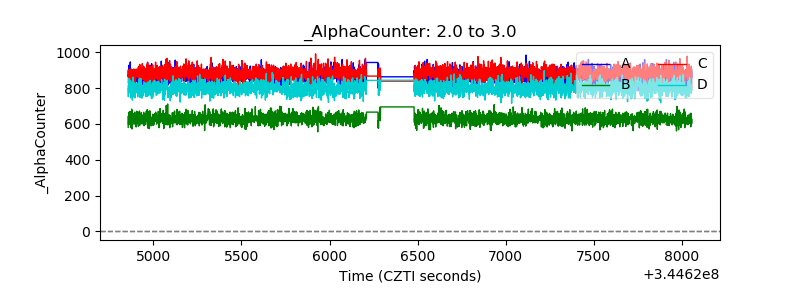 |
| _CPM_Rate | 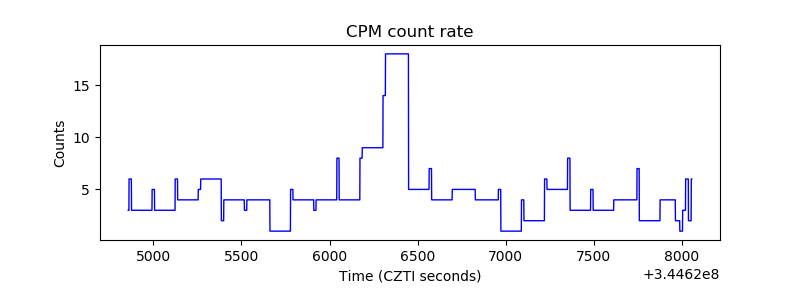 |
| CZT Counter | 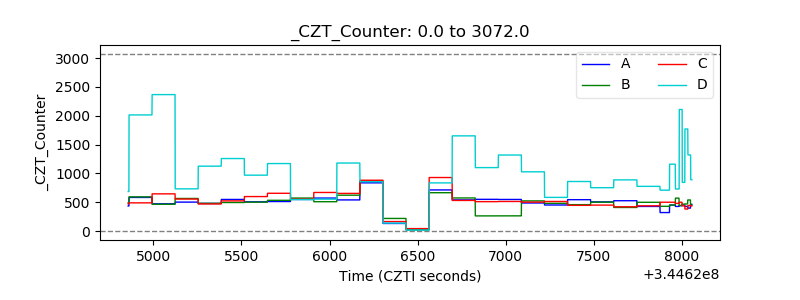 |
| +2.5 Volts monitor | 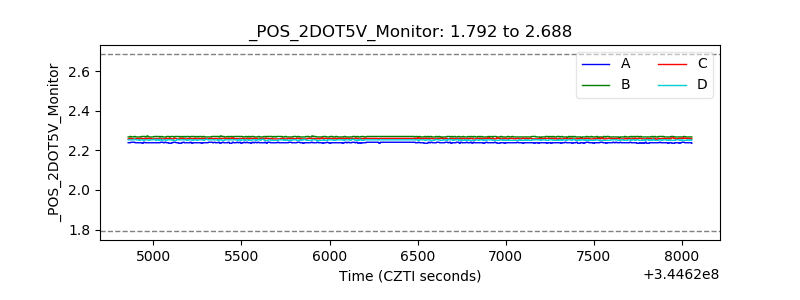 |
| +5 Volts monitor |  |
| _ROLL_ROT | 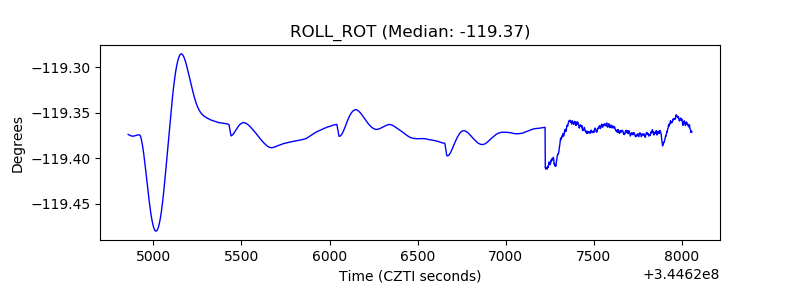 |
| _Roll_DEC | 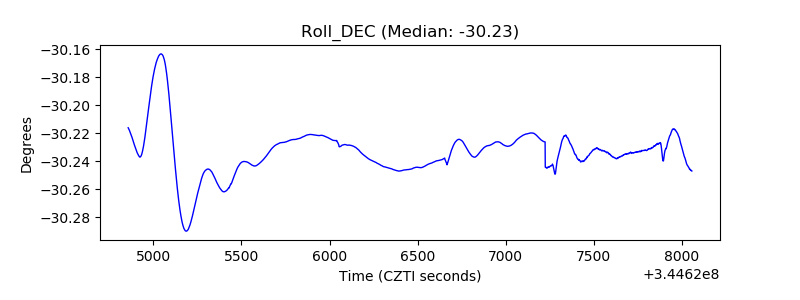 |
| _Roll_RA | 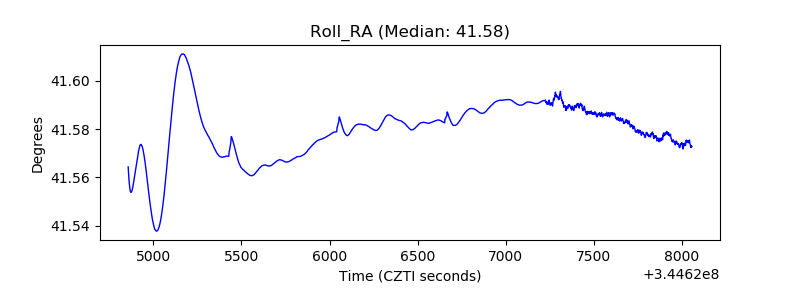 |
| Veto Counter | 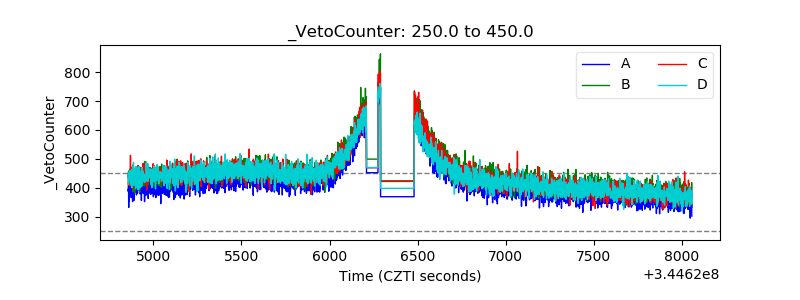 |