| Param | Original file | Final file |
|---|---|---|
| Filename | modeM0/AS1A10_021T01_9000004044_28014cztM0_level2.evt | modeM0/AS1A10_021T01_9000004044_28014cztM0_level2_quad_clean.evt |
| Size (bytes) | 638,807,040 | 111,055,680 |
| Size | 609.2 MB | 105.9 MB |
| Events in quadrant A | 3,777,344 | 737,454 |
| Events in quadrant B | 3,840,912 | 734,413 |
| Events in quadrant C | 3,922,672 | 696,051 |
| Events in quadrant D | 7,280,126 | 656,011 |
| Mode M9 | |||
|---|---|---|---|
| Quadrant | BADHDUFLAG | Total packets | Discarded packets |
| A | 0 | 1 | 0 |
| B | 0 | 1 | 0 |
| C | 0 | 1 | 0 |
| D | 0 | 1 | 0 |
| Mode M0 | |||
|---|---|---|---|
| Quadrant | BADHDUFLAG | Total packets | Discarded packets |
| A | 0 | 16240 | 0 |
| B | 0 | 16431 | 0 |
| C | 0 | 16762 | 0 |
| D | 0 | 27051 | 0 |
| Quadrant | Total seconds | Saturated seconds | Saturation percentage |
|---|---|---|---|
| A | 7749 | 113 | 1.458253% |
| B | 7750 | 178 | 2.296774% |
| C | 7750 | 184 | 2.374194% |
| D | 7750 | 686 | 8.851613% |
Noise dominated data is calculated using 1-second bins in cleaned event files. If a bin has >2000 counts, and if more than 50% of those come from <1% of pixels, then it is considered to be noise-dominated and hence unusable.
| Quadrant | # 1 sec bins | Bins with >0 counts | Bins with >2000 counts | High rate bins dominated by noise | Noise dominated (total time) | Noise dominated (detector-on time) | Marked lightcurve |
|---|---|---|---|---|---|---|---|
| A | 7839 | 7750 | 0 | 0 | 0.00% | 0.00% | 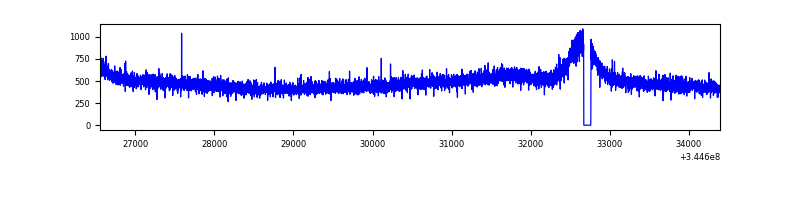 |
| B | 7840 | 7751 | 4 | 4 | 0.05% | 0.05% | 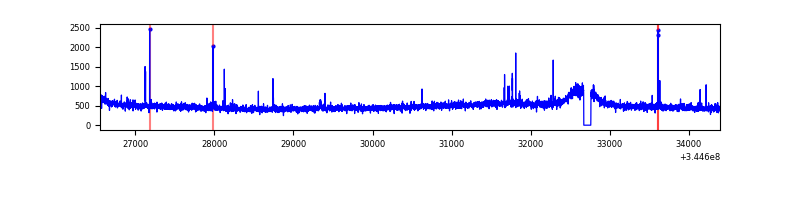 |
| C | 7840 | 7751 | 5 | 5 | 0.06% | 0.06% | 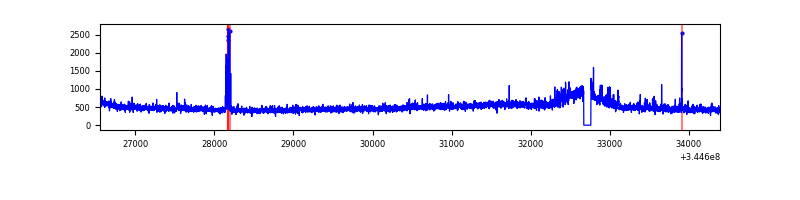 |
| D | 7840 | 7751 | 548 | 548 | 6.99% | 7.07% | 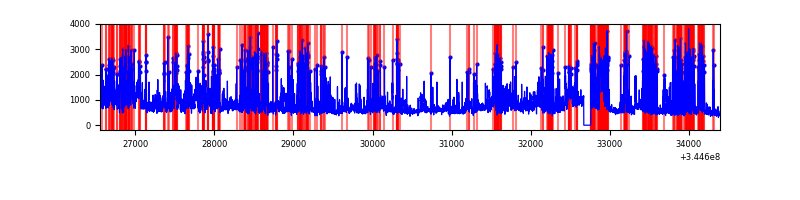 |
Top three noisy pixels from each quadrant. If the there are fewer than three noisy pixels in the level2.evt file, extra rows are filled as -1
| Pixel properties | Quadrant properties | ||||||
|---|---|---|---|---|---|---|---|
| Quadrant | DetID | PixID | Counts | Sigma | Mean | Median | Sigma |
| A | 0 | 13 | 19728 | 94.9 | 973 | 951 | 197.9 |
| A | 13 | 254 | 12505 | 58.39 | 973 | 951 | 197.9 |
| A | 3 | 137 | 9895 | 45.2 | 973 | 951 | 197.9 |
| B | 12 | 111 | 23708 | 122.18 | 961 | 937 | 186.4 |
| B | 4 | 200 | 22479 | 115.58 | 961 | 937 | 186.4 |
| B | 11 | 111 | 21341 | 109.48 | 961 | 937 | 186.4 |
| C | 14 | 238 | 149234 | 681.83 | 920 | 925 | 217.5 |
| C | 3 | 233 | 135348 | 617.99 | 920 | 925 | 217.5 |
| C | 10 | 22 | 44536 | 200.5 | 920 | 925 | 217.5 |
| D | 1 | 52 | 2219132 | 10218.16 | 904 | 879 | 217.1 |
| D | 8 | 195 | 779072 | 3584.67 | 904 | 879 | 217.1 |
| D | 7 | 80 | 630736 | 2901.37 | 904 | 879 | 217.1 |
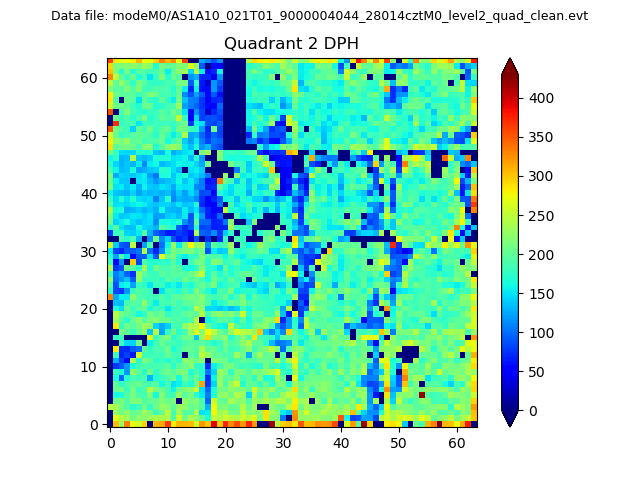
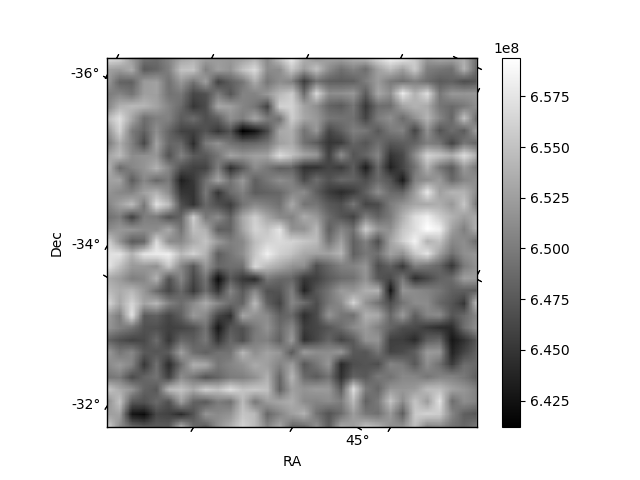
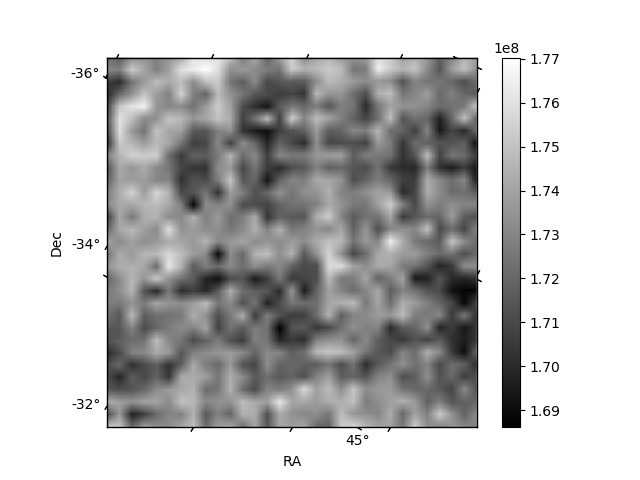
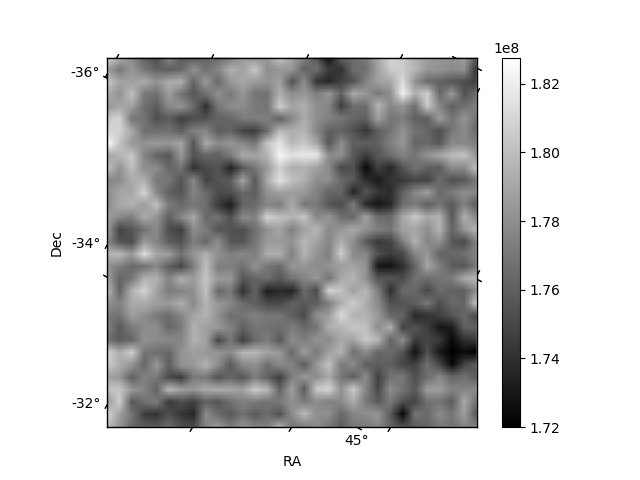
Histogram calculated using DETX and DETY for each event in the final _common_clean file
| Quadrant A | 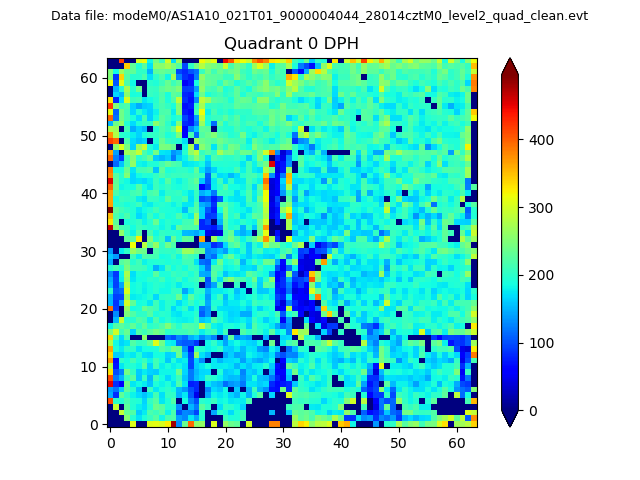 |
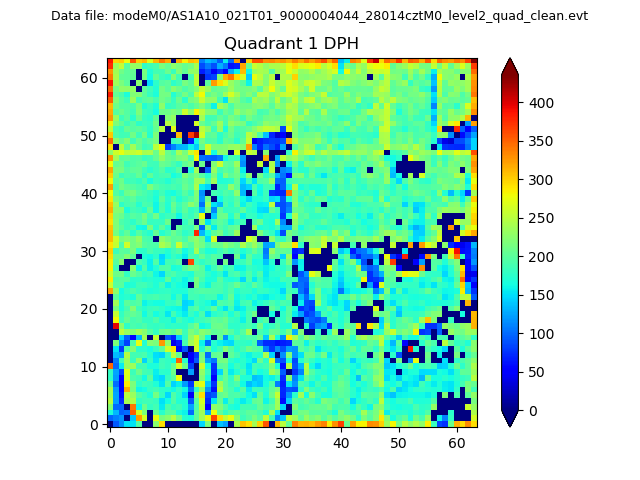 |
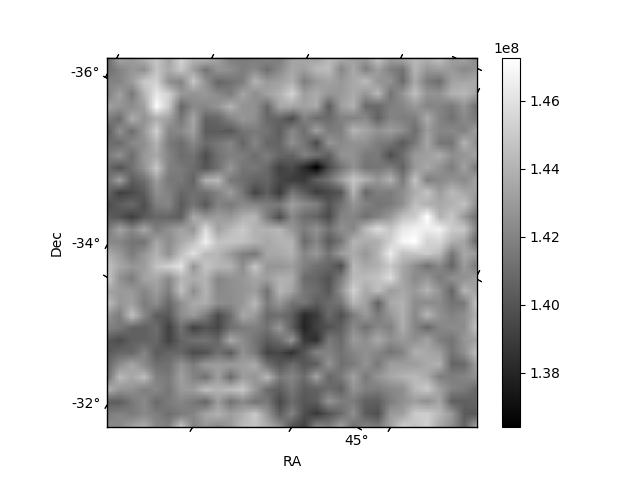
Quadrant B |
|---|---|---|---|
| Quadrant D | 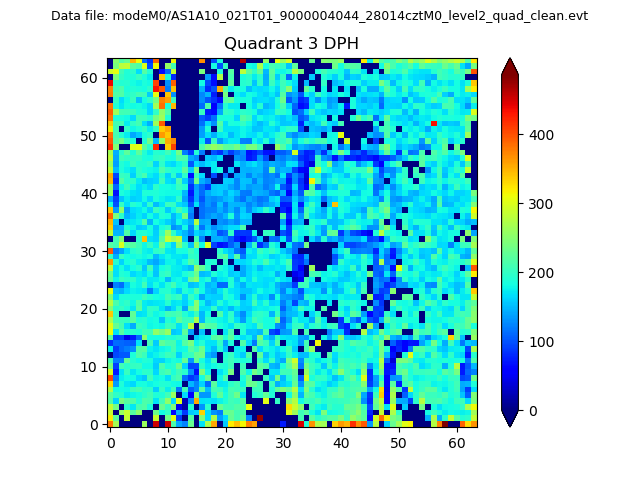 |
 |
Quadrant C |
| Plot type | Count rate plots | Images |
|---|---|---|
| Comparison with Poisson distribution Blue bars denote a histogram of data divided into 1 sec bins. Red curve is a Poisson curve with rate = median count rate of data. |
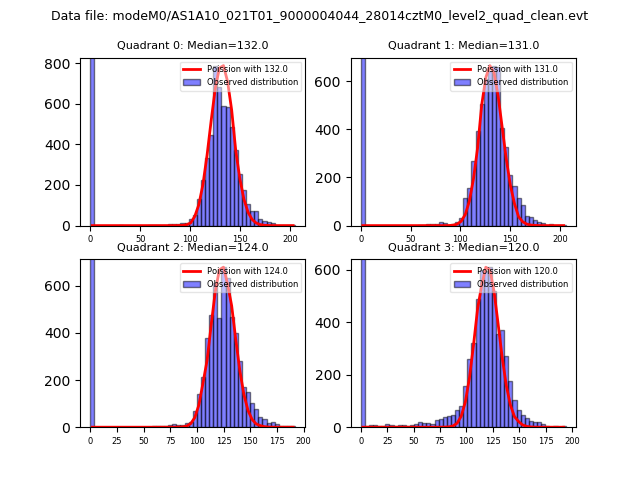 |
 |
| Quadrant-wise count rates Data is divided into 100 sec bins |
 |
|
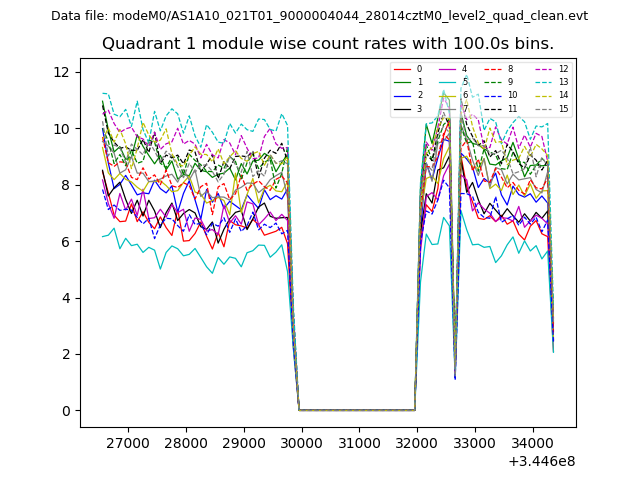
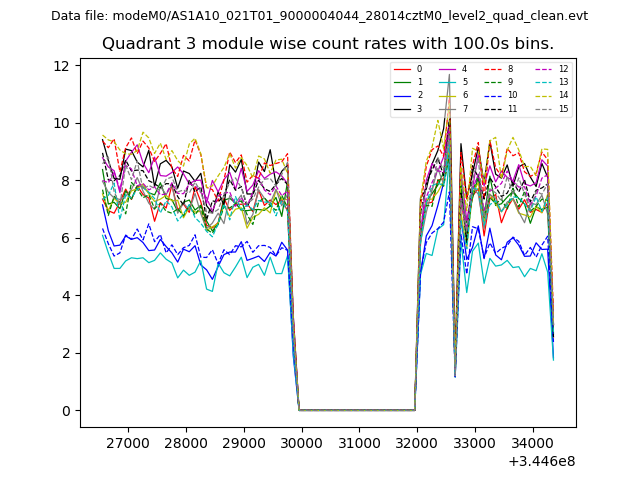
| Module-wise count rates for Quadrant A Data is divided into 100 sec bins |
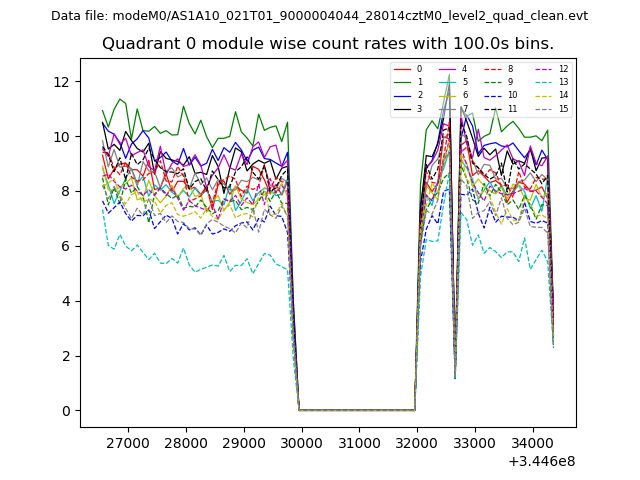 |
 |
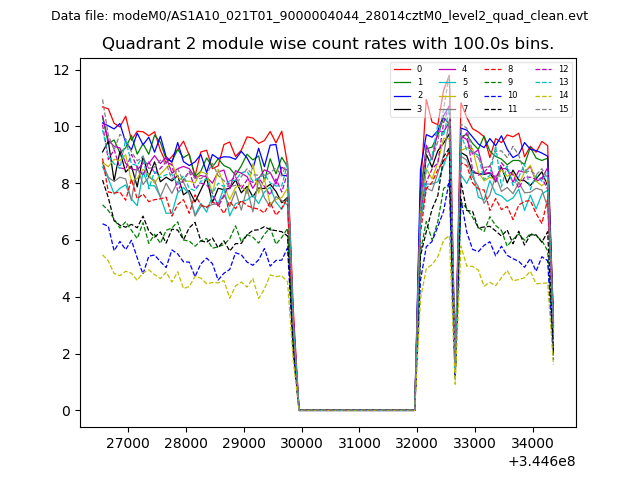
| Module-wise count rates for Quadrant B Data is divided into 100 sec bins |
 |
 |
| Module-wise count rates for Quadrant C Data is divided into 100 sec bins |
 |
 |
| Module-wise count rates for Quadrant D Data is divided into 100 sec bins |
 |
 |
| Parameter | Plot |
|---|---|
| CZT HV Monitor | 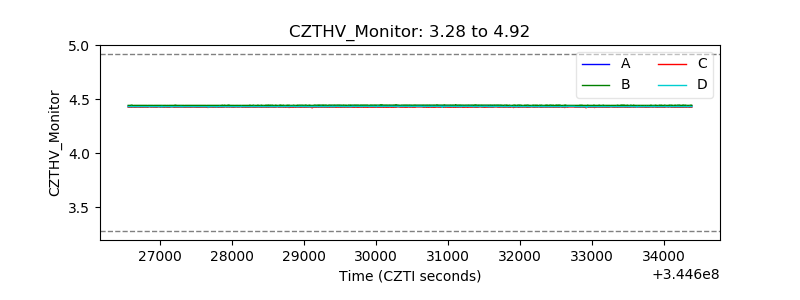 |
| D_VDD | 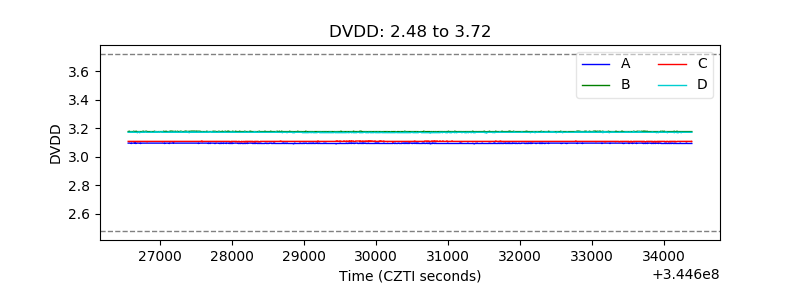 |
| Temperature 1 | 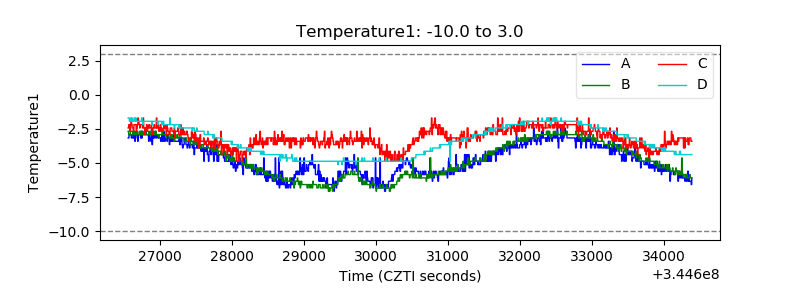 |
| Veto HV Monitor | 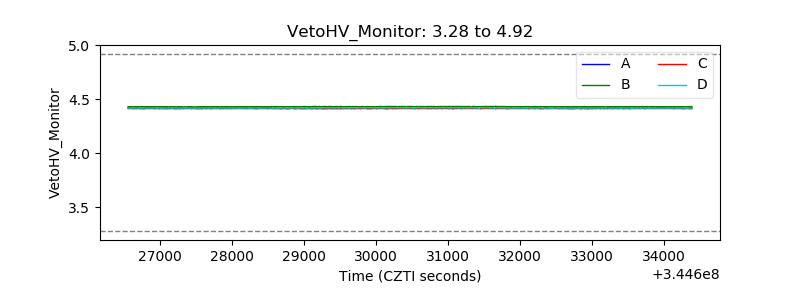 |
| Veto LLD | 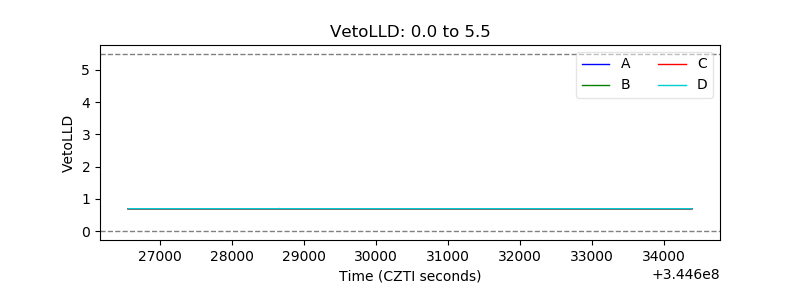 |
| Alpha Counter | 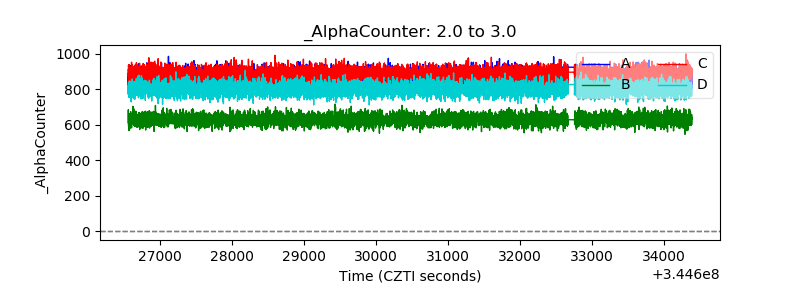 |
| _CPM_Rate |  |
| CZT Counter | 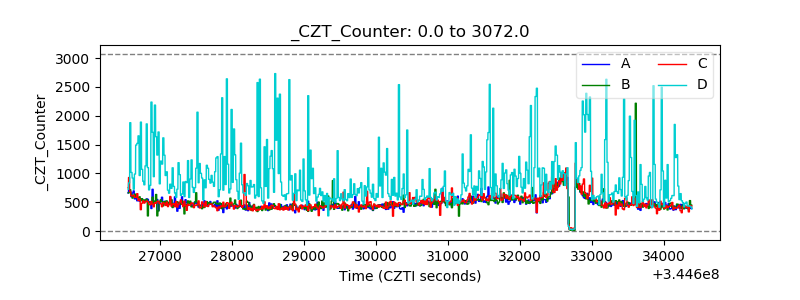 |
| +2.5 Volts monitor |  |
| +5 Volts monitor |  |
| _ROLL_ROT | 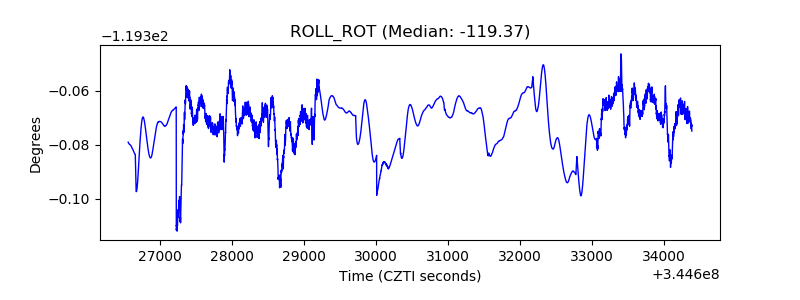 |
| _Roll_DEC | 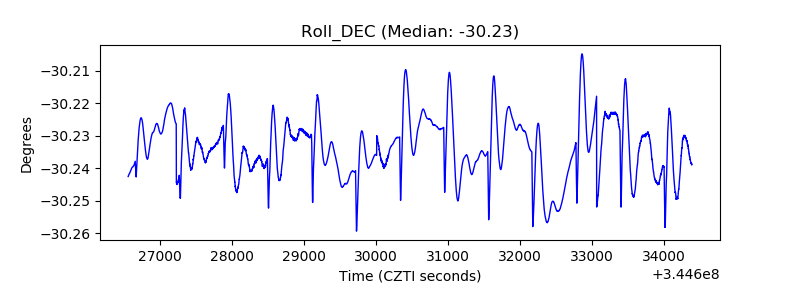 |
| _Roll_RA | 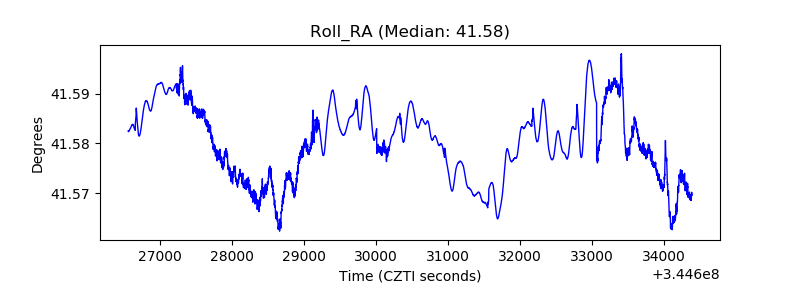 |
| Veto Counter | 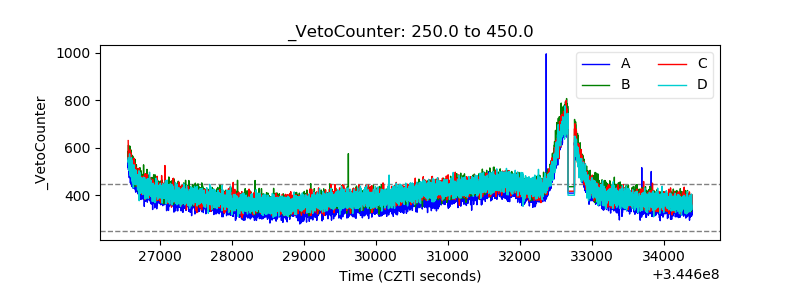 |