| Param | Original file | Final file |
|---|---|---|
| Filename | modeM0/AS1A10_021T01_9000004044_28017cztM0_level2.evt | modeM0/AS1A10_021T01_9000004044_28017cztM0_level2_quad_clean.evt |
| Size (bytes) | 1,270,526,400 | 222,128,640 |
| Size | 1.2 GB | 211.8 MB |
| Events in quadrant A | 8,237,202 | 1,428,417 |
| Events in quadrant B | 8,339,482 | 1,428,271 |
| Events in quadrant C | 8,591,801 | 1,351,250 |
| Events in quadrant D | 12,133,128 | 1,319,543 |
| Mode M9 | |||
|---|---|---|---|
| Quadrant | BADHDUFLAG | Total packets | Discarded packets |
| A | 0 | 12 | 0 |
| B | 0 | 12 | 0 |
| C | 0 | 12 | 0 |
| D | 0 | 12 | 0 |
| Mode M0 | |||
|---|---|---|---|
| Quadrant | BADHDUFLAG | Total packets | Discarded packets |
| A | 0 | 35752 | 0 |
| B | 0 | 35937 | 0 |
| C | 0 | 36596 | 0 |
| D | 0 | 47558 | 0 |
| Quadrant | Total seconds | Saturated seconds | Saturation percentage |
|---|---|---|---|
| A | 17407 | 153 | 0.878957% |
| B | 17407 | 255 | 1.464928% |
| C | 17407 | 304 | 1.746424% |
| D | 17407 | 790 | 4.538404% |
Noise dominated data is calculated using 1-second bins in cleaned event files. If a bin has >2000 counts, and if more than 50% of those come from <1% of pixels, then it is considered to be noise-dominated and hence unusable.
| Quadrant | # 1 sec bins | Bins with >0 counts | Bins with >2000 counts | High rate bins dominated by noise | Noise dominated (total time) | Noise dominated (detector-on time) | Marked lightcurve |
|---|---|---|---|---|---|---|---|
| A | 18452 | 17410 | 0 | 0 | 0.00% | 0.00% | 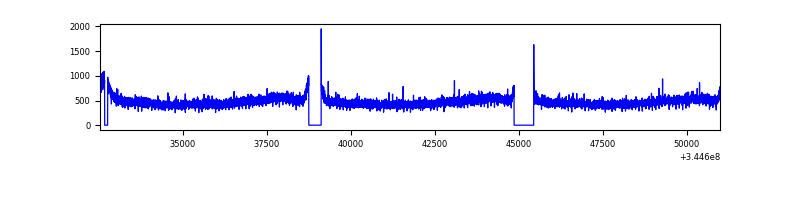 |
| B | 18451 | 17407 | 5 | 5 | 0.03% | 0.03% | 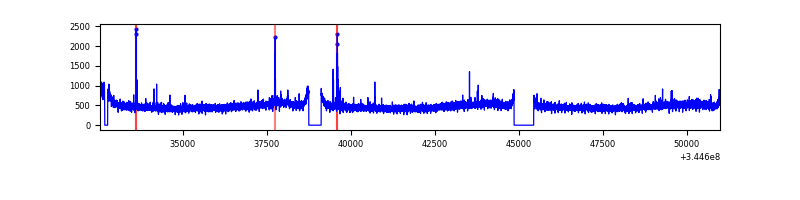 |
| C | 18451 | 17408 | 12 | 12 | 0.07% | 0.07% | 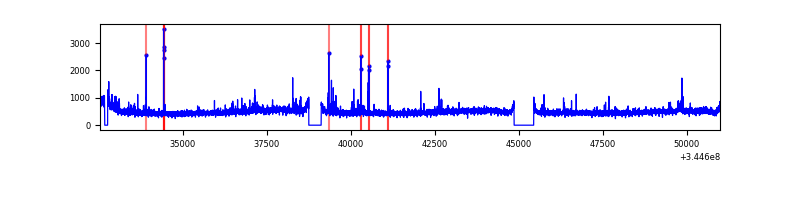 |
| D | 18452 | 17409 | 703 | 703 | 3.81% | 4.04% | 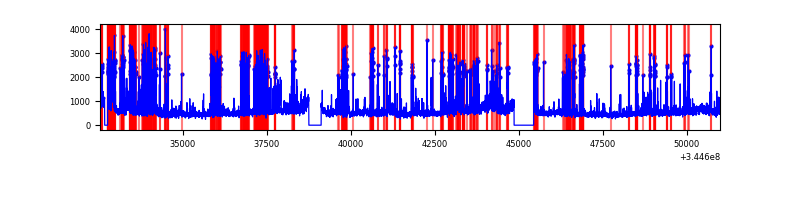 |
Top three noisy pixels from each quadrant. If the there are fewer than three noisy pixels in the level2.evt file, extra rows are filled as -1
| Pixel properties | Quadrant properties | ||||||
|---|---|---|---|---|---|---|---|
| Quadrant | DetID | PixID | Counts | Sigma | Mean | Median | Sigma |
| A | 13 | 254 | 26711 | 57.39 | 2125 | 2075 | 429.3 |
| A | 0 | 13 | 25948 | 55.61 | 2125 | 2075 | 429.3 |
| A | 3 | 137 | 21333 | 44.86 | 2125 | 2075 | 429.3 |
| B | 12 | 111 | 52231 | 124.54 | 2109 | 2060 | 402.9 |
| B | 11 | 111 | 47429 | 112.62 | 2109 | 2060 | 402.9 |
| B | 14 | 111 | 44361 | 105.0 | 2109 | 2060 | 402.9 |
| C | 14 | 238 | 325693 | 679.58 | 2034 | 2050 | 476.2 |
| C | 3 | 233 | 209395 | 435.38 | 2034 | 2050 | 476.2 |
| C | 2 | 16 | 128344 | 265.19 | 2034 | 2050 | 476.2 |
| D | 8 | 195 | 1969865 | 4077.68 | 2027 | 1970 | 482.6 |
| D | 1 | 52 | 1867625 | 3865.82 | 2027 | 1970 | 482.6 |
| D | 7 | 80 | 447414 | 923.0 | 2027 | 1970 | 482.6 |
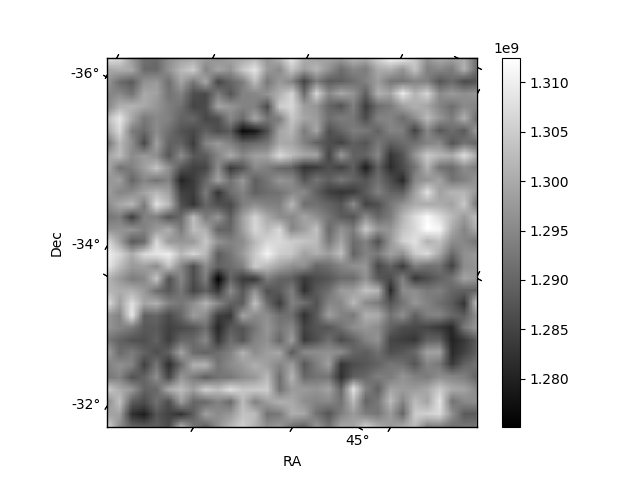
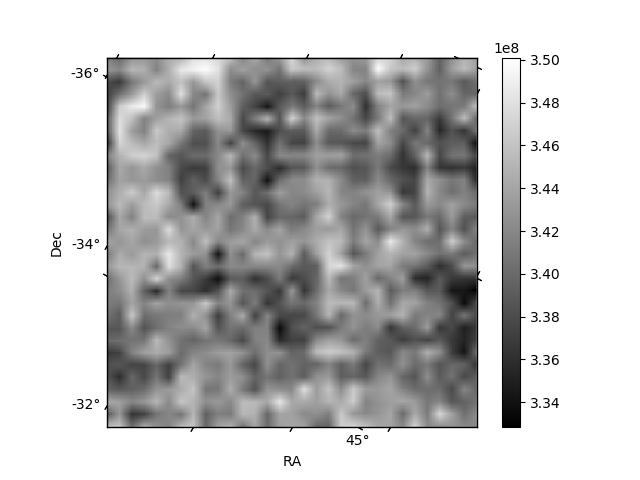
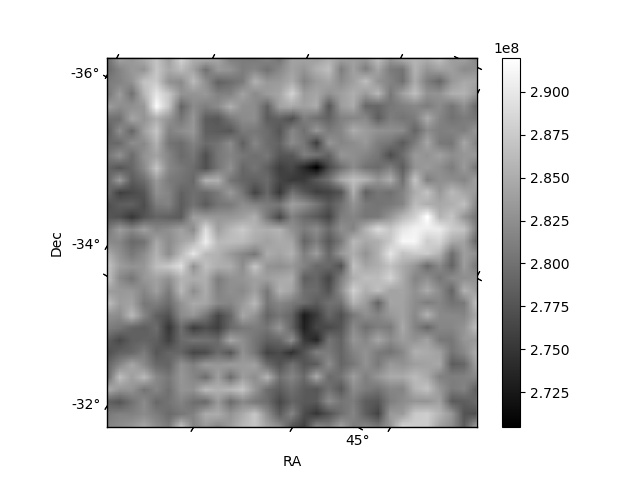
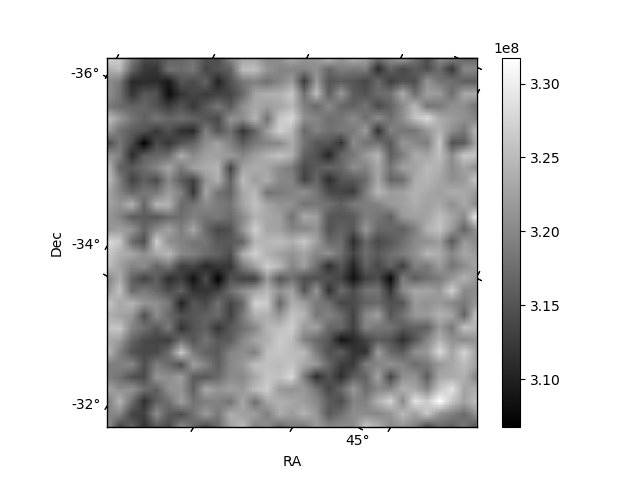
Histogram calculated using DETX and DETY for each event in the final _common_clean file
| Quadrant A | 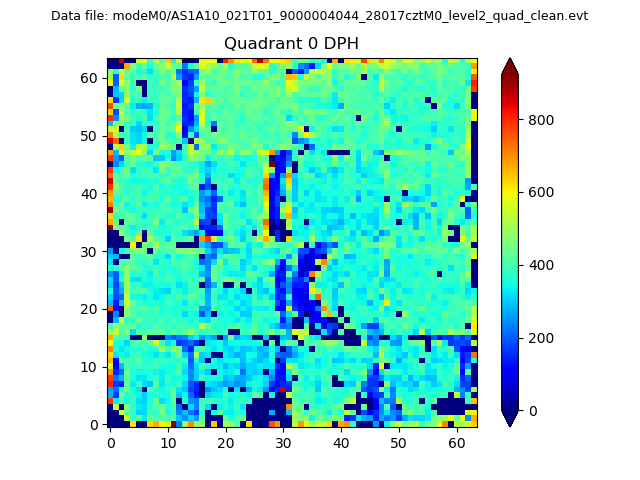 |
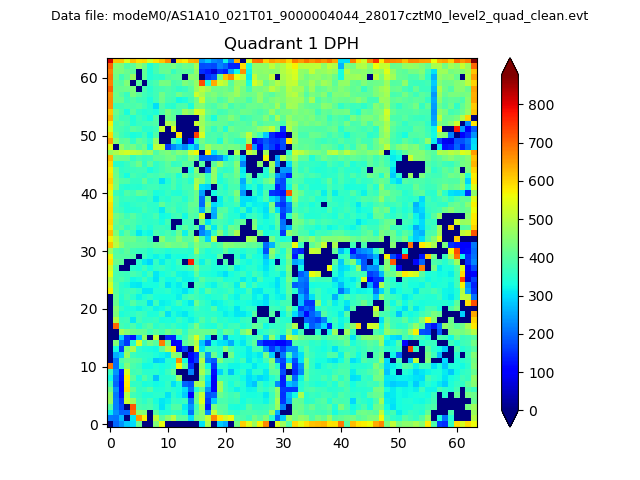 |
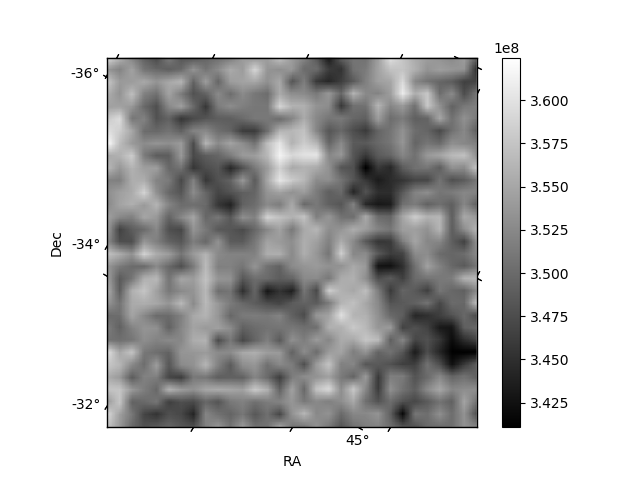
Quadrant B |
|---|---|---|---|
| Quadrant D | 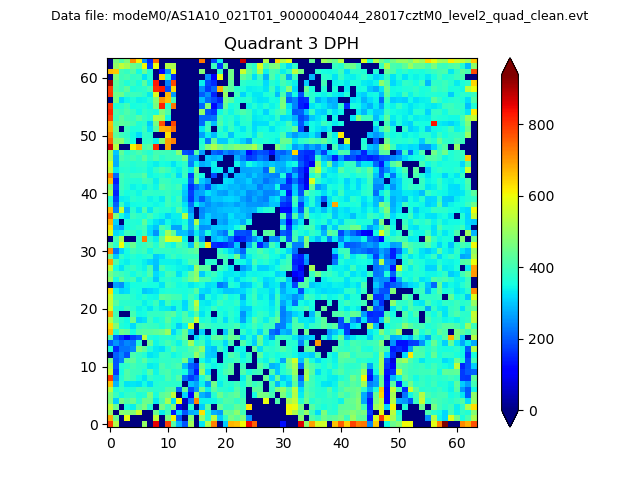 |
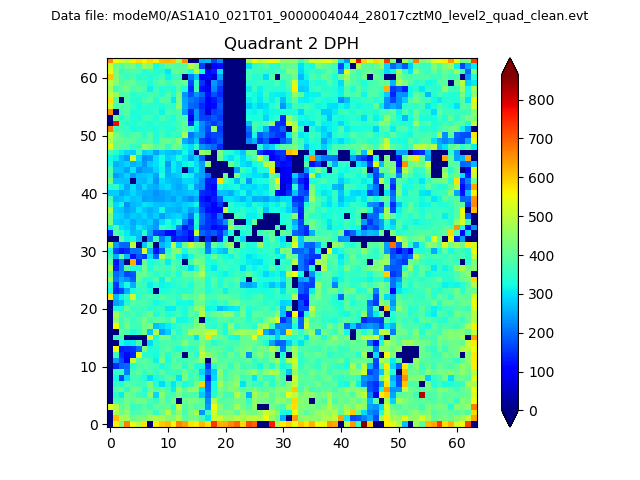 |
Quadrant C |
| Plot type | Count rate plots | Images |
|---|---|---|
| Comparison with Poisson distribution Blue bars denote a histogram of data divided into 1 sec bins. Red curve is a Poisson curve with rate = median count rate of data. |
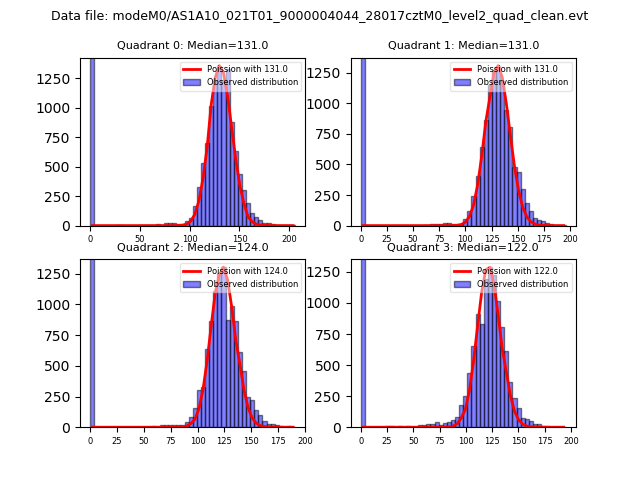 |
 |
| Quadrant-wise count rates Data is divided into 100 sec bins |
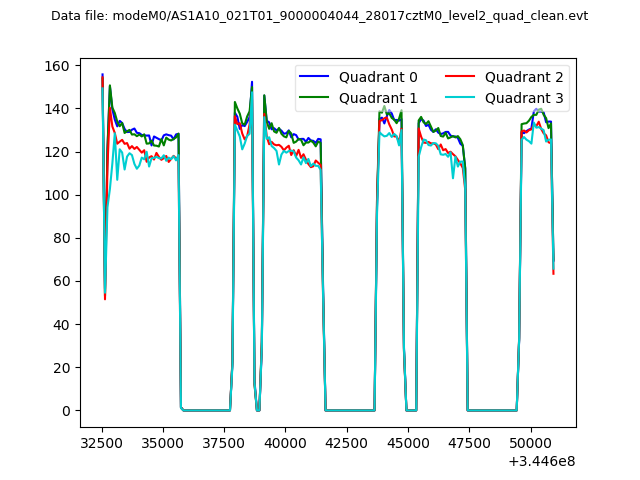 |
|
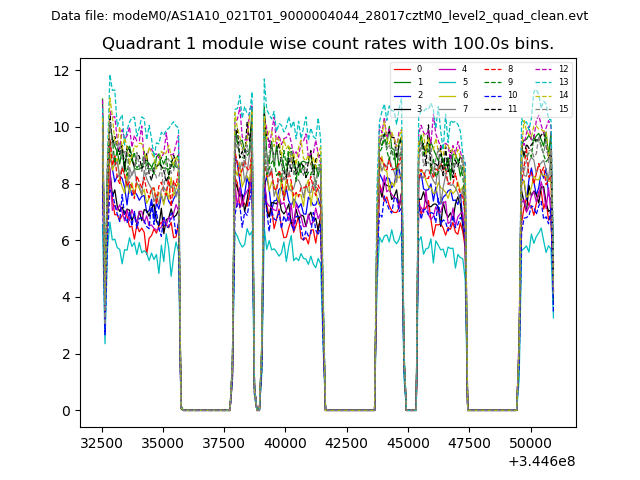
| Module-wise count rates for Quadrant A Data is divided into 100 sec bins |
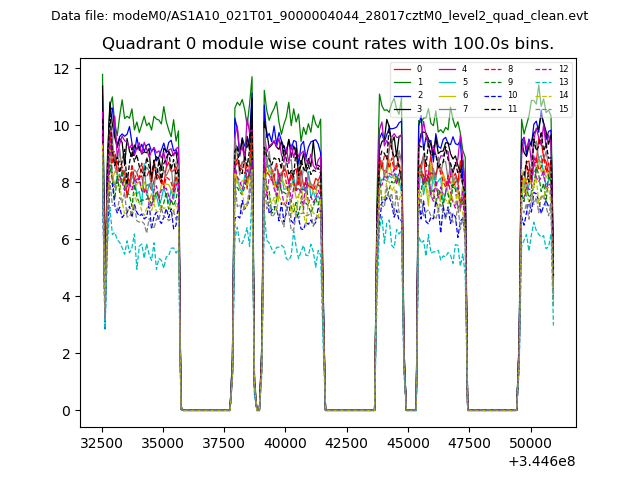 |
 |
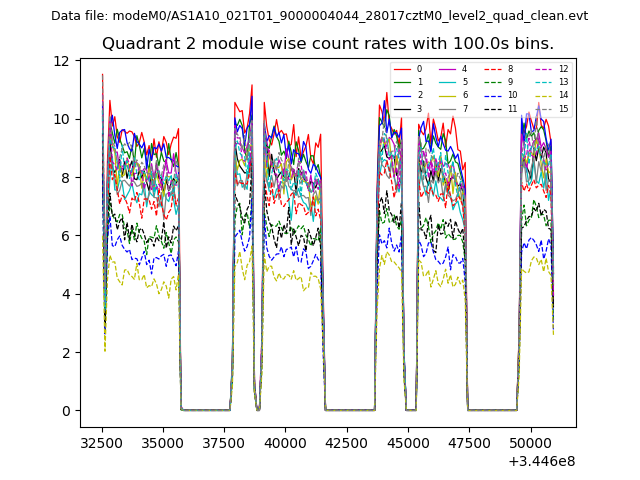
| Module-wise count rates for Quadrant B Data is divided into 100 sec bins |
 |
 |
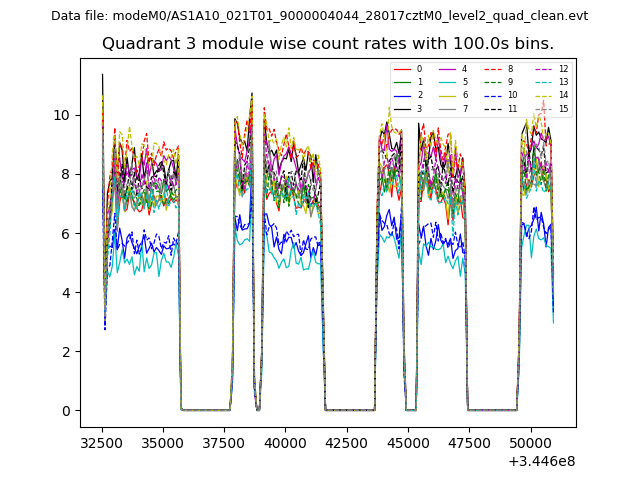
| Module-wise count rates for Quadrant C Data is divided into 100 sec bins |
 |
 |
| Module-wise count rates for Quadrant D Data is divided into 100 sec bins |
 |
 |
| Parameter | Plot |
|---|---|
| CZT HV Monitor |  |
| D_VDD | 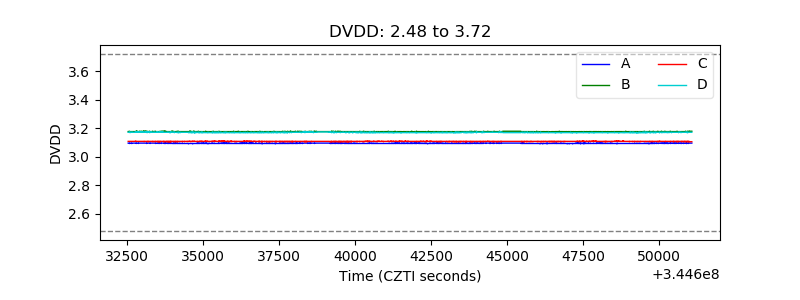 |
| Temperature 1 | 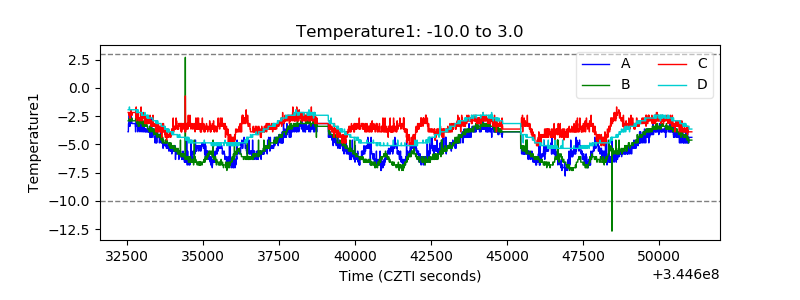 |
| Veto HV Monitor | 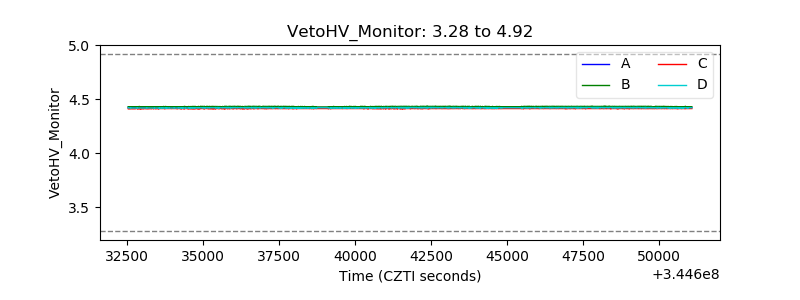 |
| Veto LLD | 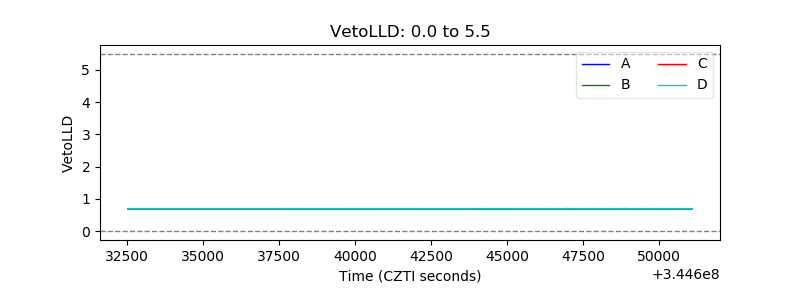 |
| Alpha Counter | 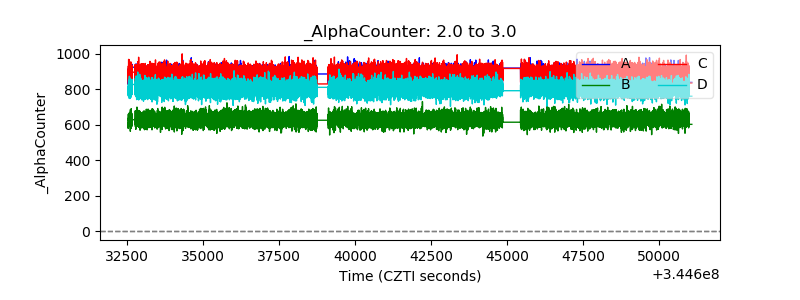 |
| _CPM_Rate | 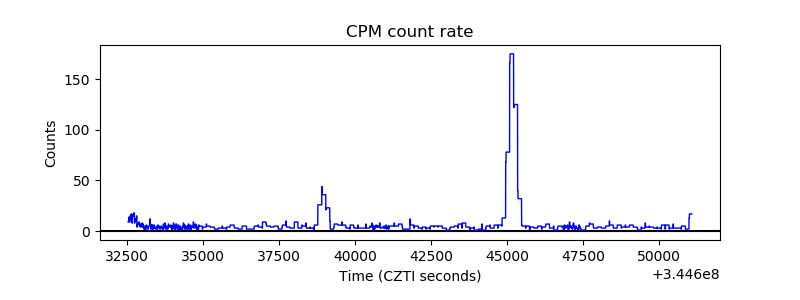 |
| CZT Counter | 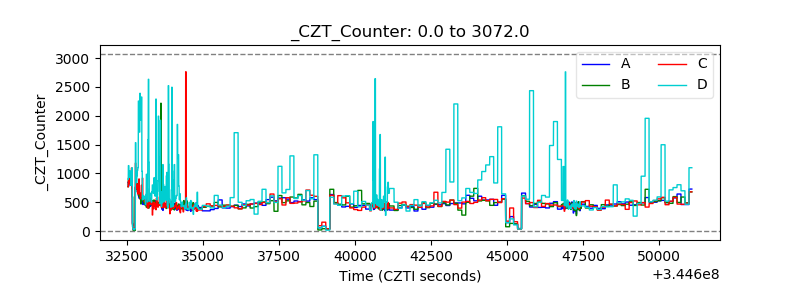 |
| +2.5 Volts monitor | 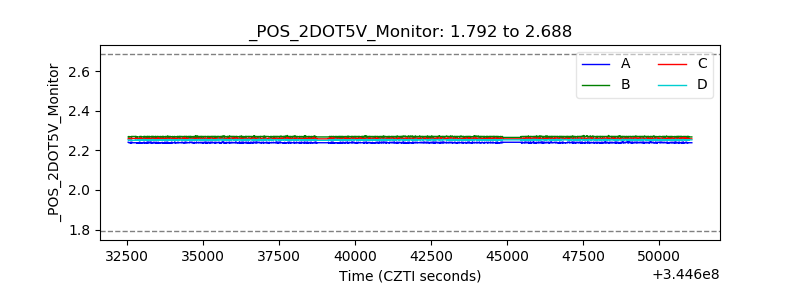 |
| +5 Volts monitor |  |
| _ROLL_ROT | 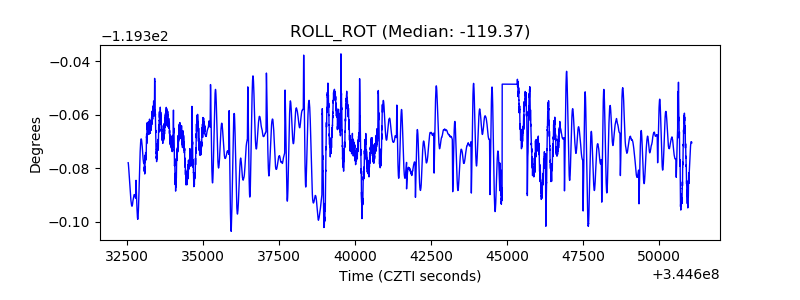 |
| _Roll_DEC | 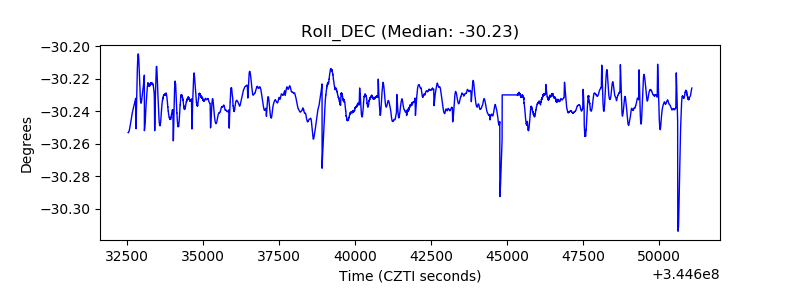 |
| _Roll_RA | 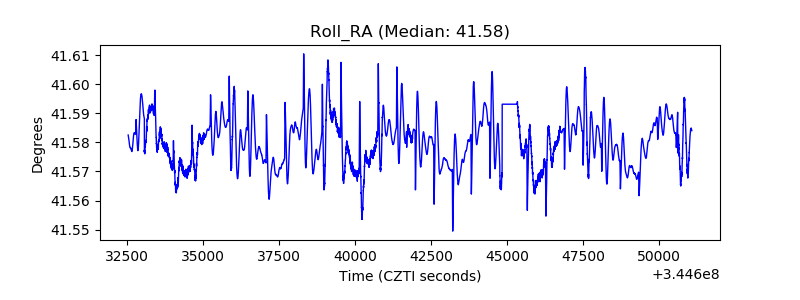 |
| Veto Counter |  |