| Param | Original file | Final file |
|---|---|---|
| Filename | modeM0/AS1A10_045T01_9000004046cztM0_level2.fits | modeM0/AS1A10_045T01_9000004046cztM0_level2_quad_clean.evt |
| Size (bytes) | 263,191,680 | 156,723,840 |
| Size | 251.0 MB | 149.5 MB |
| Events in quadrant A | 1,684,218 | 820,402 |
| Events in quadrant B | 1,611,948 | 795,128 |
| Events in quadrant C | 1,599,486 | 744,344 |
| Events in quadrant D | 1,369,248 | 678,458 |
| Mode SS | |||
|---|---|---|---|
| Quadrant | BADHDUFLAG | Total packets | Discarded packets |
| A | 0 | 504 | 0 |
| B | 0 | 504 | 0 |
| C | 0 | 504 | 0 |
| D | 0 | 504 | 0 |
| Mode M9 | |||
|---|---|---|---|
| Quadrant | BADHDUFLAG | Total packets | Discarded packets |
| A | 0 | 45 | 0 |
| B | 0 | 45 | 0 |
| C | 0 | 45 | 0 |
| D | 0 | 45 | 0 |
| Mode M0 | |||
|---|---|---|---|
| Quadrant | BADHDUFLAG | Total packets | Discarded packets |
| A | 0 | 52500 | 0 |
| B | 0 | 53555 | 0 |
| C | 0 | 57153 | 0 |
| D | 0 | 80812 | 0 |
| Quadrant | Total seconds | Saturated seconds | Saturation percentage |
|---|---|---|---|
| A | 24798 | 134 | 0.540366% |
| B | 24798 | 232 | 0.935559% |
| C | 24798 | 418 | 1.685620% |
| D | 24798 | 1594 | 6.427938% |
Noise dominated data is calculated using 1-second bins in cleaned event files. If a bin has >2000 counts, and if more than 50% of those come from <1% of pixels, then it is considered to be noise-dominated and hence unusable.
| Quadrant | # 1 sec bins | Bins with >0 counts | Bins with >2000 counts | High rate bins dominated by noise | Noise dominated (total time) | Noise dominated (detector-on time) | Marked lightcurve |
|---|---|---|---|---|---|---|---|
| A | 29328 | 24795 | 0 | 0 | 0.00% | 0.00% |  |
| B | 29328 | 24795 | 0 | 0 | 0.00% | 0.00% |  |
| C | 29328 | 24794 | 0 | 0 | 0.00% | 0.00% |  |
| D | 29328 | 24786 | 0 | 0 | 0.00% | 0.00% |  |
Top three noisy pixels from each quadrant. If the there are fewer than three noisy pixels in the level2.evt file, extra rows are filled as -1
| Pixel properties | Quadrant properties | ||||||
|---|---|---|---|---|---|---|---|
| Quadrant | DetID | PixID | Counts | Sigma | Mean | Median | Sigma |
| A | 7 | 110 | 1367 | 8.88 | 439 | 414 | 107.3 |
| A | 0 | 29 | 1359 | 8.81 | 439 | 414 | 107.3 |
| A | 14 | 79 | 1223 | 7.54 | 439 | 414 | 107.3 |
| B | 2 | 9 | 1255 | 9.95 | 426 | 409 | 85.0 |
| B | 5 | 255 | 1080 | 7.89 | 426 | 409 | 85.0 |
| B | 5 | 225 | 1053 | 7.57 | 426 | 409 | 85.0 |
| C | 1 | 81 | 1219 | 7.62 | 422 | 396 | 108.0 |
| C | 1 | 80 | 1164 | 7.11 | 422 | 396 | 108.0 |
| C | 2 | 191 | 1089 | 6.42 | 422 | 396 | 108.0 |
| D | 6 | 67 | 977 | 5.85 | 391 | 359 | 105.6 |
| D | 6 | 231 | 973 | 5.81 | 391 | 359 | 105.6 |
| D | 6 | 38 | 952 | 5.62 | 391 | 359 | 105.6 |
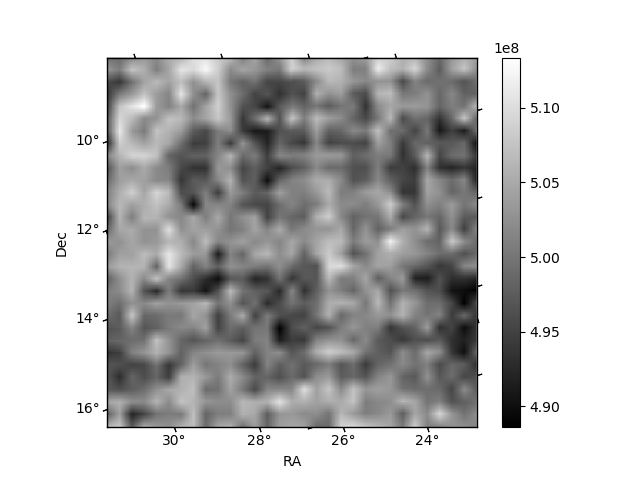
Histogram calculated using DETX and DETY for each event in the final _common_clean file
| Quadrant A | 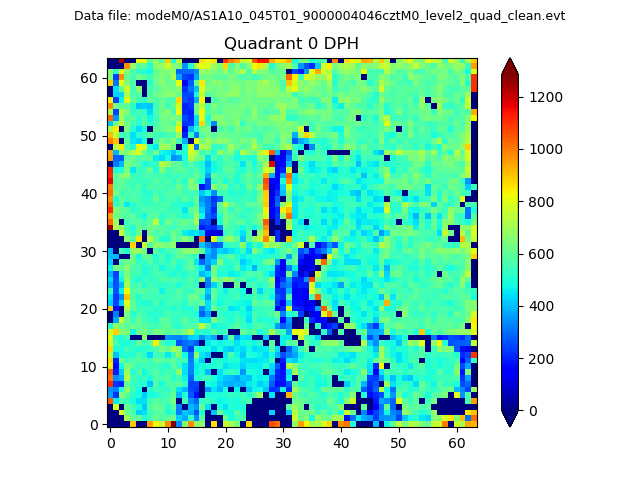 |
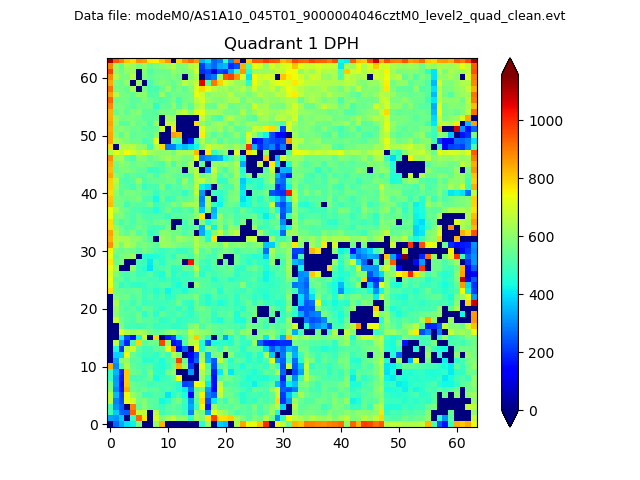 |
Quadrant B |
|---|---|---|---|
| Quadrant D | 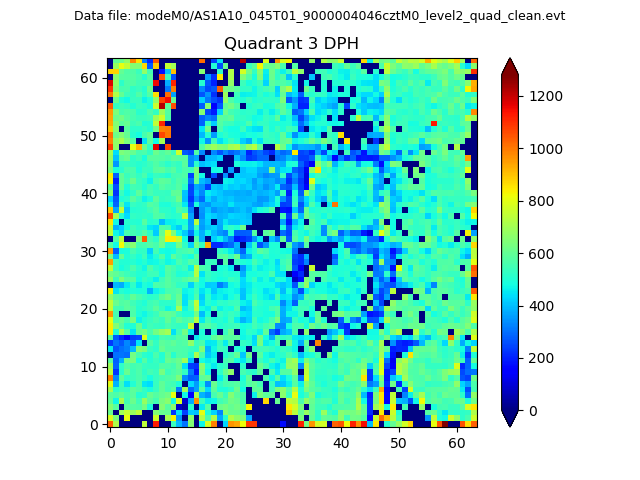 |
 |
Quadrant C |
| Plot type | Count rate plots | Images |
|---|---|---|
| Comparison with Poisson distribution Blue bars denote a histogram of data divided into 1 sec bins. Red curve is a Poisson curve with rate = median count rate of data. |
 |
 |
| Quadrant-wise count rates Data is divided into 100 sec bins |
 |
|
| Module-wise count rates for Quadrant A Data is divided into 100 sec bins |
 |
 |
| Module-wise count rates for Quadrant B Data is divided into 100 sec bins |
 |
 |
| Module-wise count rates for Quadrant C Data is divided into 100 sec bins |
 |
 |
| Module-wise count rates for Quadrant D Data is divided into 100 sec bins |
 |
 |
| Parameter | Plot |
|---|---|
| CZT HV Monitor |  |
| D_VDD | 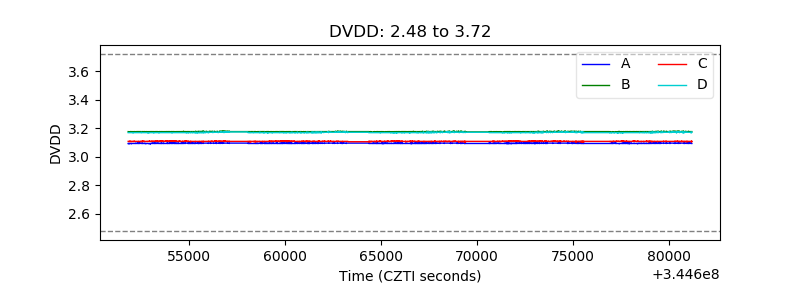 |
| Temperature 1 |  |
| Veto HV Monitor |  |
| Veto LLD |  |
| Alpha Counter |  |
| _CPM_Rate |  |
| CZT Counter |  |
| +2.5 Volts monitor |  |
| +5 Volts monitor |  |
| _ROLL_ROT | 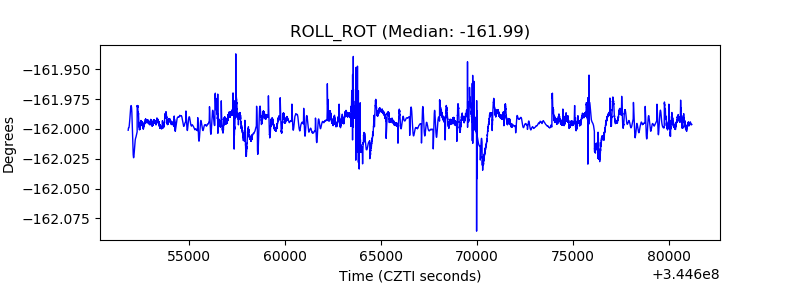 |
| _Roll_DEC |  |
| _Roll_RA |  |
| Veto Counter |  |