| Param | Original file | Final file |
|---|---|---|
| Filename | modeM0/AS1A10_045T01_9000004046_28017cztM0_level2.evt | modeM0/AS1A10_045T01_9000004046_28017cztM0_level2_quad_clean.evt |
| Size (bytes) | 105,073,920 | 22,426,560 |
| Size | 100.2 MB | 21.4 MB |
| Events in quadrant A | 711,087 | 147,731 |
| Events in quadrant B | 711,868 | 144,349 |
| Events in quadrant C | 744,765 | 136,198 |
| Events in quadrant D | 909,839 | 139,382 |
| Mode M0 | |||
|---|---|---|---|
| Quadrant | BADHDUFLAG | Total packets | Discarded packets |
| A | 0 | 3008 | 0 |
| B | 0 | 3004 | 0 |
| C | 0 | 3067 | 0 |
| D | 0 | 3653 | 0 |
| Quadrant | Total seconds | Saturated seconds | Saturation percentage |
|---|---|---|---|
| A | 1497 | 0 | 0.000000% |
| B | 1497 | 3 | 0.200401% |
| C | 1497 | 6 | 0.400802% |
| D | 1497 | 8 | 0.534402% |
Noise dominated data is calculated using 1-second bins in cleaned event files. If a bin has >2000 counts, and if more than 50% of those come from <1% of pixels, then it is considered to be noise-dominated and hence unusable.
| Quadrant | # 1 sec bins | Bins with >0 counts | Bins with >2000 counts | High rate bins dominated by noise | Noise dominated (total time) | Noise dominated (detector-on time) | Marked lightcurve |
|---|---|---|---|---|---|---|---|
| A | 1497 | 1497 | 0 | 0 | 0.00% | 0.00% | 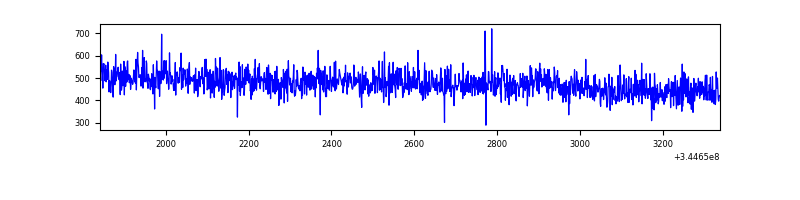 |
| B | 1497 | 1497 | 0 | 0 | 0.00% | 0.00% | 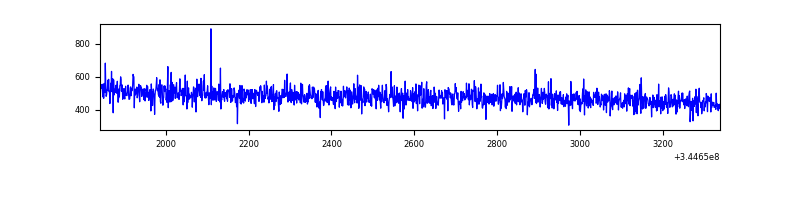 |
| C | 1497 | 1497 | 0 | 0 | 0.00% | 0.00% | 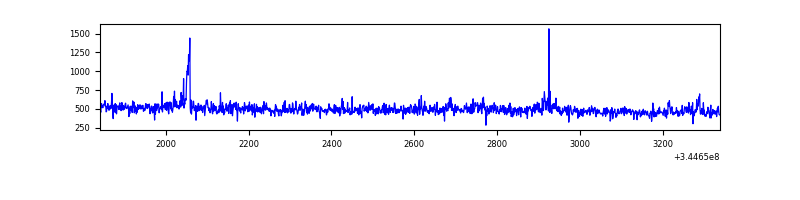 |
| D | 1497 | 1497 | 6 | 6 | 0.40% | 0.40% | 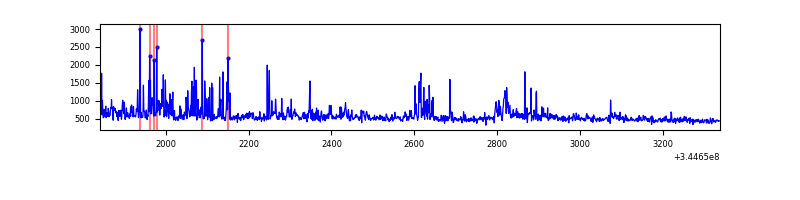 |
Top three noisy pixels from each quadrant. If the there are fewer than three noisy pixels in the level2.evt file, extra rows are filled as -1
| Pixel properties | Quadrant properties | ||||||
|---|---|---|---|---|---|---|---|
| Quadrant | DetID | PixID | Counts | Sigma | Mean | Median | Sigma |
| A | 0 | 13 | 7312 | 185.65 | 182 | 178 | 38.4 |
| A | 13 | 254 | 2413 | 58.16 | 182 | 178 | 38.4 |
| A | 3 | 137 | 1729 | 40.36 | 182 | 178 | 38.4 |
| B | 12 | 111 | 4403 | 112.59 | 181 | 176 | 37.5 |
| B | 11 | 111 | 3937 | 100.17 | 181 | 176 | 37.5 |
| B | 14 | 111 | 3841 | 97.62 | 181 | 176 | 37.5 |
| C | 14 | 238 | 27691 | 629.08 | 177 | 178 | 43.7 |
| C | 3 | 233 | 26331 | 597.99 | 177 | 178 | 43.7 |
| C | 13 | 61 | 1287 | 25.36 | 177 | 178 | 43.7 |
| D | 8 | 195 | 116372 | 2544.76 | 180 | 174 | 45.7 |
| D | 12 | 79 | 79488 | 1736.99 | 180 | 174 | 45.7 |
| D | 1 | 52 | 37237 | 811.69 | 180 | 174 | 45.7 |
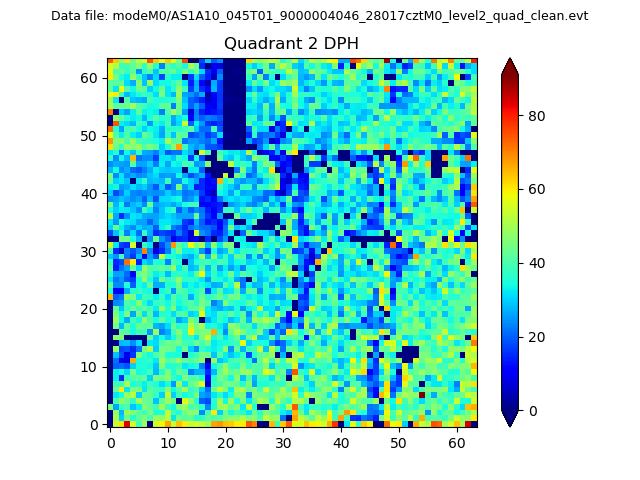
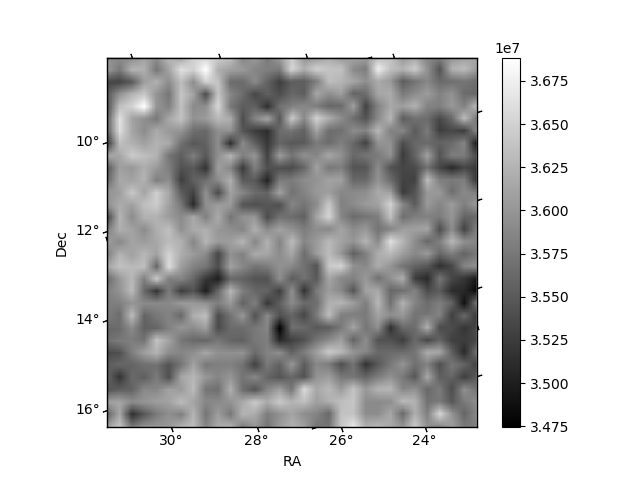
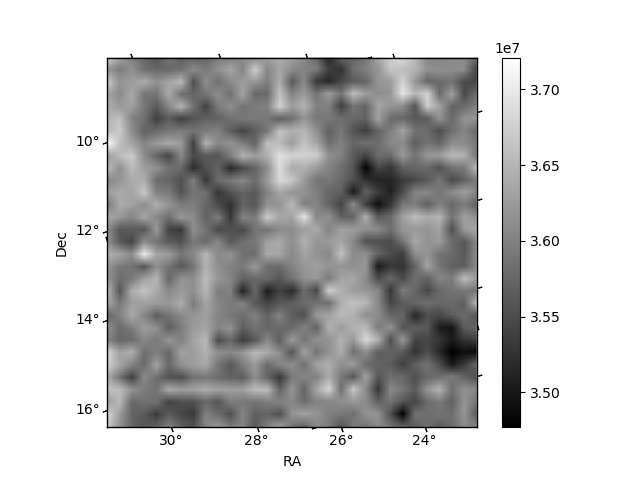
Histogram calculated using DETX and DETY for each event in the final _common_clean file
| Quadrant A | 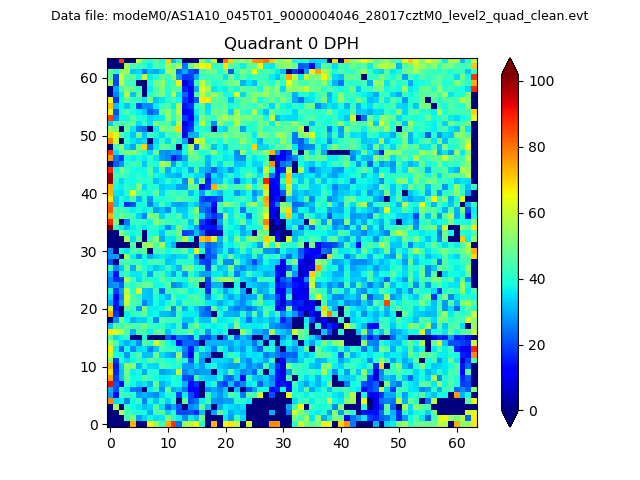 |
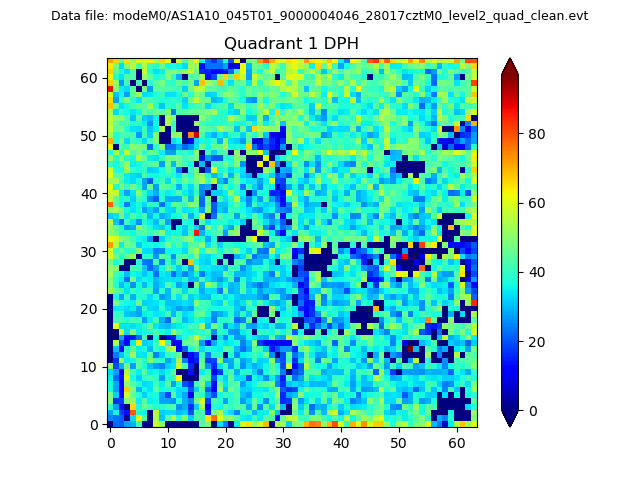 |
Quadrant B |
|---|---|---|---|
| Quadrant D | 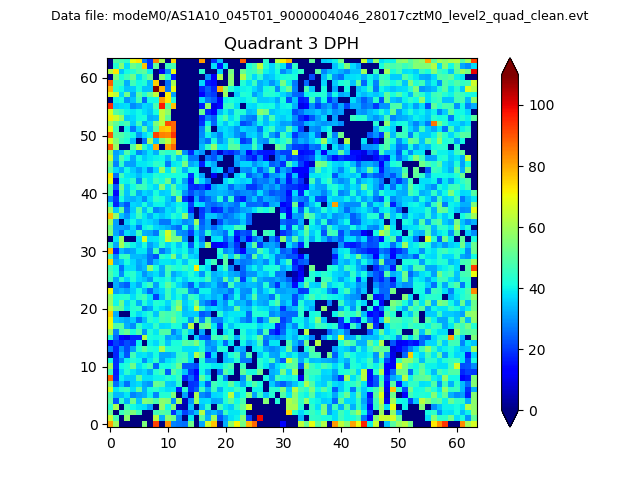 |
 |
Quadrant C |
| Plot type | Count rate plots | Images |
|---|---|---|
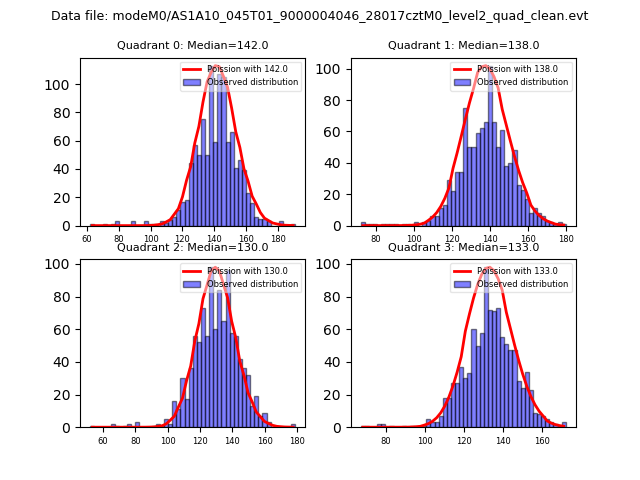
| Comparison with Poisson distribution Blue bars denote a histogram of data divided into 1 sec bins. Red curve is a Poisson curve with rate = median count rate of data. |
 |
 |
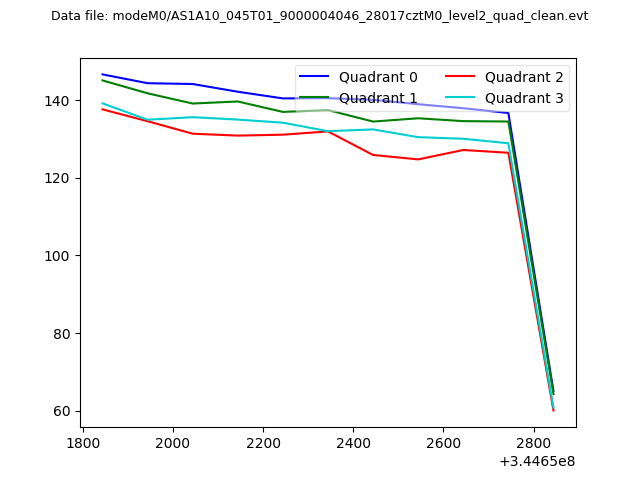
| Quadrant-wise count rates Data is divided into 100 sec bins |
 |
|
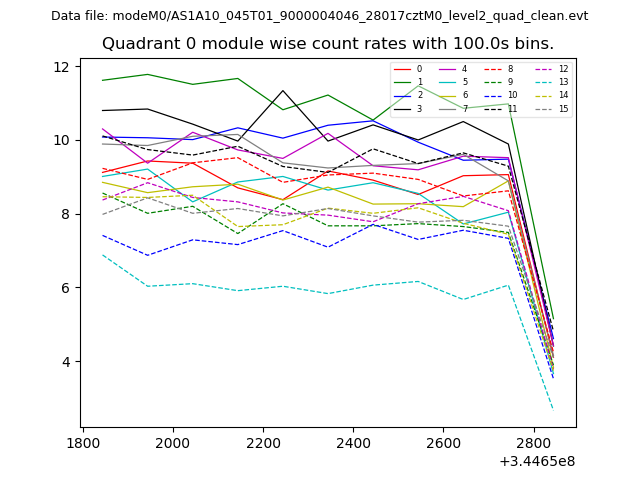
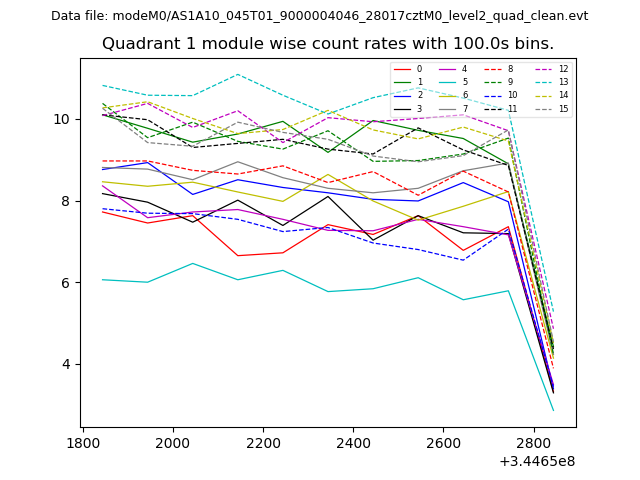
| Module-wise count rates for Quadrant A Data is divided into 100 sec bins |
 |
 |
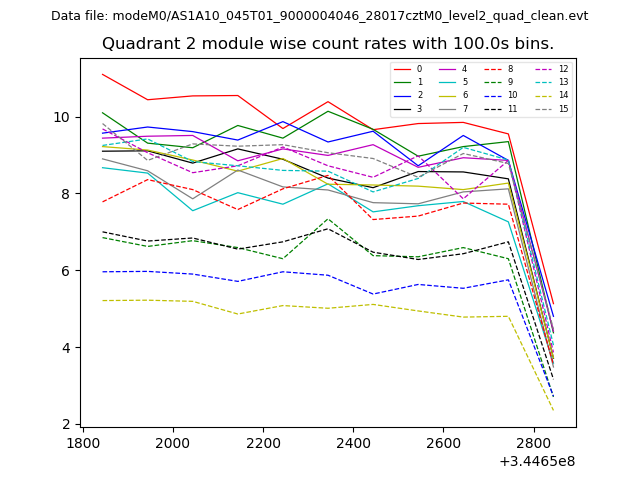
| Module-wise count rates for Quadrant B Data is divided into 100 sec bins |
 |
 |
| Module-wise count rates for Quadrant C Data is divided into 100 sec bins |
 |
 |
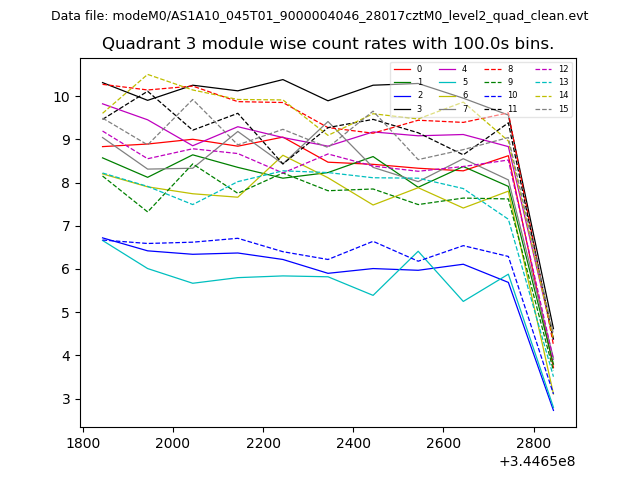
| Module-wise count rates for Quadrant D Data is divided into 100 sec bins |
 |
 |
| Parameter | Plot |
|---|---|
| CZT HV Monitor | 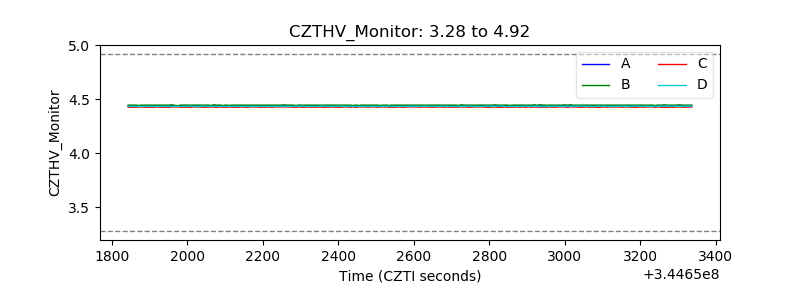 |
| D_VDD | 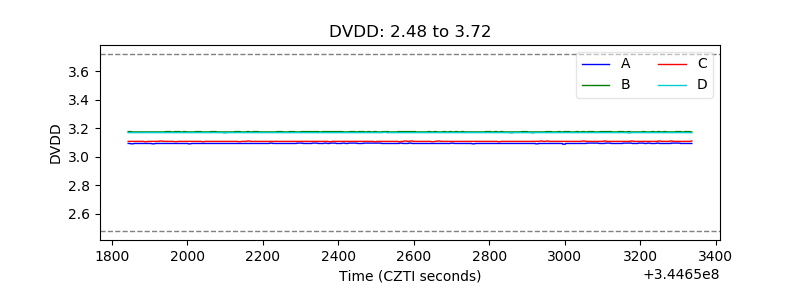 |
| Temperature 1 | 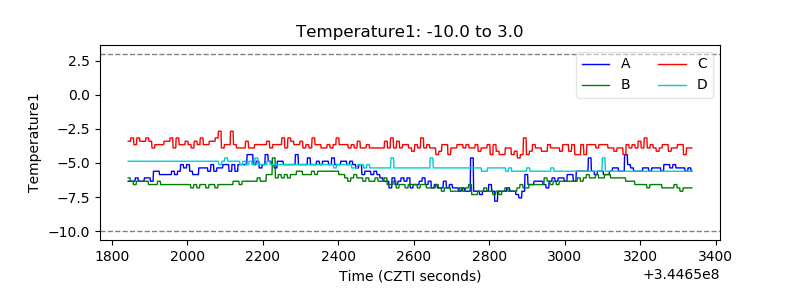 |
| Veto HV Monitor | 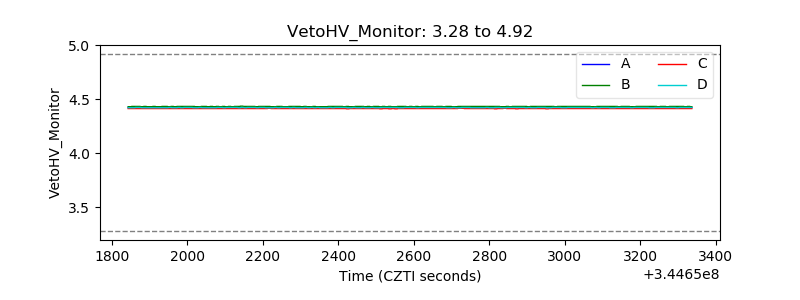 |
| Veto LLD | 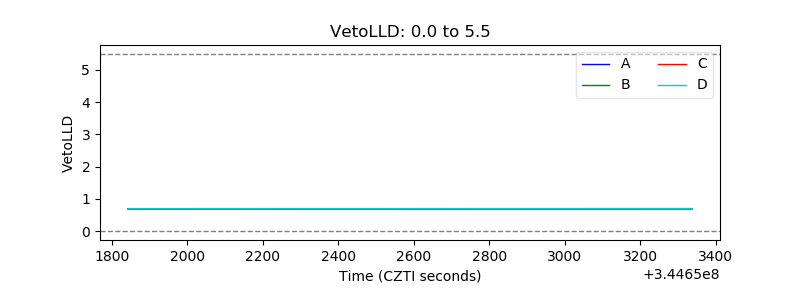 |
| Alpha Counter | 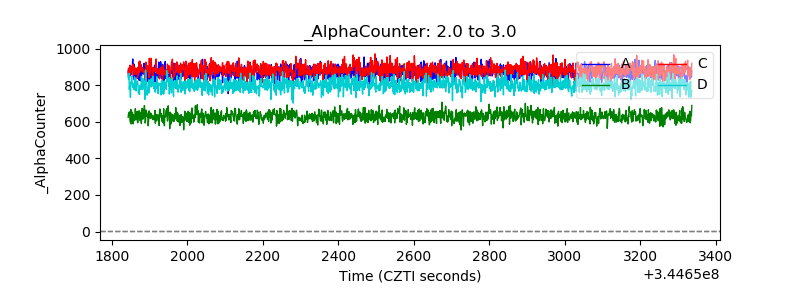 |
| _CPM_Rate | 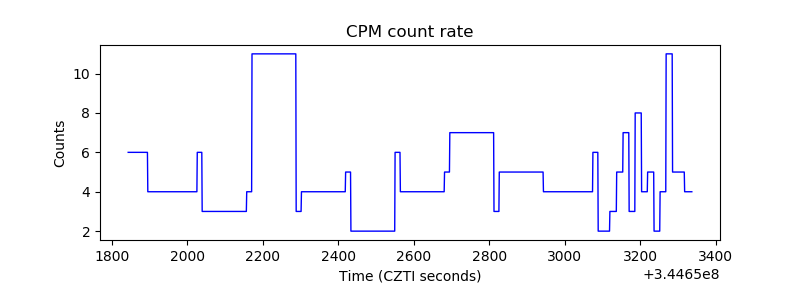 |
| CZT Counter |  |
| +2.5 Volts monitor |  |
| +5 Volts monitor | 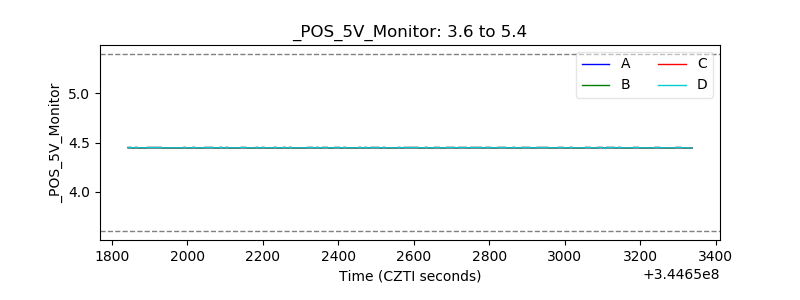 |
| _ROLL_ROT | 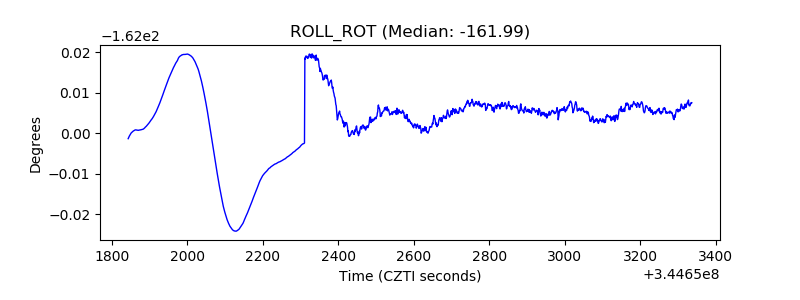 |
| _Roll_DEC | 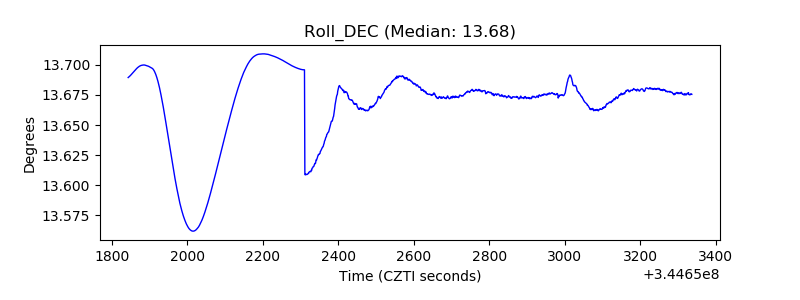 |
| _Roll_RA | 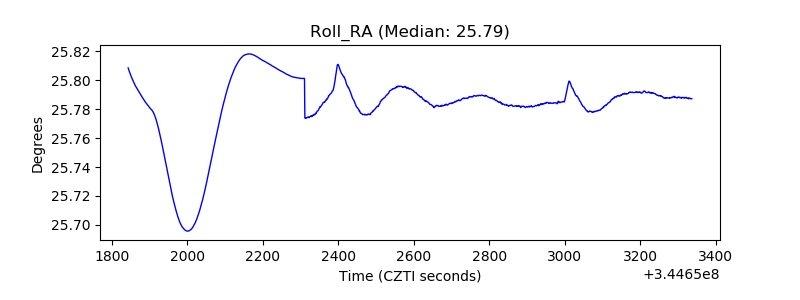 |
| Veto Counter |  |