| Param | Original file | Final file |
|---|---|---|
| Filename | modeM0/AS1A10_045T01_9000004046_28018cztM0_level2.evt | modeM0/AS1A10_045T01_9000004046_28018cztM0_level2_quad_clean.evt |
| Size (bytes) | 495,262,080 | 76,322,880 |
| Size | 472.3 MB | 72.8 MB |
| Events in quadrant A | 3,096,938 | 486,113 |
| Events in quadrant B | 3,192,645 | 479,706 |
| Events in quadrant C | 3,300,341 | 455,980 |
| Events in quadrant D | 4,971,082 | 438,899 |
| Mode M9 | |||
|---|---|---|---|
| Quadrant | BADHDUFLAG | Total packets | Discarded packets |
| A | 0 | 9 | 0 |
| B | 0 | 9 | 0 |
| C | 0 | 9 | 0 |
| D | 0 | 9 | 0 |
| Mode M0 | |||
|---|---|---|---|
| Quadrant | BADHDUFLAG | Total packets | Discarded packets |
| A | 0 | 13126 | 0 |
| B | 0 | 13463 | 0 |
| C | 0 | 13696 | 0 |
| D | 0 | 19131 | 0 |
| Quadrant | Total seconds | Saturated seconds | Saturation percentage |
|---|---|---|---|
| A | 6449 | 16 | 0.248100% |
| B | 6449 | 34 | 0.527214% |
| C | 6449 | 87 | 1.349046% |
| D | 6448 | 396 | 6.141439% |
Noise dominated data is calculated using 1-second bins in cleaned event files. If a bin has >2000 counts, and if more than 50% of those come from <1% of pixels, then it is considered to be noise-dominated and hence unusable.
| Quadrant | # 1 sec bins | Bins with >0 counts | Bins with >2000 counts | High rate bins dominated by noise | Noise dominated (total time) | Noise dominated (detector-on time) | Marked lightcurve |
|---|---|---|---|---|---|---|---|
| A | 7394 | 6450 | 0 | 0 | 0.00% | 0.00% | 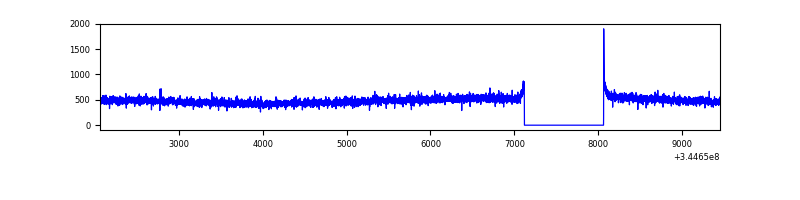 |
| B | 7394 | 6450 | 9 | 9 | 0.12% | 0.14% | 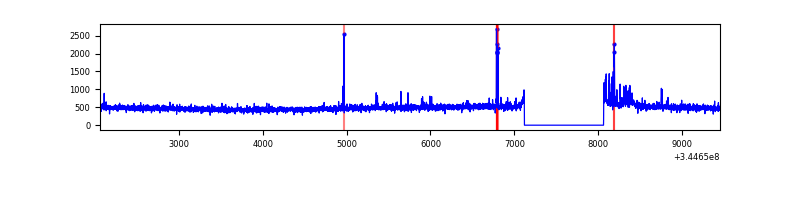 |
| C | 7394 | 6449 | 25 | 25 | 0.34% | 0.39% | 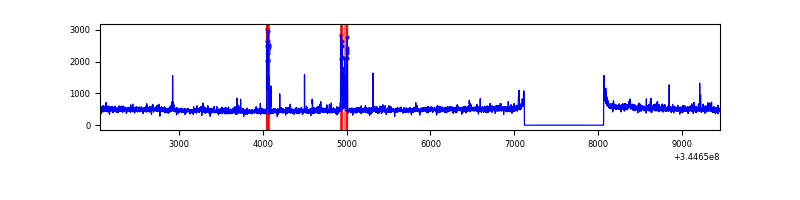 |
| D | 7393 | 6448 | 354 | 354 | 4.79% | 5.49% | 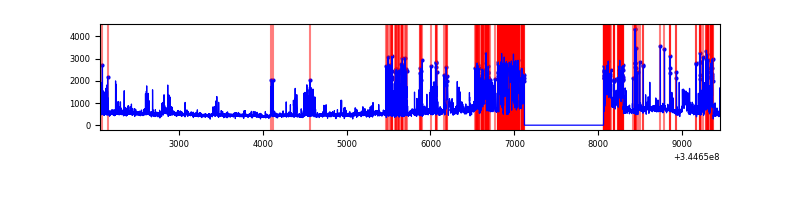 |
Top three noisy pixels from each quadrant. If the there are fewer than three noisy pixels in the level2.evt file, extra rows are filled as -1
| Pixel properties | Quadrant properties | ||||||
|---|---|---|---|---|---|---|---|
| Quadrant | DetID | PixID | Counts | Sigma | Mean | Median | Sigma |
| A | 0 | 13 | 19427 | 116.43 | 796 | 780 | 160.2 |
| A | 13 | 254 | 10304 | 59.47 | 796 | 780 | 160.2 |
| A | 3 | 137 | 7693 | 43.16 | 796 | 780 | 160.2 |
| B | 10 | 245 | 80665 | 520.21 | 788 | 767 | 153.6 |
| B | 12 | 111 | 19196 | 119.99 | 788 | 767 | 153.6 |
| B | 11 | 111 | 17301 | 107.65 | 788 | 767 | 153.6 |
| C | 2 | 16 | 127914 | 706.87 | 761 | 768 | 179.9 |
| C | 14 | 238 | 121149 | 669.26 | 761 | 768 | 179.9 |
| C | 3 | 233 | 84350 | 464.67 | 761 | 768 | 179.9 |
| D | 1 | 52 | 1313968 | 7205.1 | 755 | 736 | 182.3 |
| D | 8 | 195 | 626994 | 3435.99 | 755 | 736 | 182.3 |
| D | 7 | 80 | 114328 | 623.23 | 755 | 736 | 182.3 |
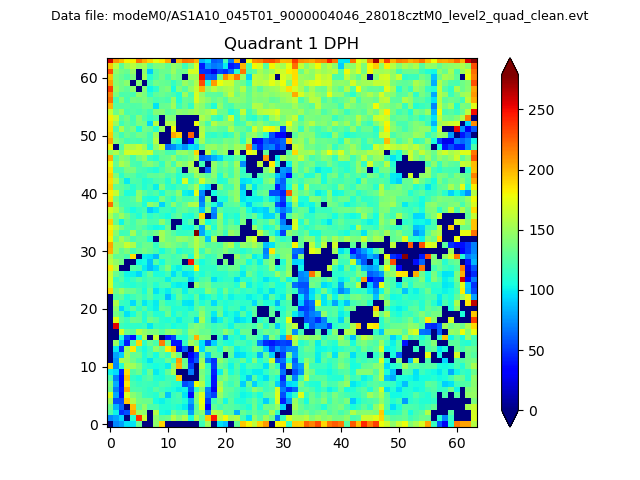
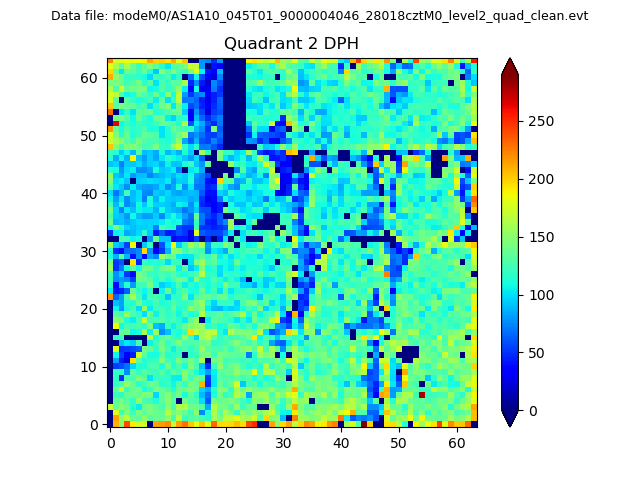
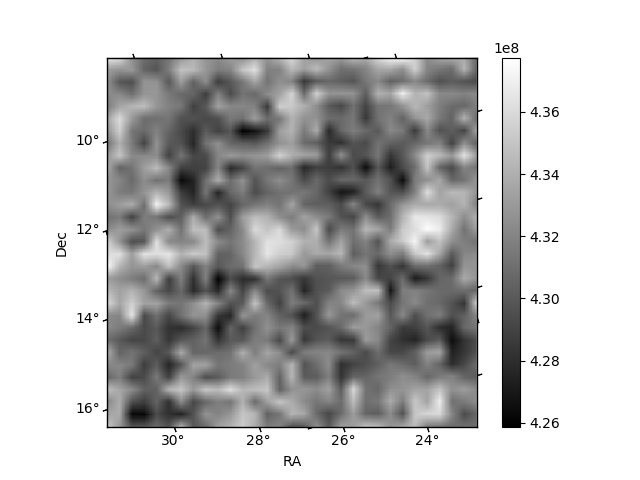
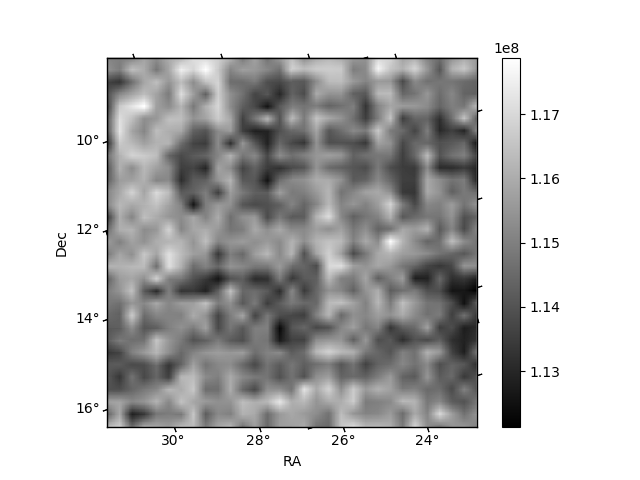
Histogram calculated using DETX and DETY for each event in the final _common_clean file
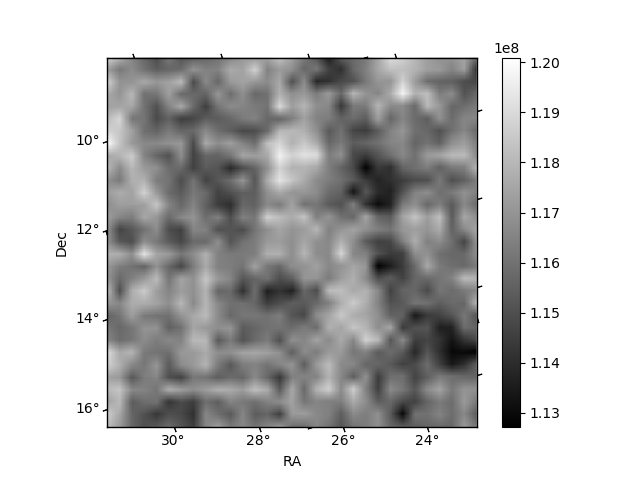
| Quadrant A |  |
 |
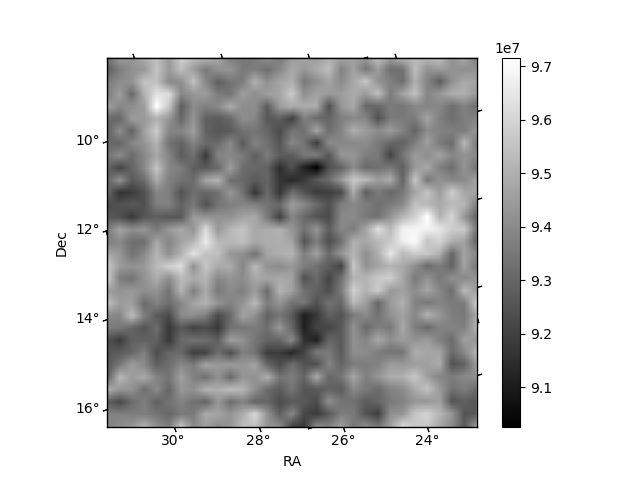
Quadrant B |
|---|---|---|---|
| Quadrant D | 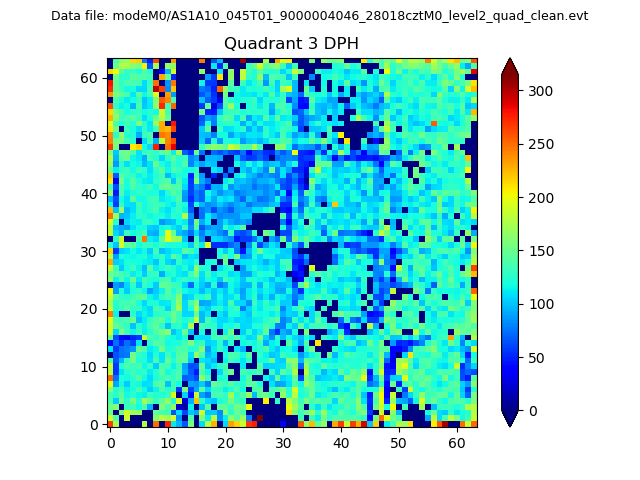 |
 |
Quadrant C |
| Plot type | Count rate plots | Images |
|---|---|---|
| Comparison with Poisson distribution Blue bars denote a histogram of data divided into 1 sec bins. Red curve is a Poisson curve with rate = median count rate of data. |
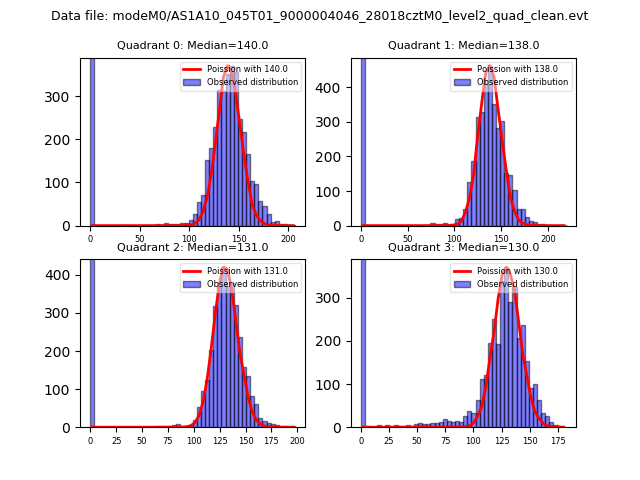 |
 |
| Quadrant-wise count rates Data is divided into 100 sec bins |
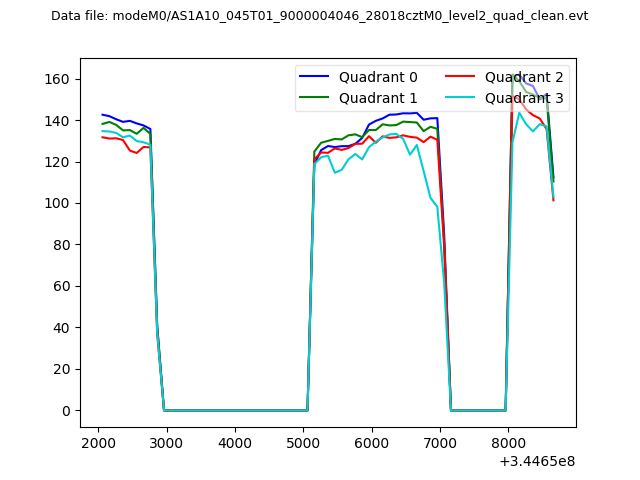 |
|
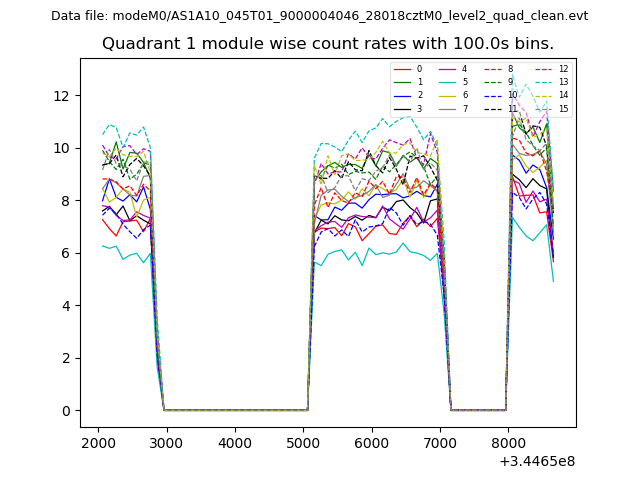
| Module-wise count rates for Quadrant A Data is divided into 100 sec bins |
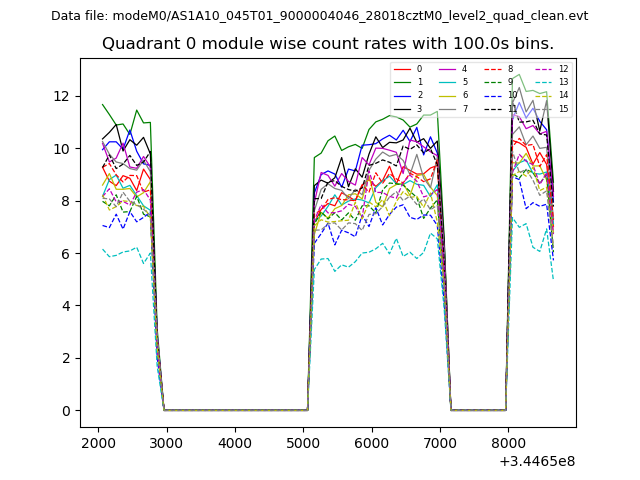 |
 |
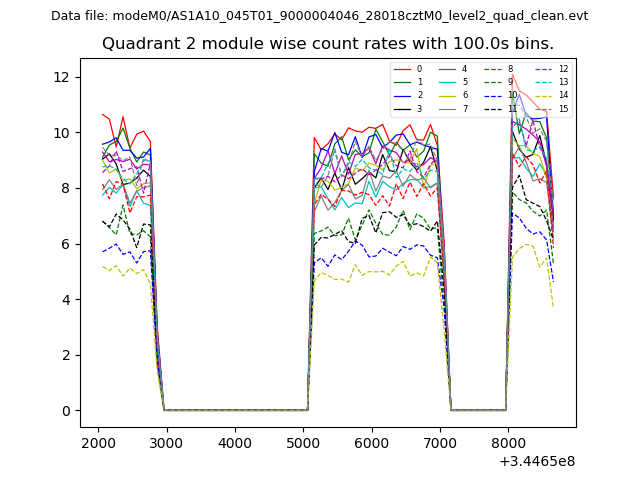
| Module-wise count rates for Quadrant B Data is divided into 100 sec bins |
 |
 |
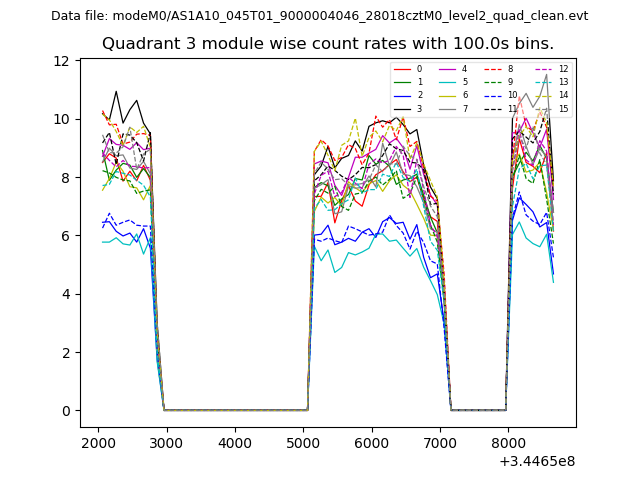
| Module-wise count rates for Quadrant C Data is divided into 100 sec bins |
 |
 |
| Module-wise count rates for Quadrant D Data is divided into 100 sec bins |
 |
 |
| Parameter | Plot |
|---|---|
| CZT HV Monitor | 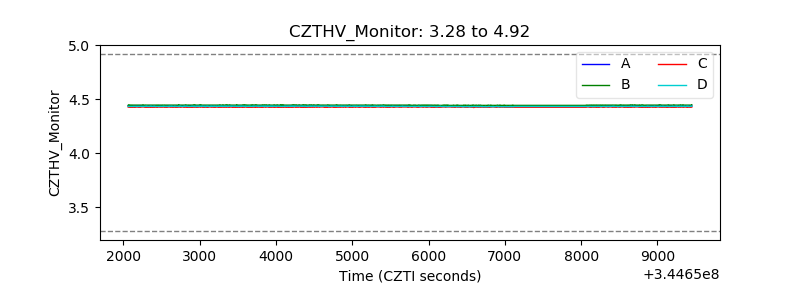 |
| D_VDD | 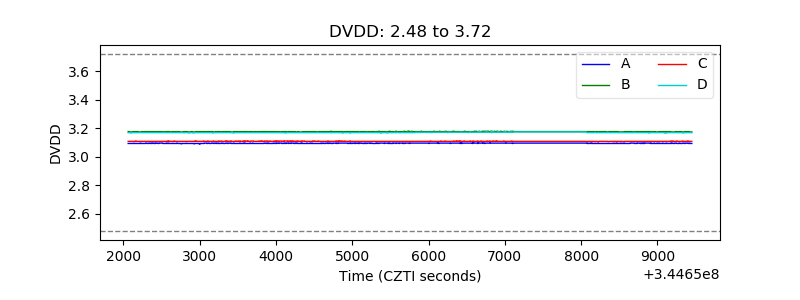 |
| Temperature 1 | 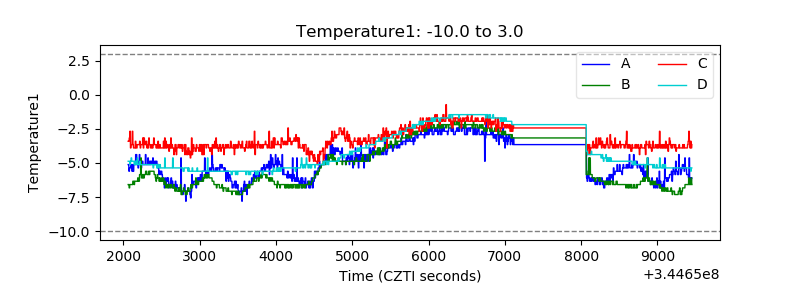 |
| Veto HV Monitor | 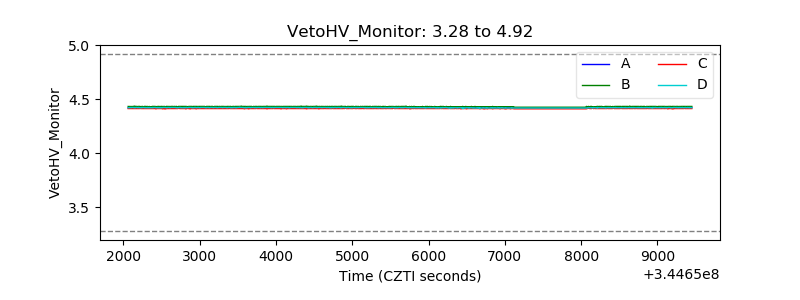 |
| Veto LLD | 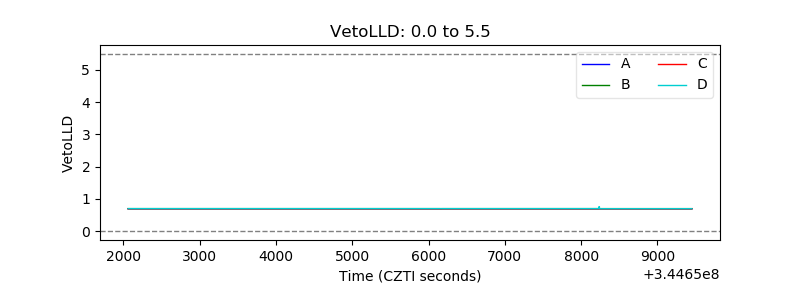 |
| Alpha Counter | 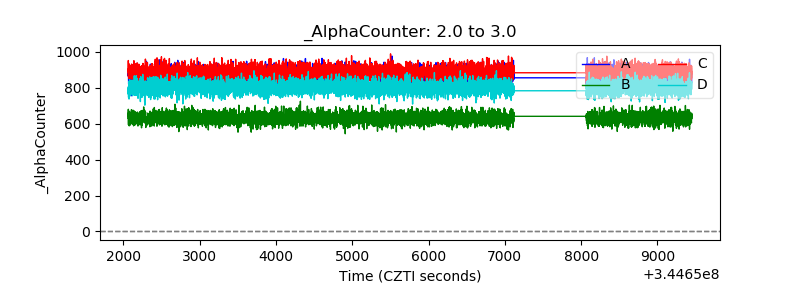 |
| _CPM_Rate | 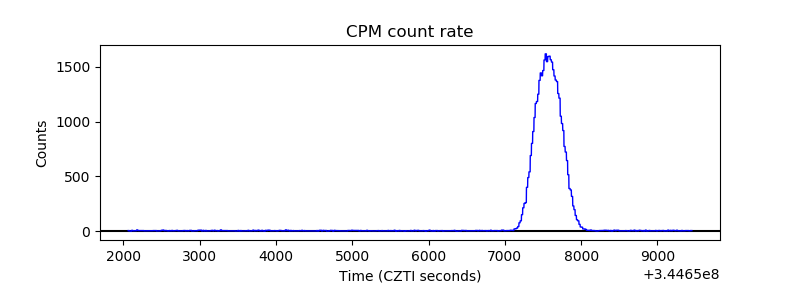 |
| CZT Counter | 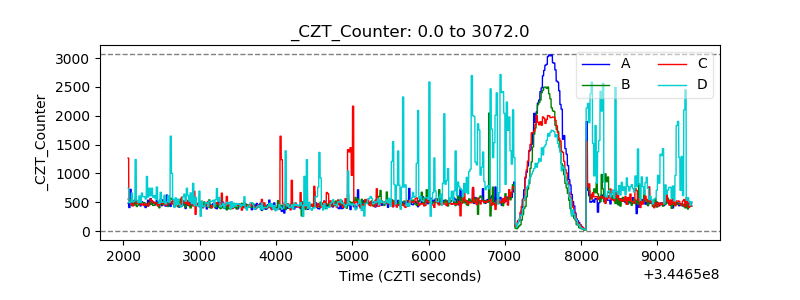 |
| +2.5 Volts monitor | 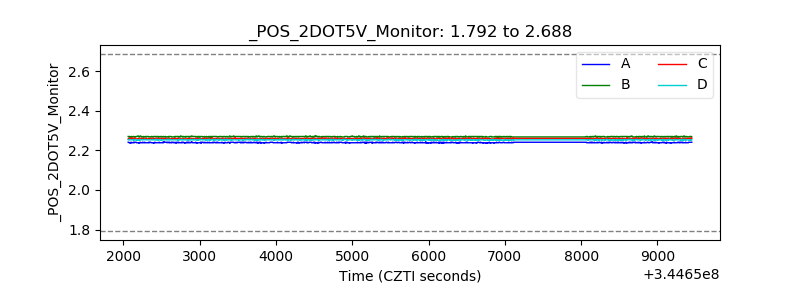 |
| +5 Volts monitor | 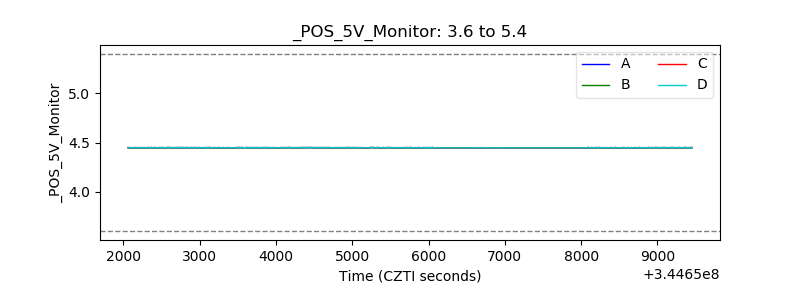 |
| _ROLL_ROT | 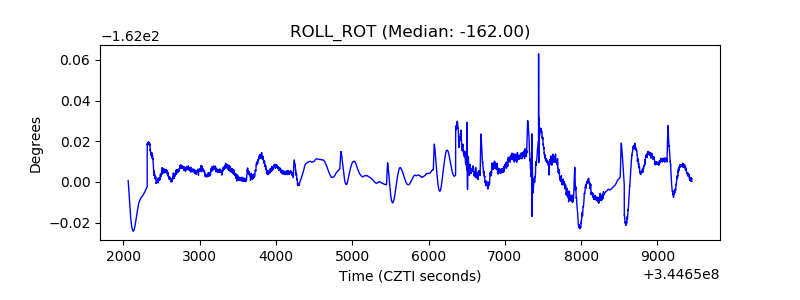 |
| _Roll_DEC |  |
| _Roll_RA | 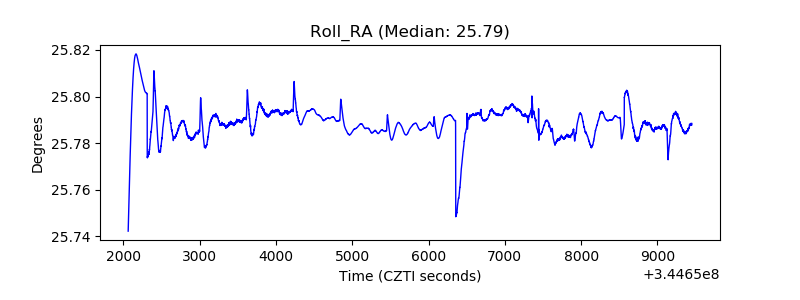 |
| Veto Counter | 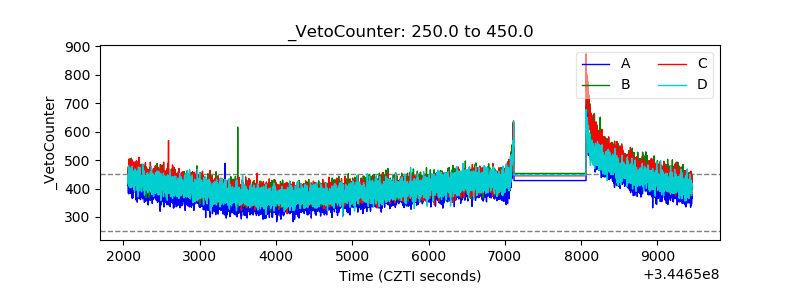 |