| Param | Original file | Final file |
|---|---|---|
| Filename | modeM0/AS1A10_045T01_9000004046_28019cztM0_level2.evt | modeM0/AS1A10_045T01_9000004046_28019cztM0_level2_quad_clean.evt |
| Size (bytes) | 548,147,520 | 69,436,800 |
| Size | 522.8 MB | 66.2 MB |
| Events in quadrant A | 3,202,796 | 432,633 |
| Events in quadrant B | 3,272,600 | 428,616 |
| Events in quadrant C | 3,797,244 | 400,673 |
| Events in quadrant D | 5,892,437 | 391,999 |
| Mode M9 | |||
|---|---|---|---|
| Quadrant | BADHDUFLAG | Total packets | Discarded packets |
| A | 0 | 10 | 0 |
| B | 0 | 10 | 0 |
| C | 0 | 10 | 0 |
| D | 0 | 10 | 0 |
| Mode M0 | |||
|---|---|---|---|
| Quadrant | BADHDUFLAG | Total packets | Discarded packets |
| A | 0 | 13340 | 0 |
| B | 0 | 13651 | 0 |
| C | 0 | 15407 | 0 |
| D | 0 | 21953 | 0 |
| Quadrant | Total seconds | Saturated seconds | Saturation percentage |
|---|---|---|---|
| A | 6420 | 37 | 0.576324% |
| B | 6421 | 58 | 0.903286% |
| C | 6420 | 131 | 2.040498% |
| D | 6420 | 740 | 11.526480% |
Noise dominated data is calculated using 1-second bins in cleaned event files. If a bin has >2000 counts, and if more than 50% of those come from <1% of pixels, then it is considered to be noise-dominated and hence unusable.
| Quadrant | # 1 sec bins | Bins with >0 counts | Bins with >2000 counts | High rate bins dominated by noise | Noise dominated (total time) | Noise dominated (detector-on time) | Marked lightcurve |
|---|---|---|---|---|---|---|---|
| A | 7485 | 6420 | 0 | 0 | 0.00% | 0.00% | 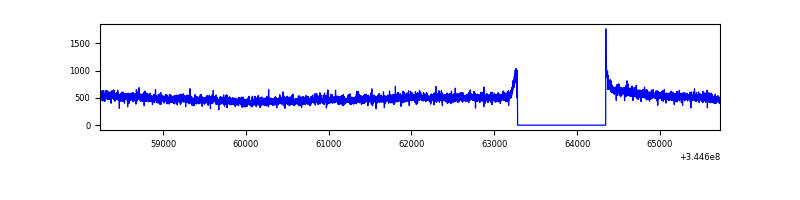 |
| B | 7486 | 6421 | 1 | 1 | 0.01% | 0.02% | 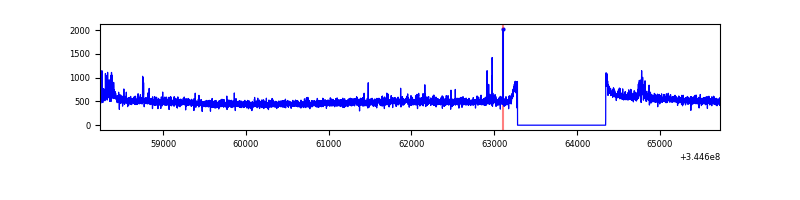 |
| C | 7485 | 6420 | 13 | 13 | 0.17% | 0.20% | 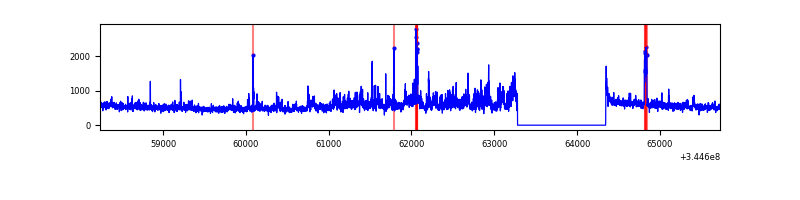 |
| D | 7485 | 6420 | 703 | 703 | 9.39% | 10.95% | 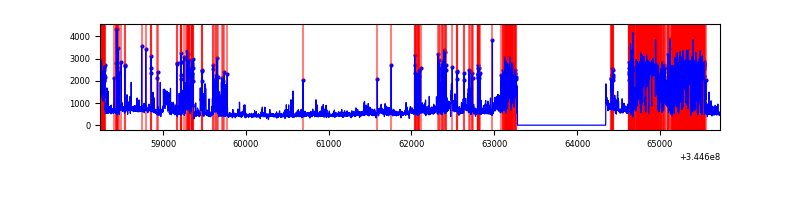 |
Top three noisy pixels from each quadrant. If the there are fewer than three noisy pixels in the level2.evt file, extra rows are filled as -1
| Pixel properties | Quadrant properties | ||||||
|---|---|---|---|---|---|---|---|
| Quadrant | DetID | PixID | Counts | Sigma | Mean | Median | Sigma |
| A | 0 | 13 | 17732 | 102.11 | 825 | 810 | 165.7 |
| A | 13 | 254 | 10396 | 57.85 | 825 | 810 | 165.7 |
| A | 3 | 137 | 7794 | 42.14 | 825 | 810 | 165.7 |
| B | 10 | 245 | 55261 | 348.38 | 816 | 797 | 156.3 |
| B | 12 | 111 | 19460 | 119.38 | 816 | 797 | 156.3 |
| B | 11 | 111 | 17667 | 107.91 | 816 | 797 | 156.3 |
| C | 3 | 233 | 609458 | 3316.72 | 783 | 790 | 183.5 |
| C | 14 | 238 | 127425 | 690.05 | 783 | 790 | 183.5 |
| C | 2 | 16 | 11746 | 59.7 | 783 | 790 | 183.5 |
| D | 1 | 52 | 2403701 | 13176.62 | 751 | 732 | 182.4 |
| D | 8 | 195 | 467170 | 2557.7 | 751 | 732 | 182.4 |
| D | 7 | 80 | 158615 | 865.75 | 751 | 732 | 182.4 |
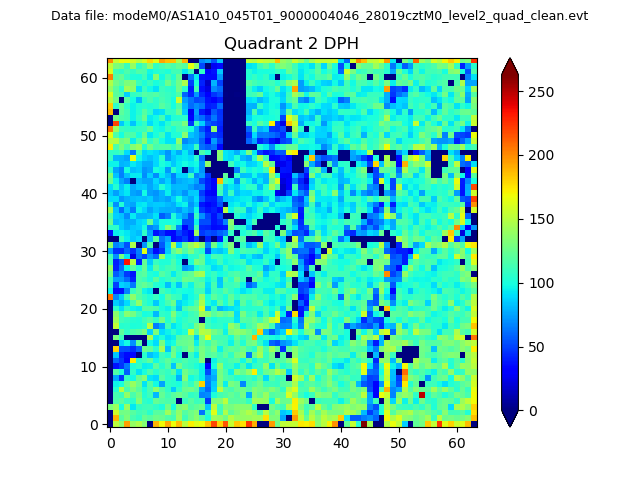
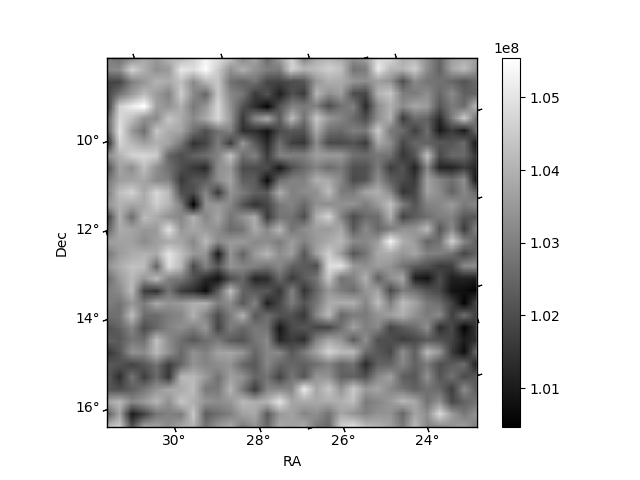
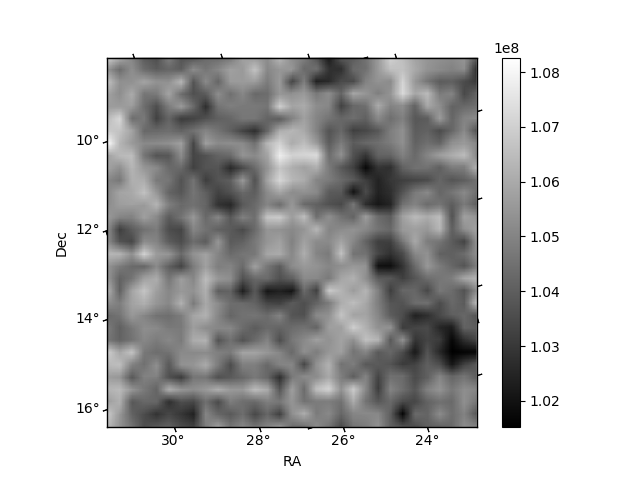
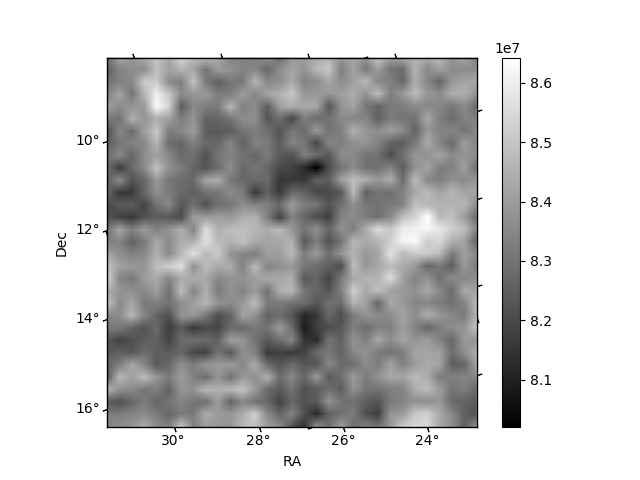
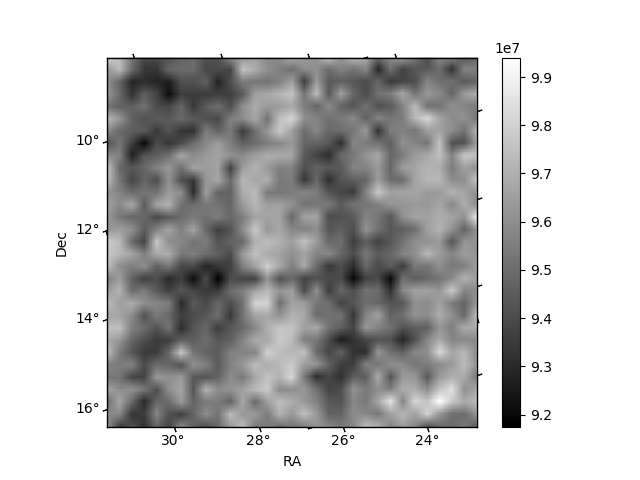
Histogram calculated using DETX and DETY for each event in the final _common_clean file
| Quadrant A | 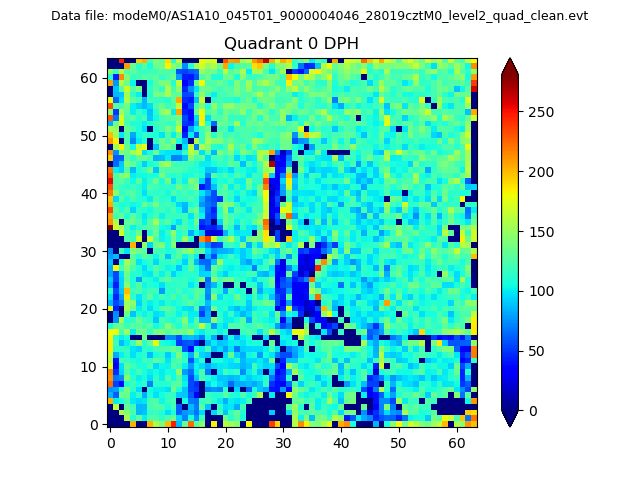 |
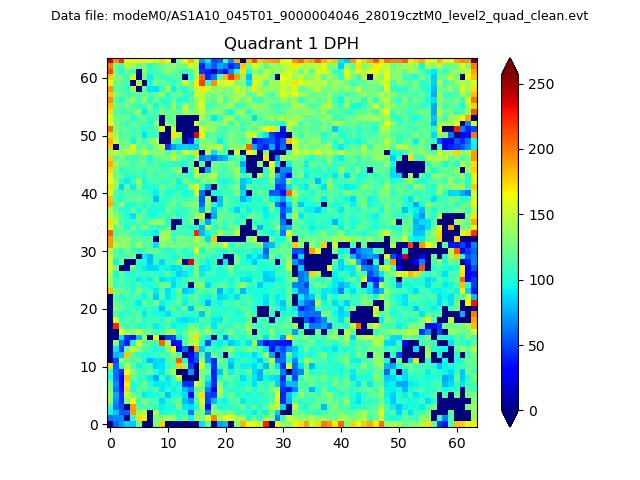 |
Quadrant B |
|---|---|---|---|
| Quadrant D | 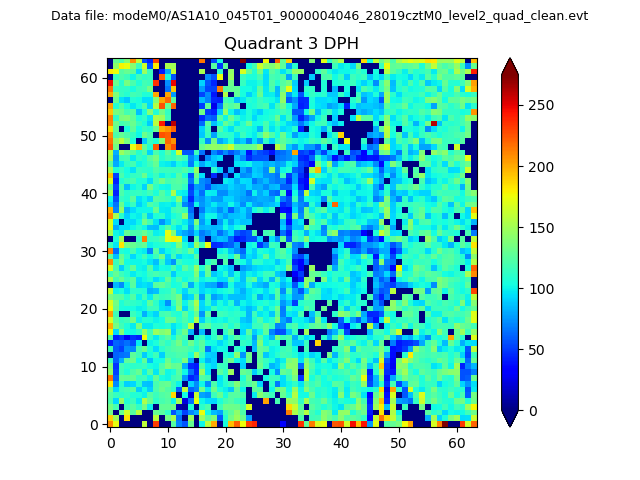 |
 |
Quadrant C |
| Plot type | Count rate plots | Images |
|---|---|---|
| Comparison with Poisson distribution Blue bars denote a histogram of data divided into 1 sec bins. Red curve is a Poisson curve with rate = median count rate of data. |
 |
 |
| Quadrant-wise count rates Data is divided into 100 sec bins |
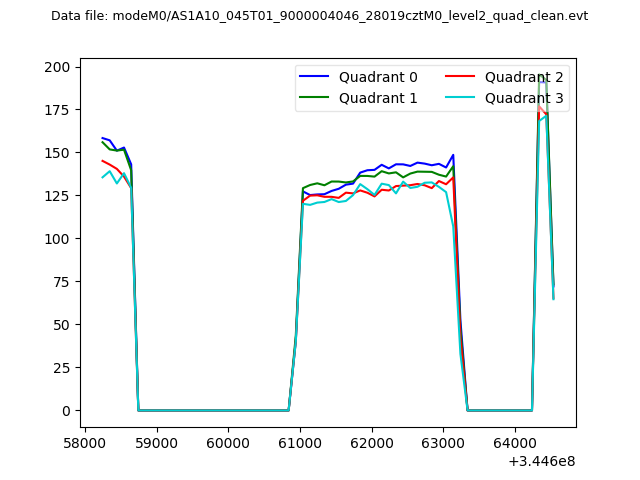 |
|
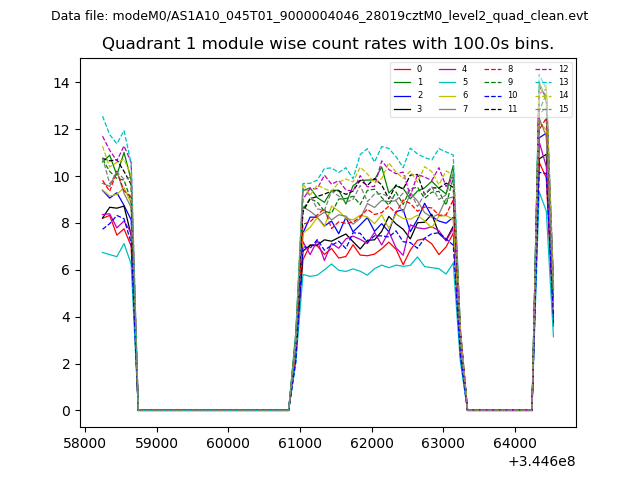
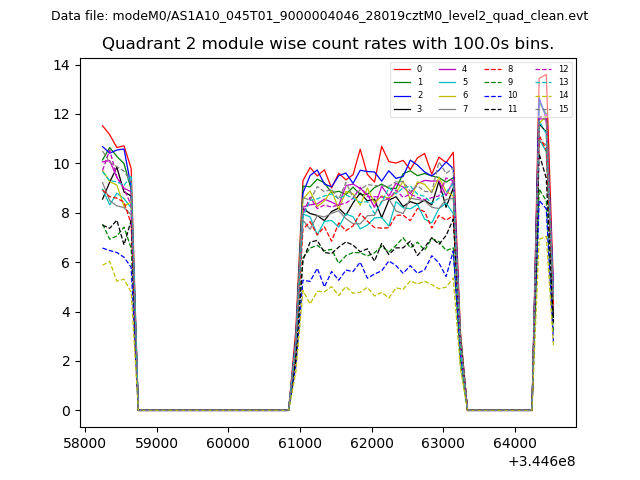
| Module-wise count rates for Quadrant A Data is divided into 100 sec bins |
 |
 |
| Module-wise count rates for Quadrant B Data is divided into 100 sec bins |
 |
 |
| Module-wise count rates for Quadrant C Data is divided into 100 sec bins |
 |
 |
| Module-wise count rates for Quadrant D Data is divided into 100 sec bins |
 |
 |
| Parameter | Plot |
|---|---|
| CZT HV Monitor | 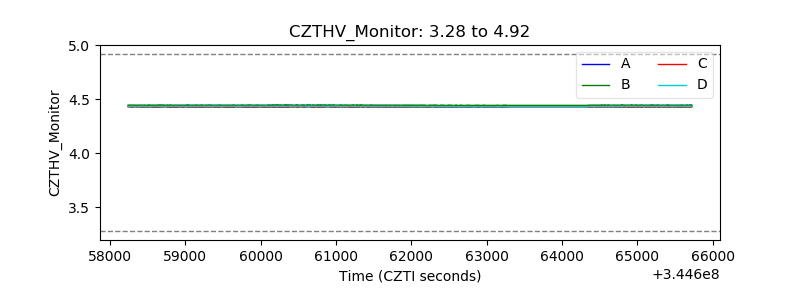 |
| D_VDD | 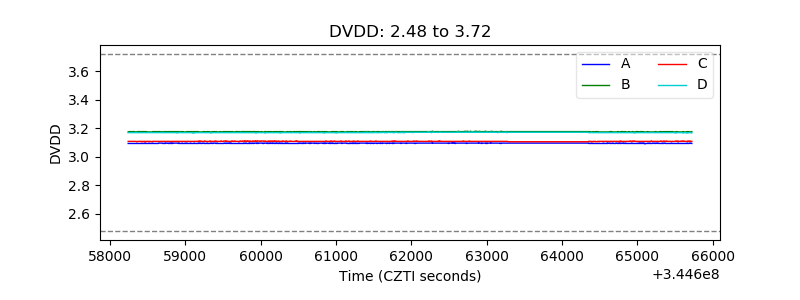 |
| Temperature 1 | 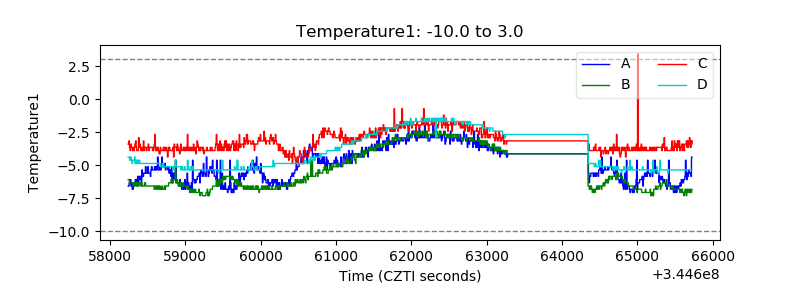 |
| Veto HV Monitor | 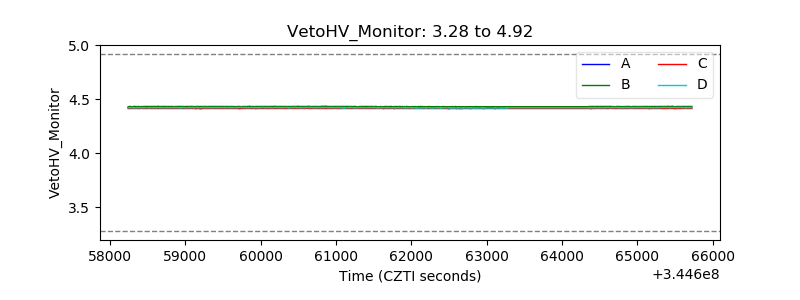 |
| Veto LLD | 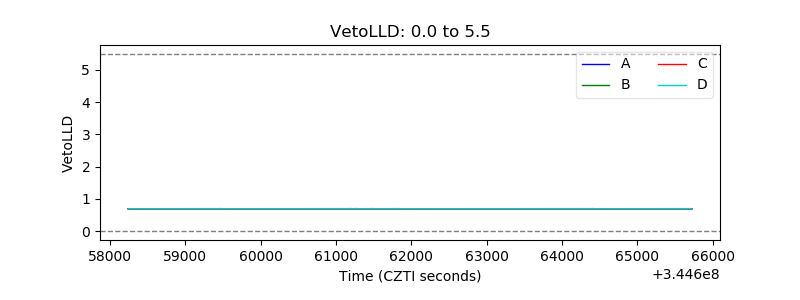 |
| Alpha Counter | 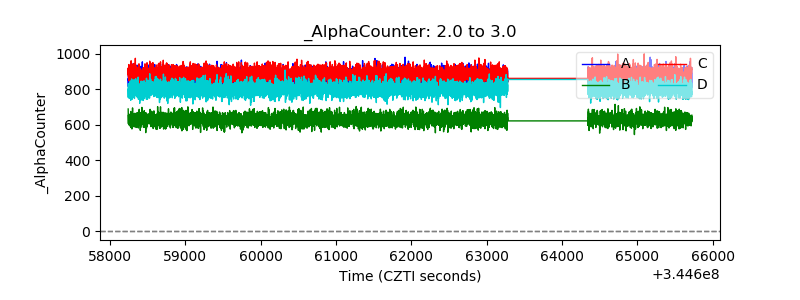 |
| _CPM_Rate | 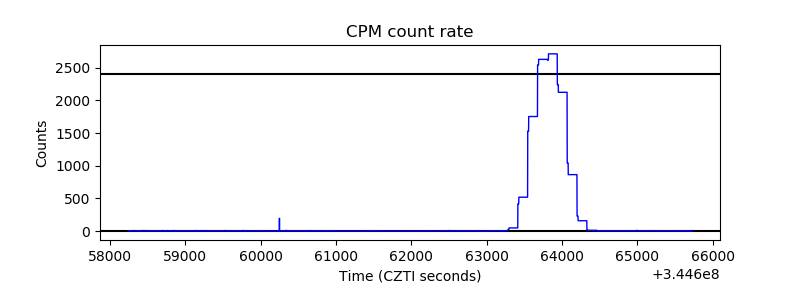 |
| CZT Counter |  |
| +2.5 Volts monitor |  |
| +5 Volts monitor | 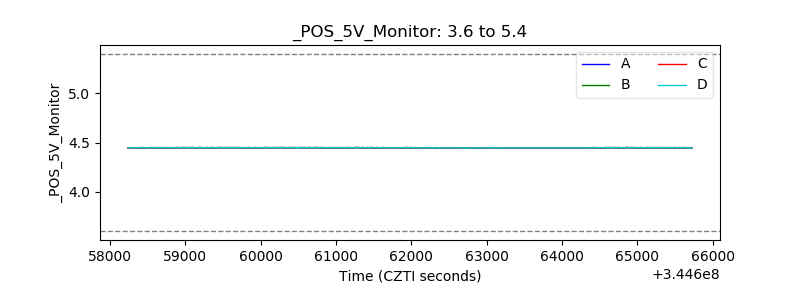 |
| _ROLL_ROT |  |
| _Roll_DEC |  |
| _Roll_RA |  |
| Veto Counter |  |