| Param | Original file | Final file |
|---|---|---|
| Filename | modeM0/AS1A10_045T01_9000004046_28021cztM0_level2.evt | modeM0/AS1A10_045T01_9000004046_28021cztM0_level2_quad_clean.evt |
| Size (bytes) | 573,485,760 | 66,683,520 |
| Size | 546.9 MB | 63.6 MB |
| Events in quadrant A | 3,415,371 | 408,566 |
| Events in quadrant B | 3,456,912 | 406,172 |
| Events in quadrant C | 3,682,475 | 382,037 |
| Events in quadrant D | 6,379,265 | 375,016 |
| Mode M9 | |||
|---|---|---|---|
| Quadrant | BADHDUFLAG | Total packets | Discarded packets |
| A | 0 | 13 | 0 |
| B | 0 | 14 | 0 |
| C | 0 | 14 | 0 |
| D | 0 | 14 | 0 |
| Mode M0 | |||
|---|---|---|---|
| Quadrant | BADHDUFLAG | Total packets | Discarded packets |
| A | 0 | 14012 | 0 |
| B | 0 | 14171 | 0 |
| C | 0 | 15061 | 0 |
| D | 0 | 23516 | 0 |
| Quadrant | Total seconds | Saturated seconds | Saturation percentage |
|---|---|---|---|
| A | 6408 | 41 | 0.639825% |
| B | 6408 | 67 | 1.045568% |
| C | 6408 | 143 | 2.231586% |
| D | 6408 | 736 | 11.485643% |
Noise dominated data is calculated using 1-second bins in cleaned event files. If a bin has >2000 counts, and if more than 50% of those come from <1% of pixels, then it is considered to be noise-dominated and hence unusable.
| Quadrant | # 1 sec bins | Bins with >0 counts | Bins with >2000 counts | High rate bins dominated by noise | Noise dominated (total time) | Noise dominated (detector-on time) | Marked lightcurve |
|---|---|---|---|---|---|---|---|
| A | 7608 | 6408 | 1 | 1 | 0.01% | 0.02% |  |
| B | 7608 | 6408 | 0 | 0 | 0.00% | 0.00% |  |
| C | 7608 | 6408 | 7 | 7 | 0.09% | 0.11% |  |
| D | 7608 | 6408 | 710 | 710 | 9.33% | 11.08% | 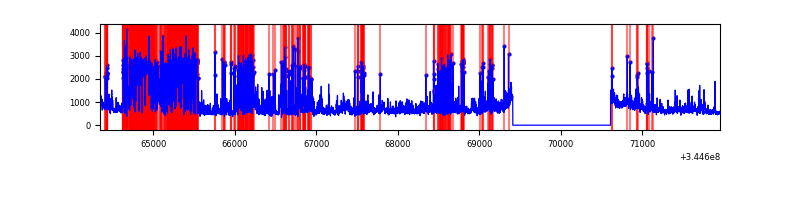 |
Top three noisy pixels from each quadrant. If the there are fewer than three noisy pixels in the level2.evt file, extra rows are filled as -1
| Pixel properties | Quadrant properties | ||||||
|---|---|---|---|---|---|---|---|
| Quadrant | DetID | PixID | Counts | Sigma | Mean | Median | Sigma |
| A | 13 | 254 | 9927 | 51.95 | 881 | 866 | 174.4 |
| A | 0 | 13 | 9036 | 46.84 | 881 | 866 | 174.4 |
| A | 8 | 192 | 8022 | 41.03 | 881 | 866 | 174.4 |
| B | 10 | 245 | 27696 | 162.62 | 873 | 853 | 165.1 |
| B | 12 | 111 | 19987 | 115.92 | 873 | 853 | 165.1 |
| B | 11 | 111 | 17856 | 103.01 | 873 | 853 | 165.1 |
| C | 3 | 233 | 289153 | 1488.61 | 833 | 840 | 193.7 |
| C | 14 | 238 | 136562 | 700.76 | 833 | 840 | 193.7 |
| C | 2 | 16 | 14912 | 72.66 | 833 | 840 | 193.7 |
| D | 1 | 52 | 2463018 | 12983.45 | 799 | 780 | 189.6 |
| D | 8 | 195 | 713335 | 3757.32 | 799 | 780 | 189.6 |
| D | 7 | 80 | 93765 | 490.31 | 799 | 780 | 189.6 |
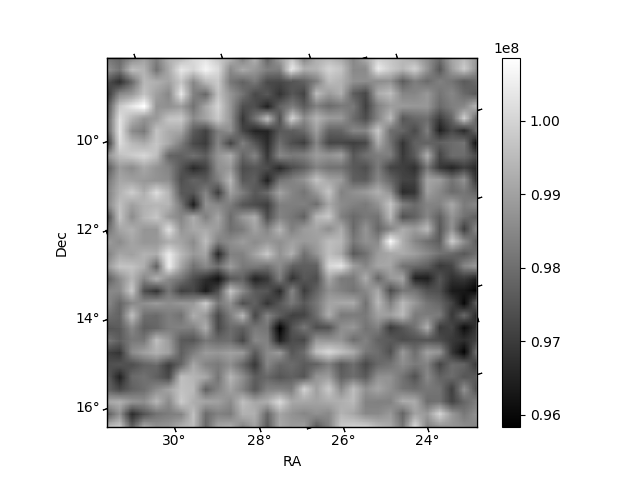
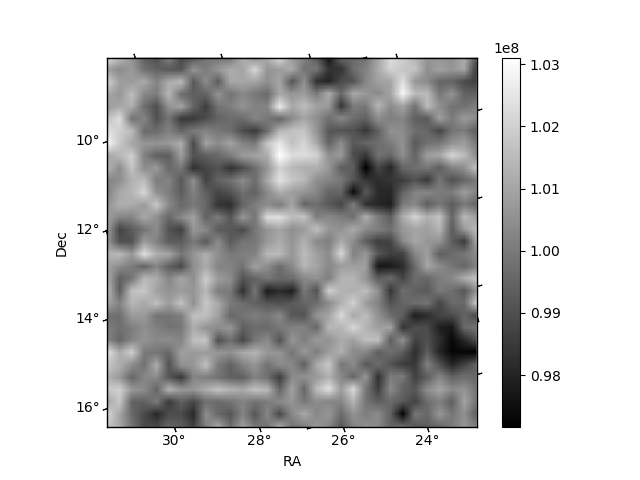
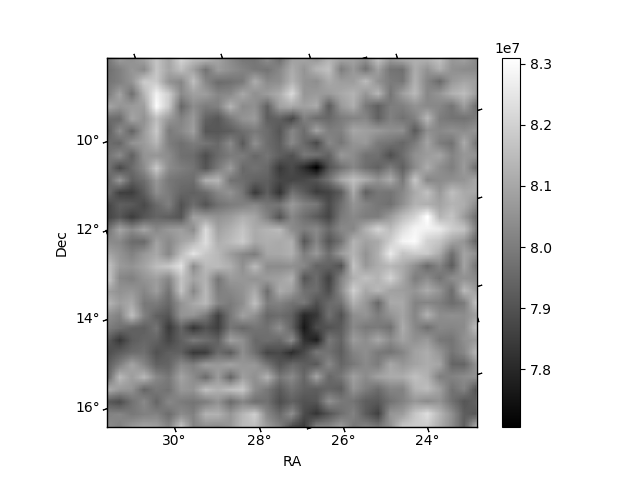
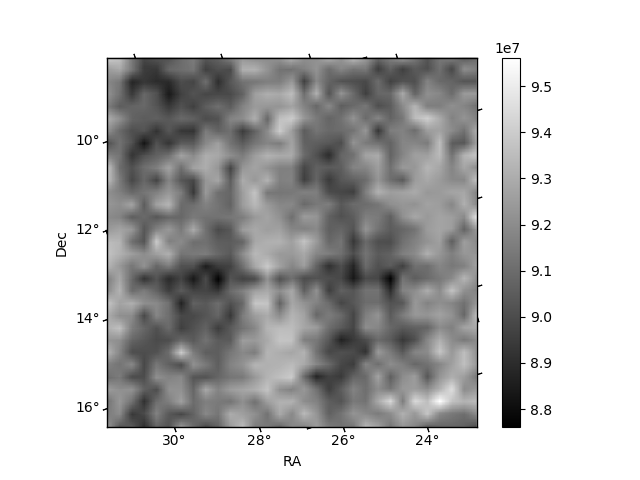
Histogram calculated using DETX and DETY for each event in the final _common_clean file
| Quadrant A |  |
 |
Quadrant B |
|---|---|---|---|
| Quadrant D |  |
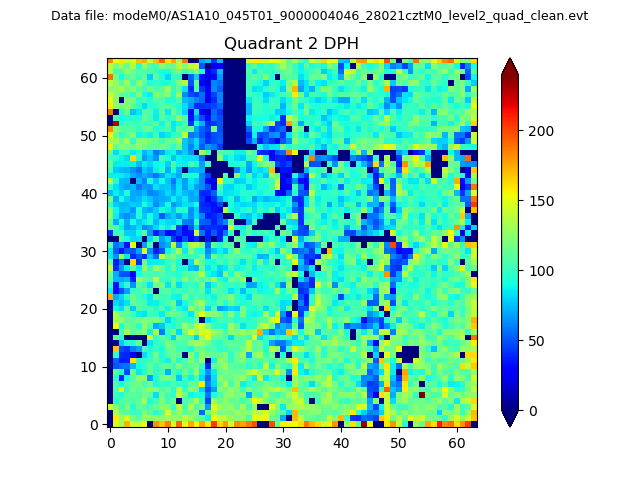 |
Quadrant C |
| Plot type | Count rate plots | Images |
|---|---|---|
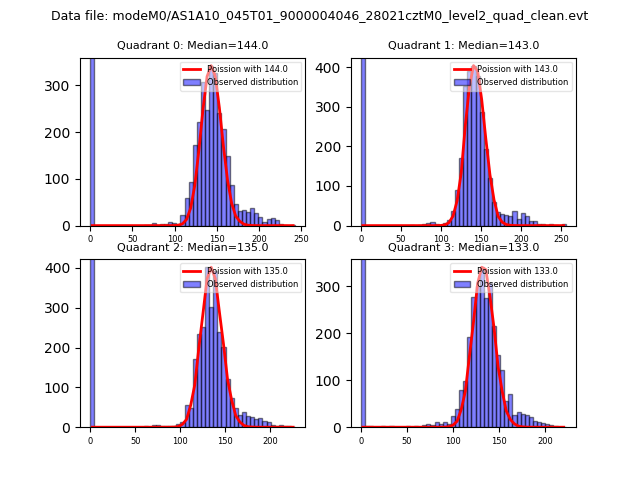
| Comparison with Poisson distribution Blue bars denote a histogram of data divided into 1 sec bins. Red curve is a Poisson curve with rate = median count rate of data. |
 |
 |
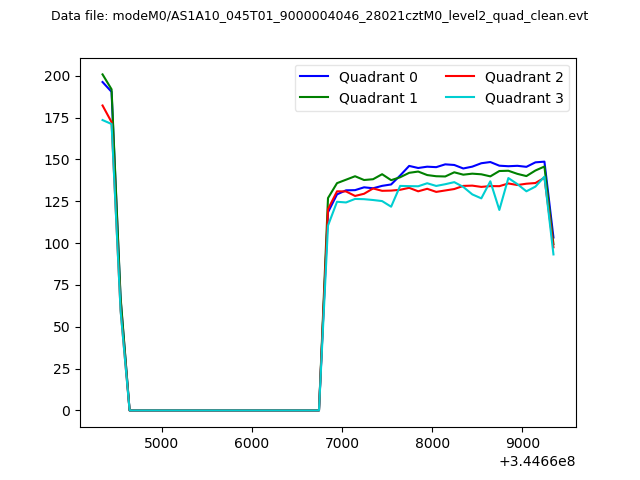
| Quadrant-wise count rates Data is divided into 100 sec bins |
 |
|
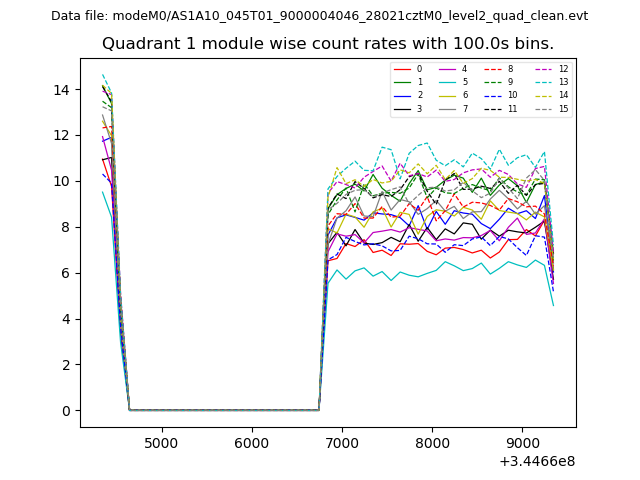
| Module-wise count rates for Quadrant A Data is divided into 100 sec bins |
 |
 |
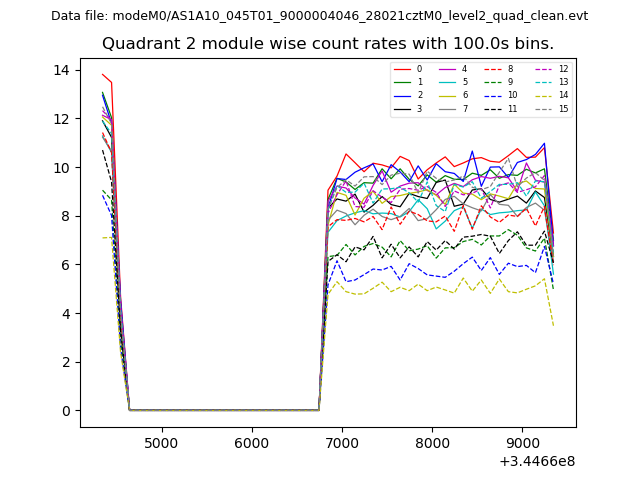
| Module-wise count rates for Quadrant B Data is divided into 100 sec bins |
 |
 |
| Module-wise count rates for Quadrant C Data is divided into 100 sec bins |
 |
 |
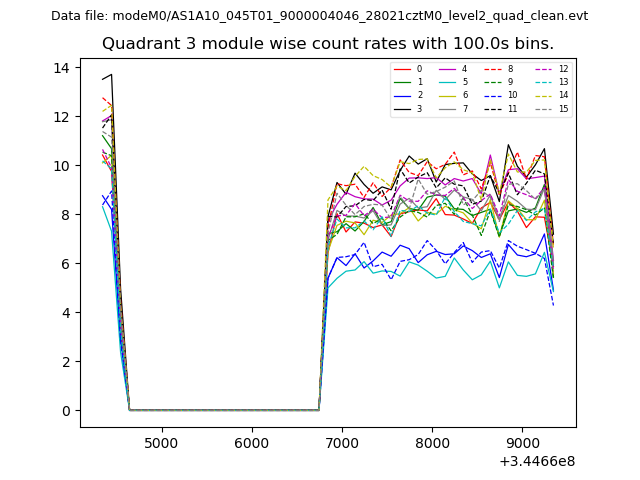
| Module-wise count rates for Quadrant D Data is divided into 100 sec bins |
 |
 |
| Parameter | Plot |
|---|---|
| CZT HV Monitor |  |
| D_VDD | 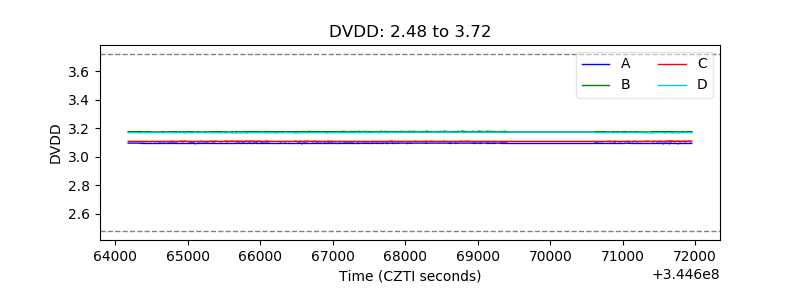 |
| Temperature 1 | 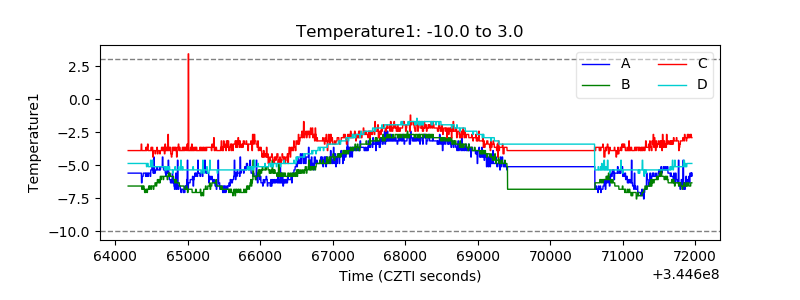 |
| Veto HV Monitor | 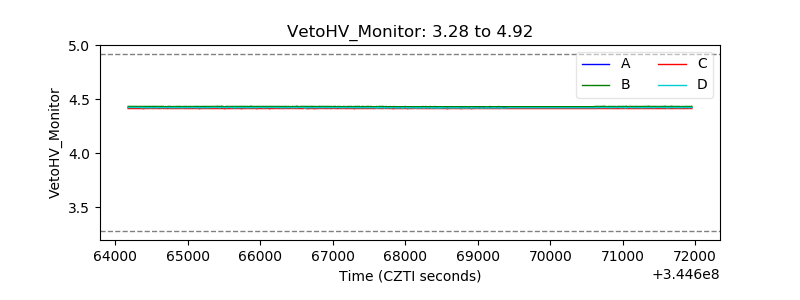 |
| Veto LLD | 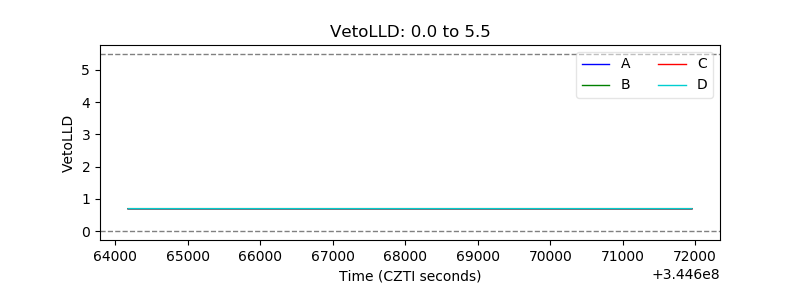 |
| Alpha Counter | 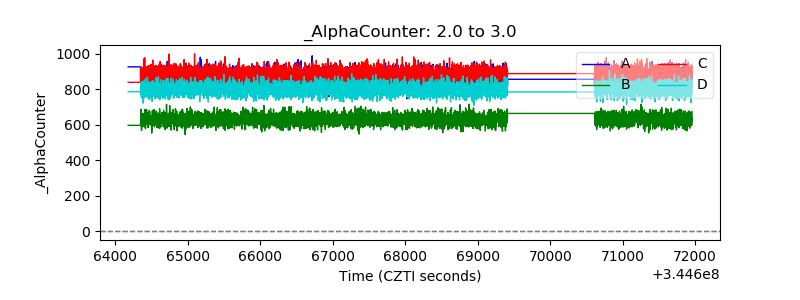 |
| _CPM_Rate | 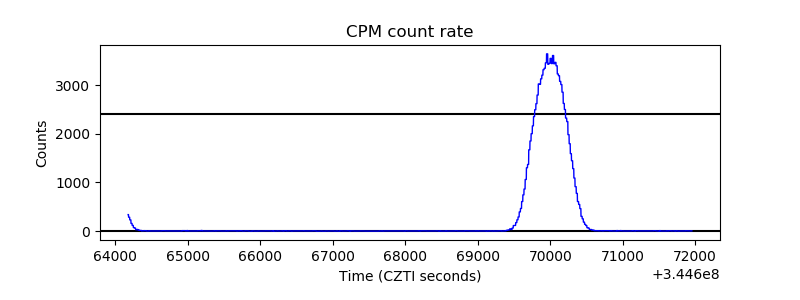 |
| CZT Counter | 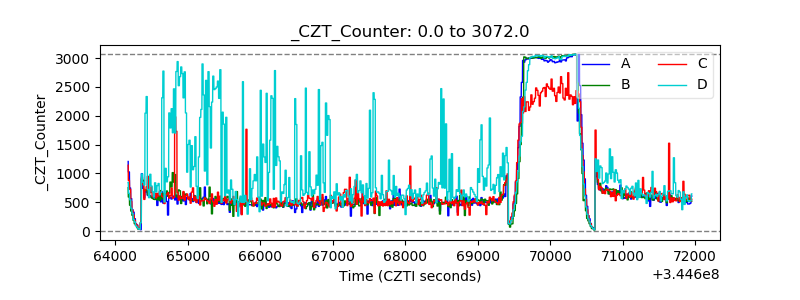 |
| +2.5 Volts monitor |  |
| +5 Volts monitor |  |
| _ROLL_ROT | 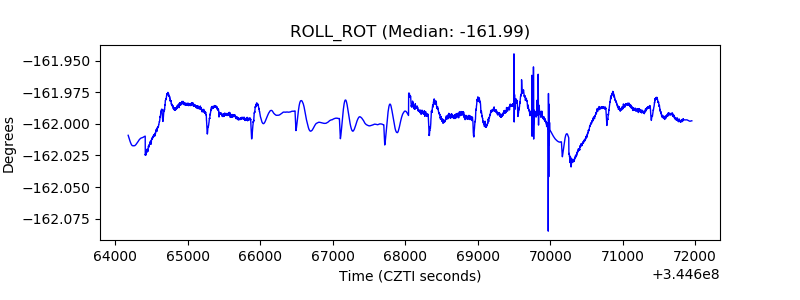 |
| _Roll_DEC | 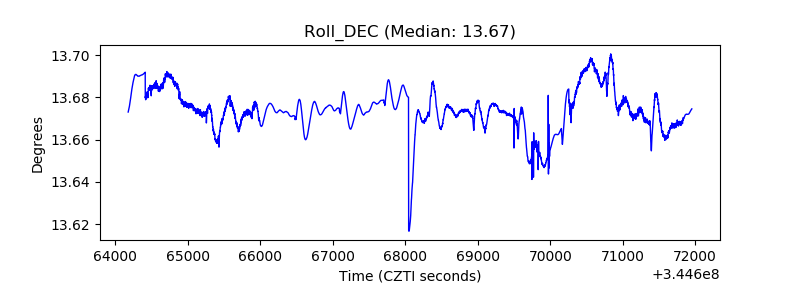 |
| _Roll_RA | 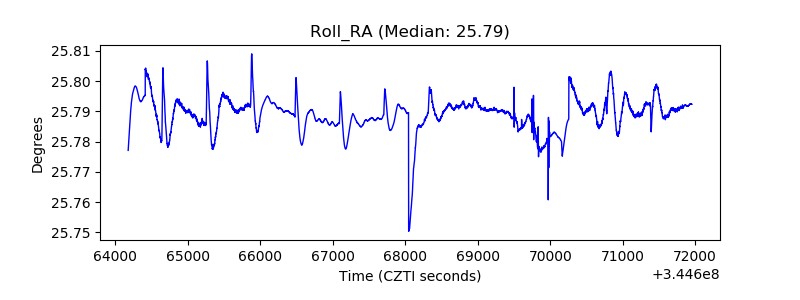 |
| Veto Counter | 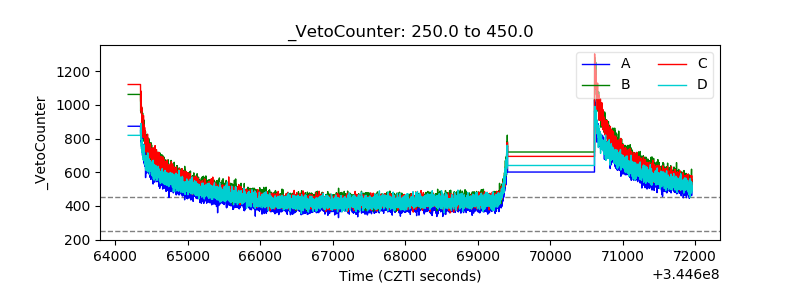 |