| Param | Original file | Final file |
|---|---|---|
| Filename | modeM0/AS1A10_045T01_9000004046_28023cztM0_level2.evt | modeM0/AS1A10_045T01_9000004046_28023cztM0_level2_quad_clean.evt |
| Size (bytes) | 373,464,000 | 62,743,680 |
| Size | 356.2 MB | 59.8 MB |
| Events in quadrant A | 2,401,489 | 417,735 |
| Events in quadrant B | 2,422,999 | 417,172 |
| Events in quadrant C | 2,578,799 | 385,407 |
| Events in quadrant D | 3,616,404 | 378,161 |
| Mode M9 | |||
|---|---|---|---|
| Quadrant | BADHDUFLAG | Total packets | Discarded packets |
| A | 0 | 1 | 0 |
| B | 0 | 2 | 0 |
| C | 0 | 2 | 0 |
| D | 0 | 2 | 0 |
| Mode M0 | |||
|---|---|---|---|
| Quadrant | BADHDUFLAG | Total packets | Discarded packets |
| A | 0 | 9653 | 0 |
| B | 0 | 9783 | 0 |
| C | 0 | 10438 | 0 |
| D | 0 | 13810 | 0 |
| Quadrant | Total seconds | Saturated seconds | Saturation percentage |
|---|---|---|---|
| A | 4284 | 10 | 0.233427% |
| B | 4284 | 6 | 0.140056% |
| C | 4284 | 48 | 1.120448% |
| D | 4284 | 128 | 2.987862% |
Noise dominated data is calculated using 1-second bins in cleaned event files. If a bin has >2000 counts, and if more than 50% of those come from <1% of pixels, then it is considered to be noise-dominated and hence unusable.
| Quadrant | # 1 sec bins | Bins with >0 counts | Bins with >2000 counts | High rate bins dominated by noise | Noise dominated (total time) | Noise dominated (detector-on time) | Marked lightcurve |
|---|---|---|---|---|---|---|---|
| A | 4284 | 4284 | 2 | 2 | 0.05% | 0.05% | 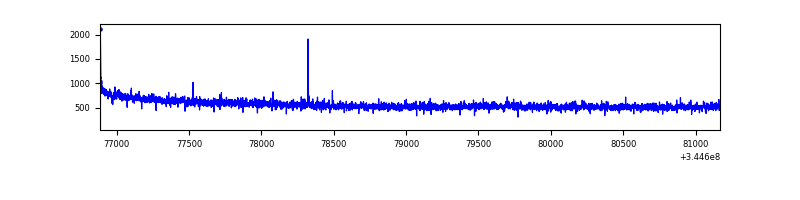 |
| B | 4284 | 4284 | 0 | 0 | 0.00% | 0.00% | 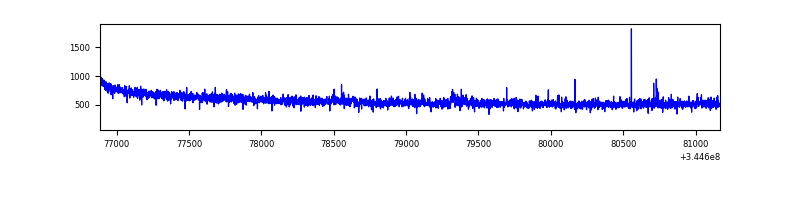 |
| C | 4284 | 4284 | 8 | 8 | 0.19% | 0.19% | 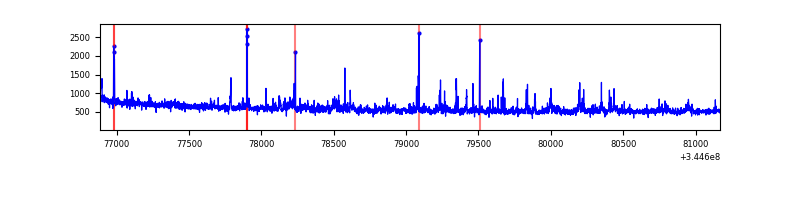 |
| D | 4284 | 4284 | 142 | 142 | 3.31% | 3.31% | 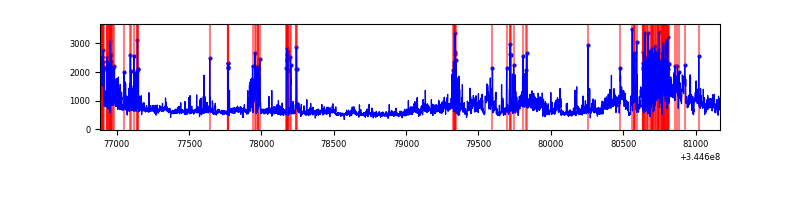 |
Top three noisy pixels from each quadrant. If the there are fewer than three noisy pixels in the level2.evt file, extra rows are filled as -1
| Pixel properties | Quadrant properties | ||||||
|---|---|---|---|---|---|---|---|
| Quadrant | DetID | PixID | Counts | Sigma | Mean | Median | Sigma |
| A | 0 | 13 | 11570 | 89.67 | 618 | 609 | 122.2 |
| A | 13 | 254 | 6089 | 44.83 | 618 | 609 | 122.2 |
| A | 8 | 192 | 5567 | 40.56 | 618 | 609 | 122.2 |
| B | 12 | 111 | 13094 | 110.13 | 611 | 598 | 113.5 |
| B | 11 | 111 | 11741 | 98.21 | 611 | 598 | 113.5 |
| B | 10 | 245 | 11443 | 95.58 | 611 | 598 | 113.5 |
| C | 3 | 233 | 199483 | 1509.66 | 574 | 579 | 131.8 |
| C | 14 | 238 | 95664 | 721.68 | 574 | 579 | 131.8 |
| C | 2 | 16 | 44714 | 334.98 | 574 | 579 | 131.8 |
| D | 8 | 195 | 778745 | 5759.25 | 578 | 565 | 135.1 |
| D | 1 | 52 | 463715 | 3427.74 | 578 | 565 | 135.1 |
| D | 7 | 80 | 134587 | 991.89 | 578 | 565 | 135.1 |
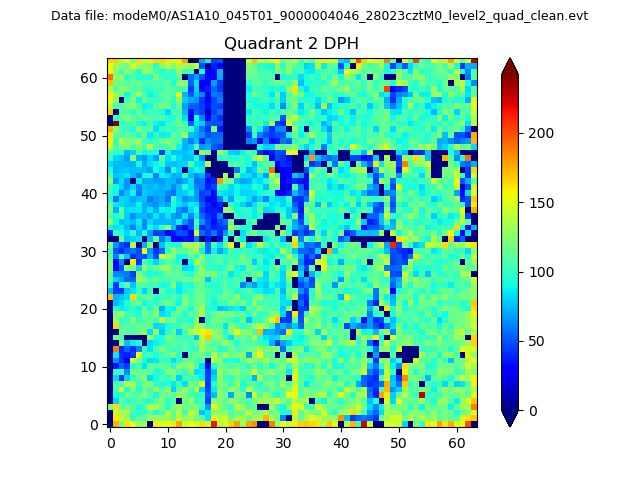
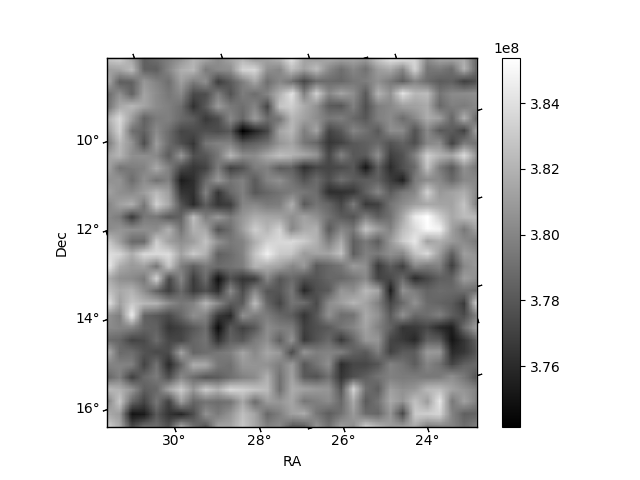
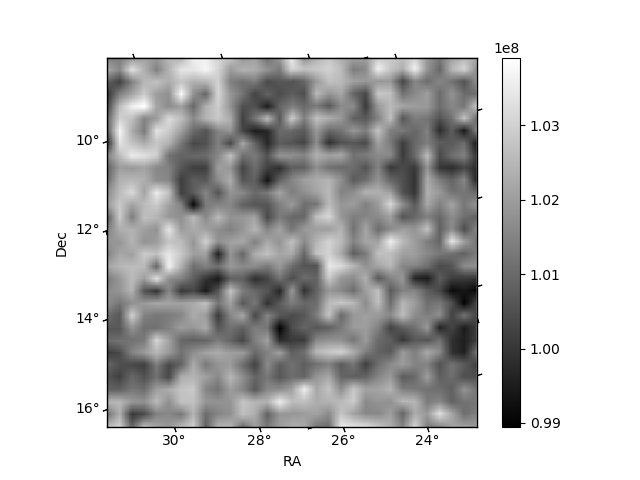
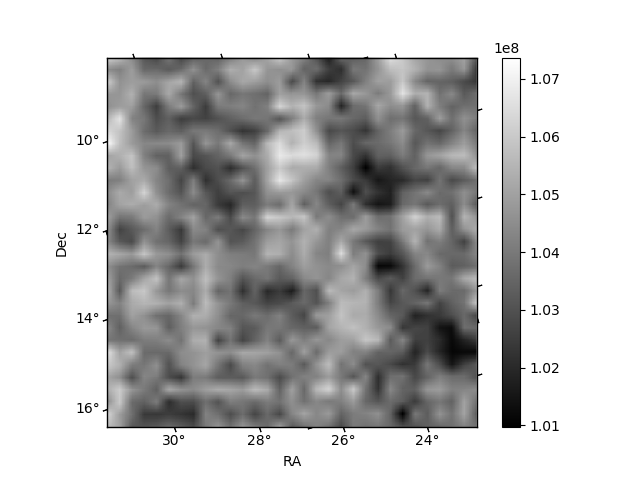
Histogram calculated using DETX and DETY for each event in the final _common_clean file
| Quadrant A | 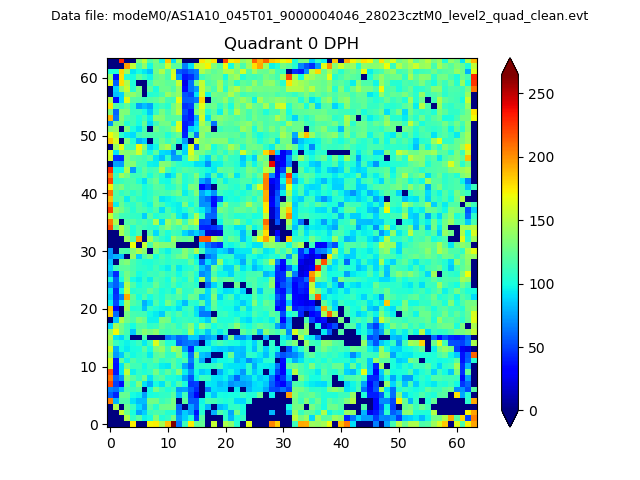 |
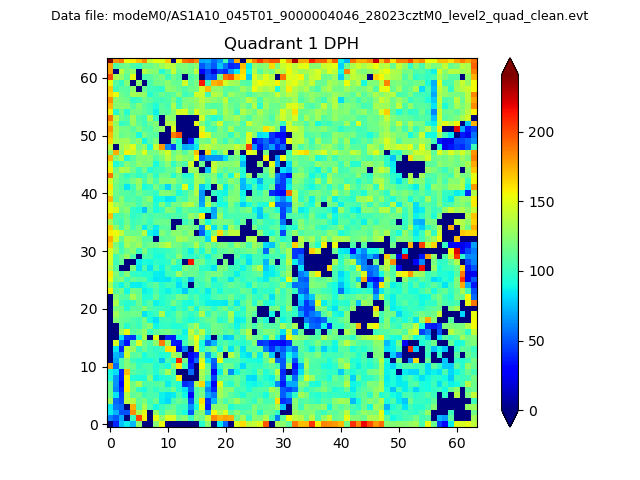 |
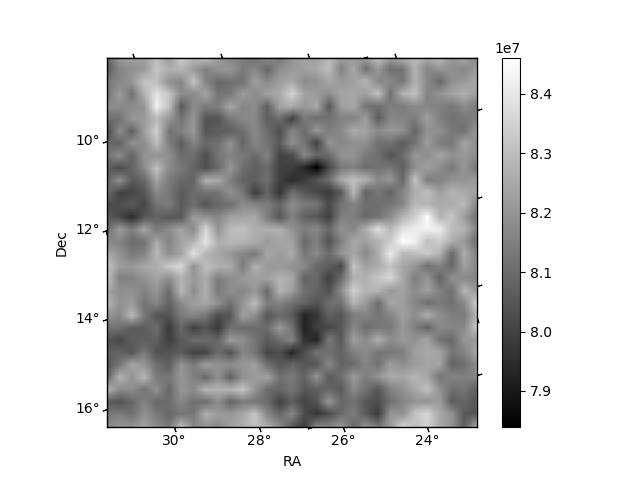
Quadrant B |
|---|---|---|---|
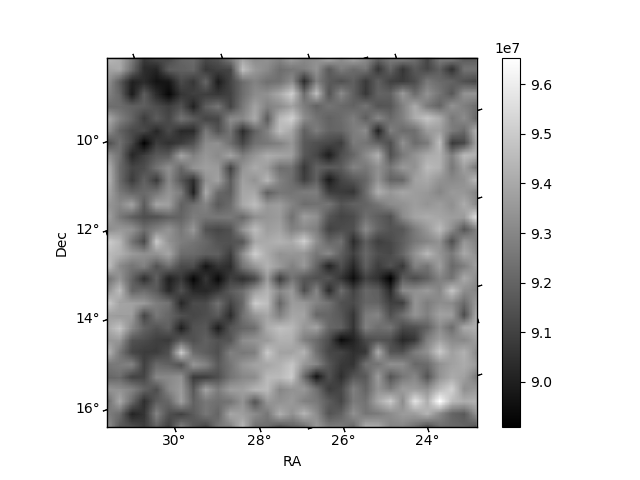
| Quadrant D | 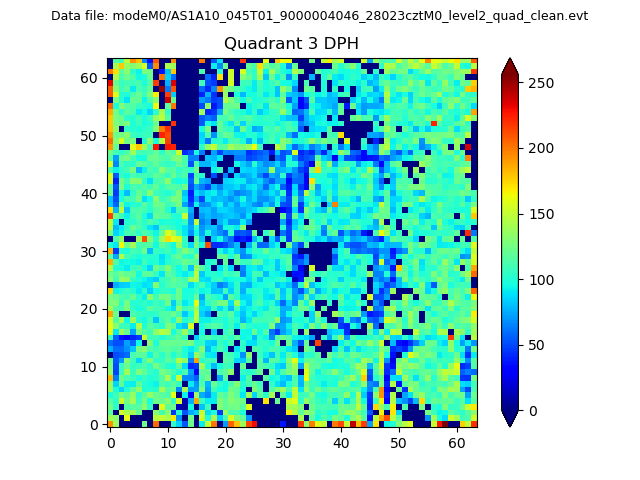 |
 |
Quadrant C |
| Plot type | Count rate plots | Images |
|---|---|---|
| Comparison with Poisson distribution Blue bars denote a histogram of data divided into 1 sec bins. Red curve is a Poisson curve with rate = median count rate of data. |
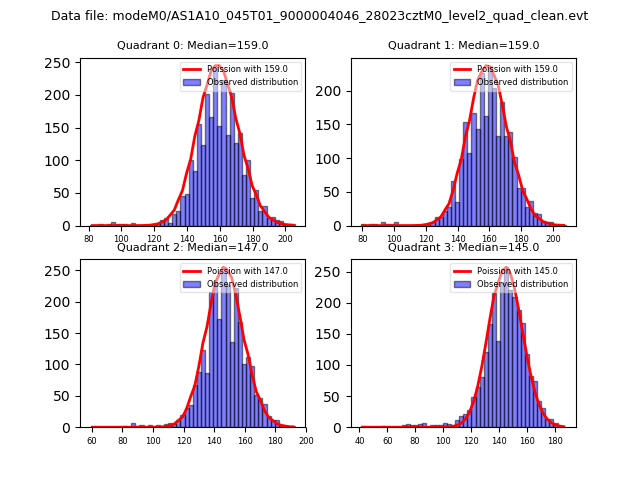 |
 |
| Quadrant-wise count rates Data is divided into 100 sec bins |
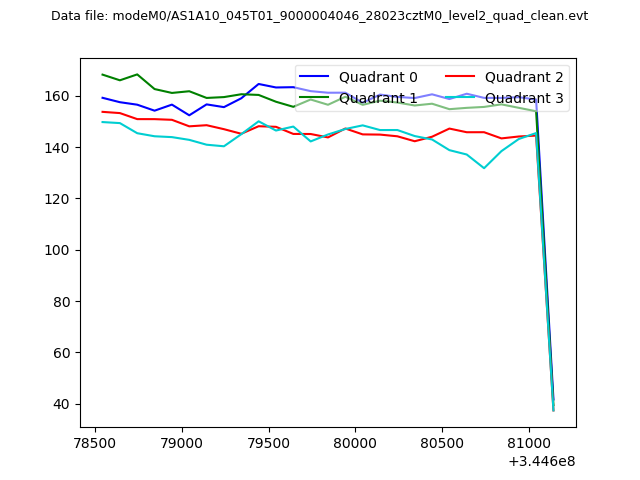 |
|
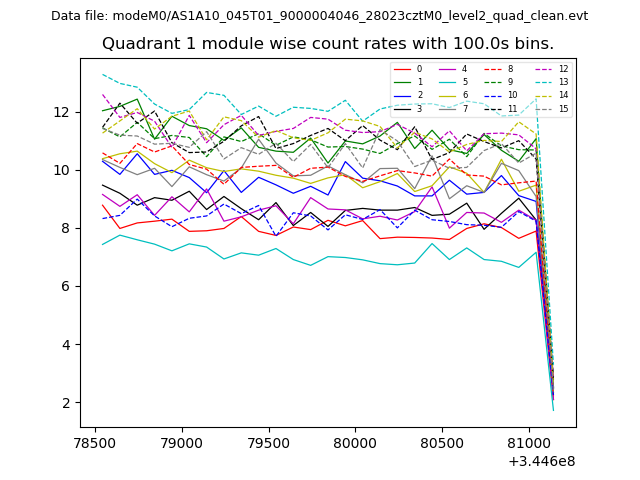
| Module-wise count rates for Quadrant A Data is divided into 100 sec bins |
 |
 |
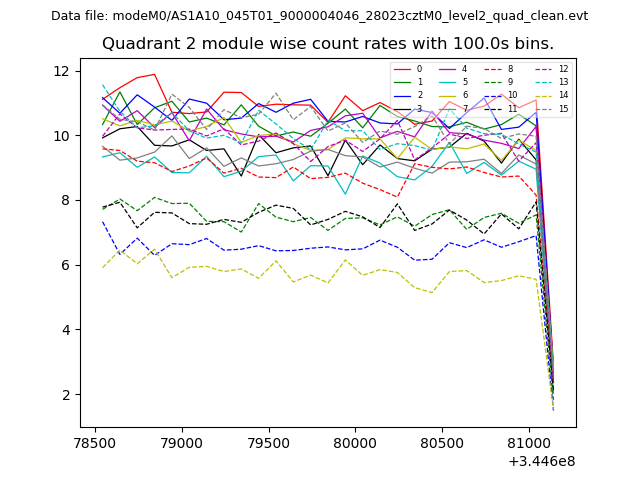
| Module-wise count rates for Quadrant B Data is divided into 100 sec bins |
 |
 |
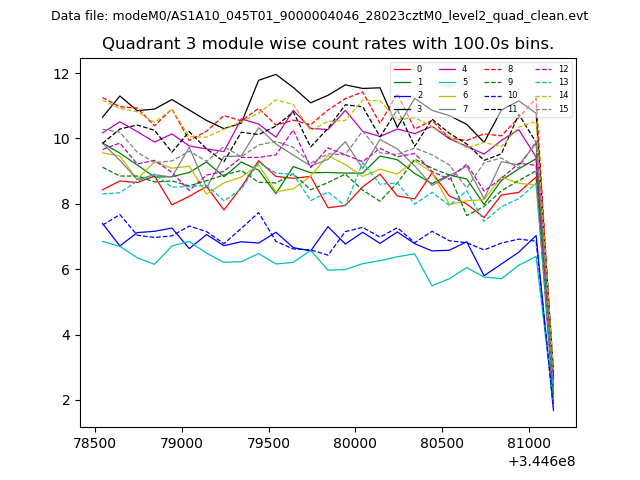
| Module-wise count rates for Quadrant C Data is divided into 100 sec bins |
 |
 |
| Module-wise count rates for Quadrant D Data is divided into 100 sec bins |
 |
 |
| Parameter | Plot |
|---|---|
| CZT HV Monitor |  |
| D_VDD | 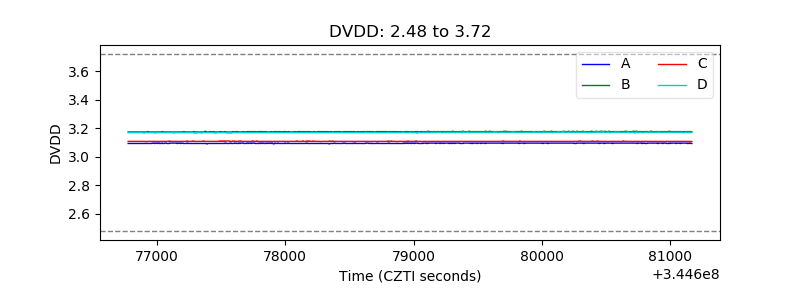 |
| Temperature 1 | 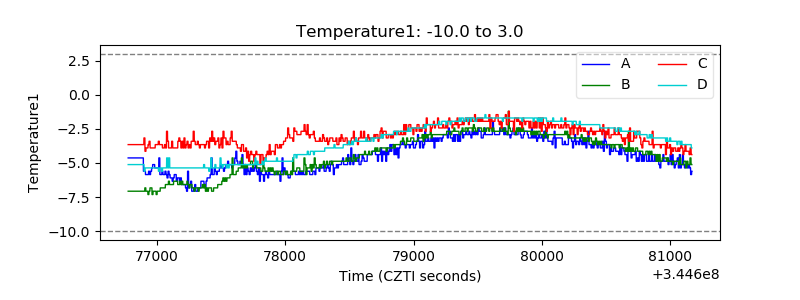 |
| Veto HV Monitor | 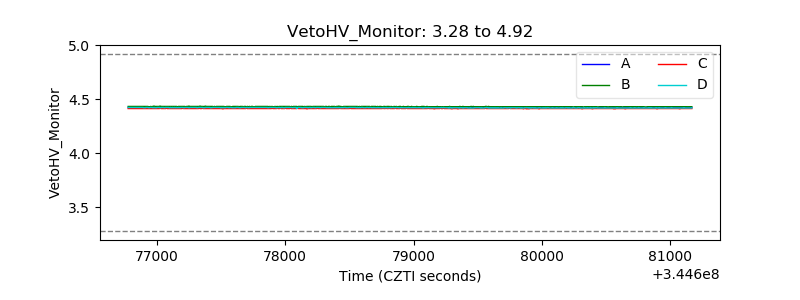 |
| Veto LLD |  |
| Alpha Counter | 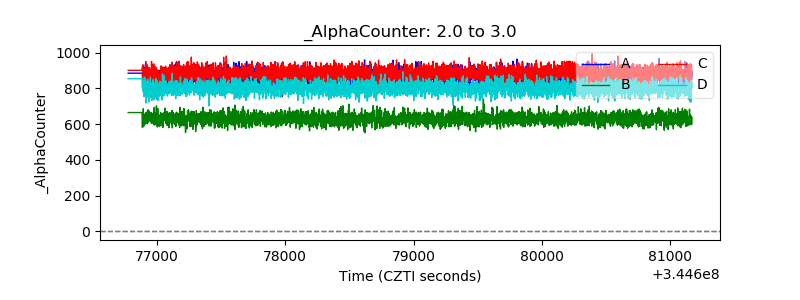 |
| _CPM_Rate | 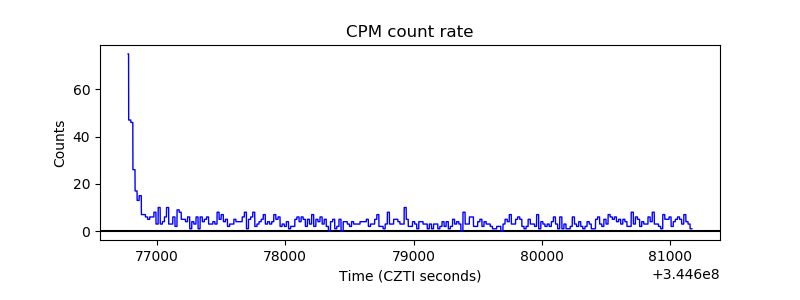 |
| CZT Counter | 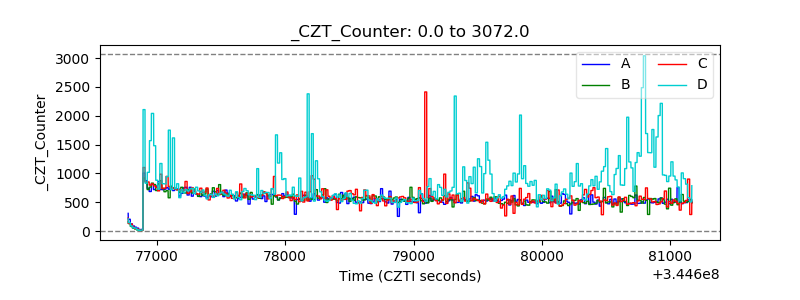 |
| +2.5 Volts monitor |  |
| +5 Volts monitor |  |
| _ROLL_ROT |  |
| _Roll_DEC | 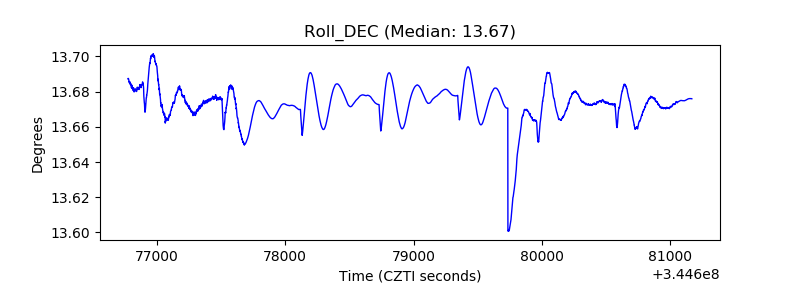 |
| _Roll_RA | 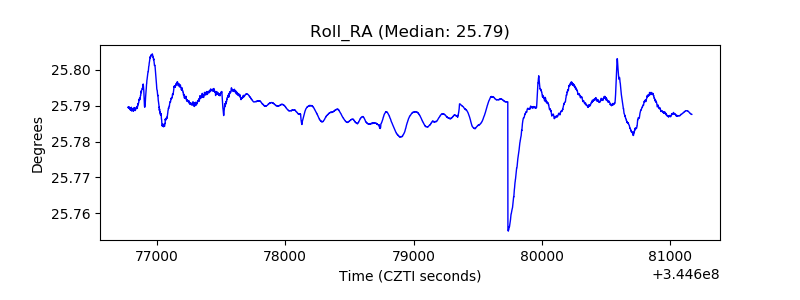 |
| Veto Counter |  |