| Param | Original file | Final file |
|---|---|---|
| Filename | modeM0/AS1A10_045T02_9000004048cztM0_level2.fits | modeM0/AS1A10_045T02_9000004048cztM0_level2_quad_clean.evt |
| Size (bytes) | 197,231,040 | 145,725,120 |
| Size | 188.1 MB | 139.0 MB |
| Events in quadrant A | 1,272,606 | 852,312 |
| Events in quadrant B | 1,218,262 | 840,204 |
| Events in quadrant C | 1,201,628 | 775,589 |
| Events in quadrant D | 1,046,654 | 709,599 |
| Mode M0 | |||
|---|---|---|---|
| Quadrant | BADHDUFLAG | Total packets | Discarded packets |
| A | 0 | 39041 | 0 |
| B | 0 | 39453 | 0 |
| C | 0 | 40598 | 0 |
| D | 0 | 60022 | 0 |
| Mode M9 | |||
|---|---|---|---|
| Quadrant | BADHDUFLAG | Total packets | Discarded packets |
| A | 0 | 46 | 0 |
| B | 0 | 46 | 0 |
| C | 0 | 46 | 0 |
| D | 0 | 46 | 0 |
| Mode SS | |||
|---|---|---|---|
| Quadrant | BADHDUFLAG | Total packets | Discarded packets |
| A | 0 | 364 | 0 |
| B | 0 | 364 | 0 |
| C | 0 | 364 | 0 |
| D | 0 | 364 | 0 |
| Quadrant | Total seconds | Saturated seconds | Saturation percentage |
|---|---|---|---|
| A | 17912 | 334 | 1.864672% |
| B | 17912 | 419 | 2.339214% |
| C | 17912 | 490 | 2.735596% |
| D | 17912 | 966 | 5.393033% |
Noise dominated data is calculated using 1-second bins in cleaned event files. If a bin has >2000 counts, and if more than 50% of those come from <1% of pixels, then it is considered to be noise-dominated and hence unusable.
| Quadrant | # 1 sec bins | Bins with >0 counts | Bins with >2000 counts | High rate bins dominated by noise | Noise dominated (total time) | Noise dominated (detector-on time) | Marked lightcurve |
|---|---|---|---|---|---|---|---|
| A | 21216 | 17908 | 0 | 0 | 0.00% | 0.00% |  |
| B | 21216 | 17906 | 0 | 0 | 0.00% | 0.00% |  |
| C | 21216 | 17907 | 0 | 0 | 0.00% | 0.00% | 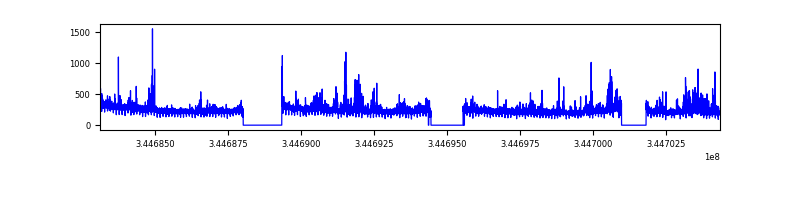 |
| D | 21216 | 17900 | 0 | 0 | 0.00% | 0.00% |  |
Top three noisy pixels from each quadrant. If the there are fewer than three noisy pixels in the level2.evt file, extra rows are filled as -1
| Pixel properties | Quadrant properties | ||||||
|---|---|---|---|---|---|---|---|
| Quadrant | DetID | PixID | Counts | Sigma | Mean | Median | Sigma |
| A | 0 | 29 | 1066 | 9.3 | 331 | 314 | 80.9 |
| A | 7 | 110 | 1032 | 8.88 | 331 | 314 | 80.9 |
| A | 9 | 19 | 968 | 8.09 | 331 | 314 | 80.9 |
| B | 2 | 9 | 929 | 9.46 | 322 | 310 | 65.4 |
| B | 2 | 8 | 783 | 7.23 | 322 | 310 | 65.4 |
| B | 5 | 255 | 782 | 7.21 | 322 | 310 | 65.4 |
| C | 1 | 81 | 878 | 7.1 | 317 | 301 | 81.2 |
| C | 1 | 80 | 861 | 6.89 | 317 | 301 | 81.2 |
| C | 12 | 241 | 845 | 6.7 | 317 | 301 | 81.2 |
| D | 6 | 67 | 796 | 6.5 | 298 | 273 | 80.4 |
| D | 7 | 3 | 778 | 6.28 | 298 | 273 | 80.4 |
| D | 4 | 246 | 770 | 6.18 | 298 | 273 | 80.4 |
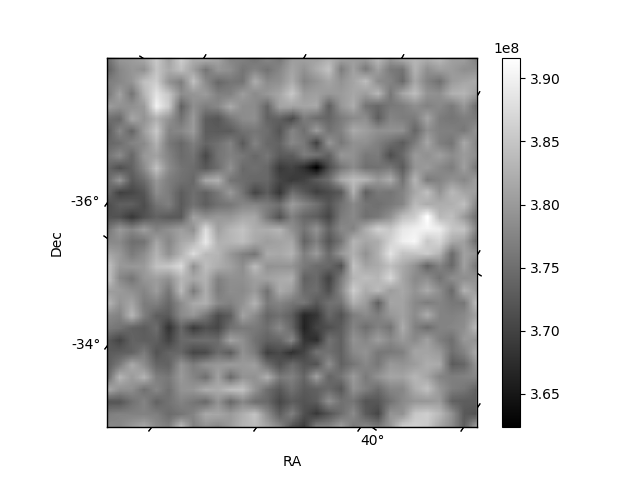
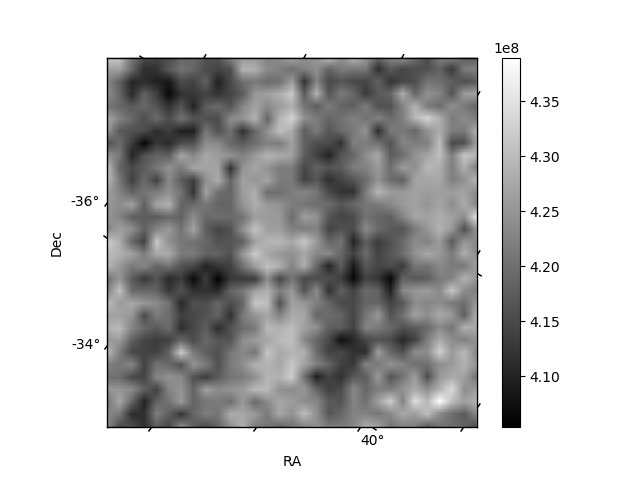
Histogram calculated using DETX and DETY for each event in the final _common_clean file
| Quadrant A | 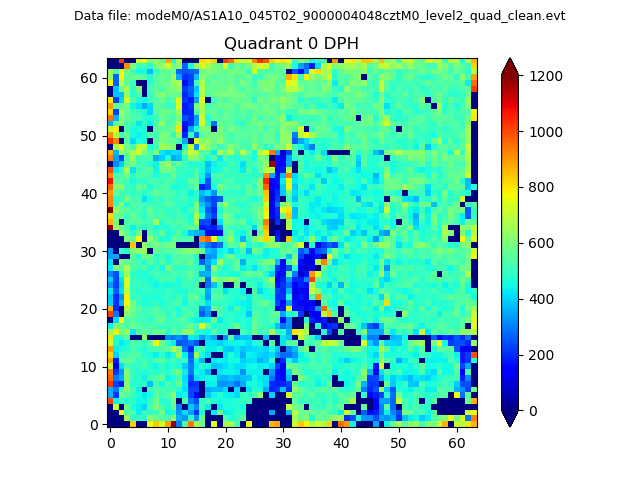 |
 |
Quadrant B |
|---|---|---|---|
| Quadrant D |  |
 |
Quadrant C |
| Plot type | Count rate plots | Images |
|---|---|---|
| Comparison with Poisson distribution Blue bars denote a histogram of data divided into 1 sec bins. Red curve is a Poisson curve with rate = median count rate of data. |
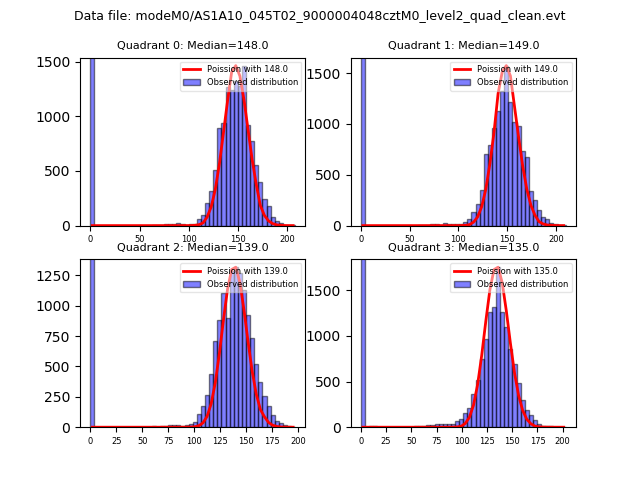 |
 |
| Quadrant-wise count rates Data is divided into 100 sec bins |
 |
|
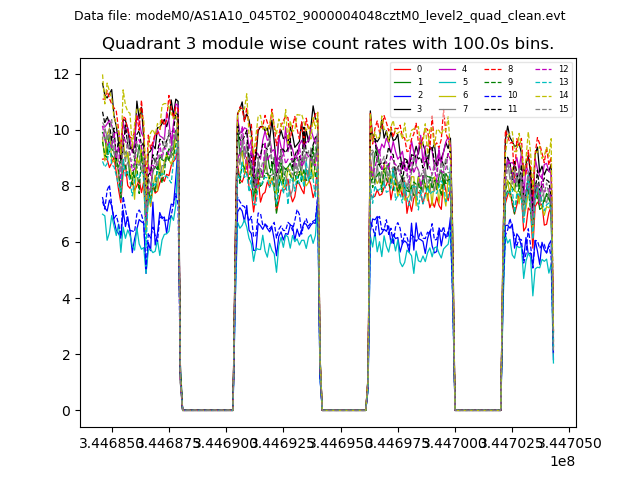
| Module-wise count rates for Quadrant A Data is divided into 100 sec bins |
 |
 |
| Module-wise count rates for Quadrant B Data is divided into 100 sec bins |
 |
 |
| Module-wise count rates for Quadrant C Data is divided into 100 sec bins |
 |
 |
| Module-wise count rates for Quadrant D Data is divided into 100 sec bins |
 |
 |
| Parameter | Plot |
|---|---|
| CZT HV Monitor |  |
| D_VDD |  |
| Temperature 1 |  |
| Veto HV Monitor |  |
| Veto LLD |  |
| Alpha Counter |  |
| _CPM_Rate |  |
| CZT Counter |  |
| +2.5 Volts monitor |  |
| +5 Volts monitor | 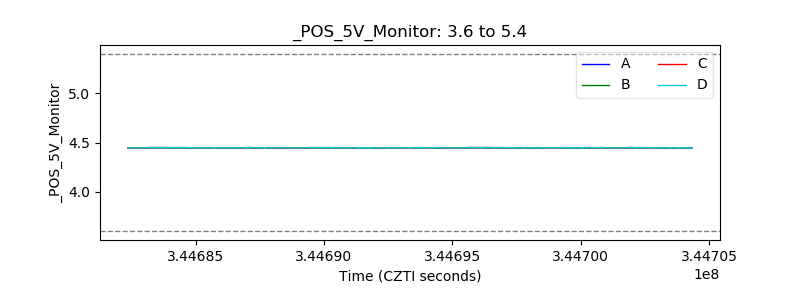 |
| _ROLL_ROT |  |
| _Roll_DEC | 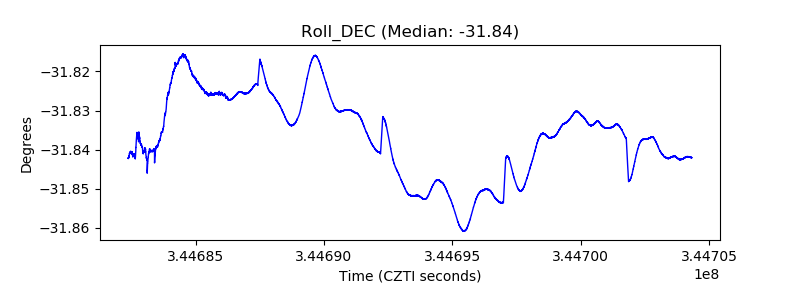 |
| _Roll_RA |  |
| Veto Counter |  |