| Param | Original file | Final file |
|---|---|---|
| Filename | modeM0/AS1A10_045T02_9000004048_28025cztM0_level2.evt | modeM0/AS1A10_045T02_9000004048_28025cztM0_level2_quad_clean.evt |
| Size (bytes) | 558,604,800 | 98,542,080 |
| Size | 532.7 MB | 94.0 MB |
| Events in quadrant A | 3,526,120 | 656,141 |
| Events in quadrant B | 3,569,259 | 664,784 |
| Events in quadrant C | 3,644,232 | 618,095 |
| Events in quadrant D | 5,738,980 | 593,370 |
| Mode M0 | |||
|---|---|---|---|
| Quadrant | BADHDUFLAG | Total packets | Discarded packets |
| A | 0 | 14375 | 0 |
| B | 0 | 14600 | 0 |
| C | 0 | 15006 | 0 |
| D | 0 | 21914 | 0 |
| Mode M9 | |||
|---|---|---|---|
| Quadrant | BADHDUFLAG | Total packets | Discarded packets |
| A | 0 | 17 | 0 |
| B | 0 | 18 | 0 |
| C | 0 | 18 | 0 |
| D | 0 | 18 | 0 |
| Quadrant | Total seconds | Saturated seconds | Saturation percentage |
|---|---|---|---|
| A | 6482 | 163 | 2.514656% |
| B | 6482 | 222 | 3.424869% |
| C | 6482 | 226 | 3.486578% |
| D | 6481 | 340 | 5.246104% |
Noise dominated data is calculated using 1-second bins in cleaned event files. If a bin has >2000 counts, and if more than 50% of those come from <1% of pixels, then it is considered to be noise-dominated and hence unusable.
| Quadrant | # 1 sec bins | Bins with >0 counts | Bins with >2000 counts | High rate bins dominated by noise | Noise dominated (total time) | Noise dominated (detector-on time) | Marked lightcurve |
|---|---|---|---|---|---|---|---|
| A | 7627 | 6484 | 0 | 0 | 0.00% | 0.00% | 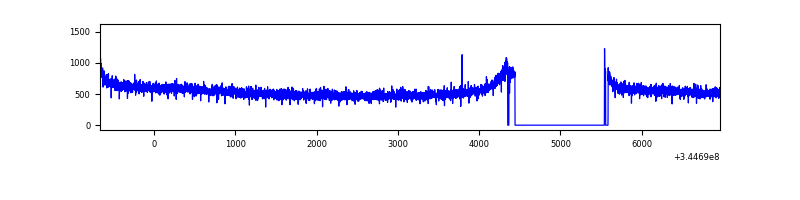 |
| B | 7627 | 6482 | 8 | 8 | 0.10% | 0.12% | 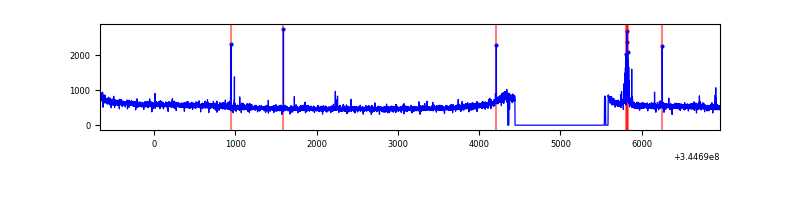 |
| C | 7627 | 6483 | 0 | 0 | 0.00% | 0.00% | 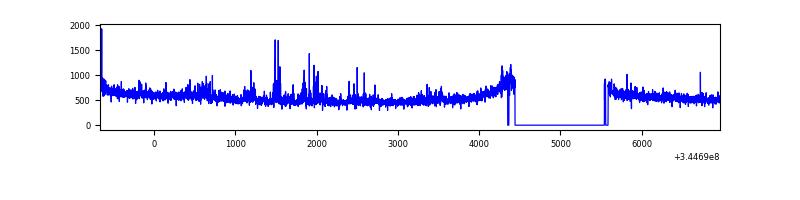 |
| D | 7626 | 6482 | 212 | 212 | 2.78% | 3.27% | 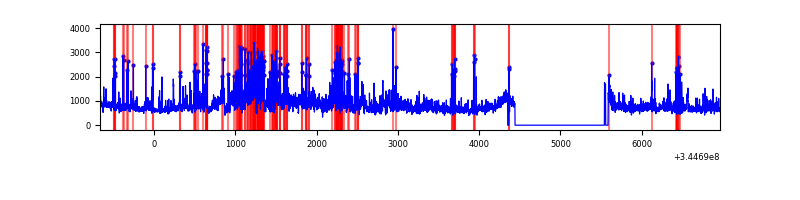 |
Top three noisy pixels from each quadrant. If the there are fewer than three noisy pixels in the level2.evt file, extra rows are filled as -1
| Pixel properties | Quadrant properties | ||||||
|---|---|---|---|---|---|---|---|
| Quadrant | DetID | PixID | Counts | Sigma | Mean | Median | Sigma |
| A | 8 | 34 | 22981 | 123.16 | 904 | 889 | 179.4 |
| A | 0 | 13 | 10813 | 55.32 | 904 | 889 | 179.4 |
| A | 13 | 254 | 10296 | 52.44 | 904 | 889 | 179.4 |
| B | 10 | 245 | 53198 | 312.85 | 891 | 872 | 167.3 |
| B | 12 | 111 | 20116 | 115.06 | 891 | 872 | 167.3 |
| B | 11 | 111 | 18321 | 104.33 | 891 | 872 | 167.3 |
| C | 3 | 233 | 195455 | 990.69 | 849 | 856 | 196.4 |
| C | 14 | 238 | 137763 | 696.98 | 849 | 856 | 196.4 |
| C | 13 | 61 | 5762 | 24.98 | 849 | 856 | 196.4 |
| D | 8 | 195 | 1076044 | 5311.02 | 857 | 836 | 202.4 |
| D | 1 | 52 | 1058737 | 5225.53 | 857 | 836 | 202.4 |
| D | 7 | 80 | 249475 | 1228.16 | 857 | 836 | 202.4 |
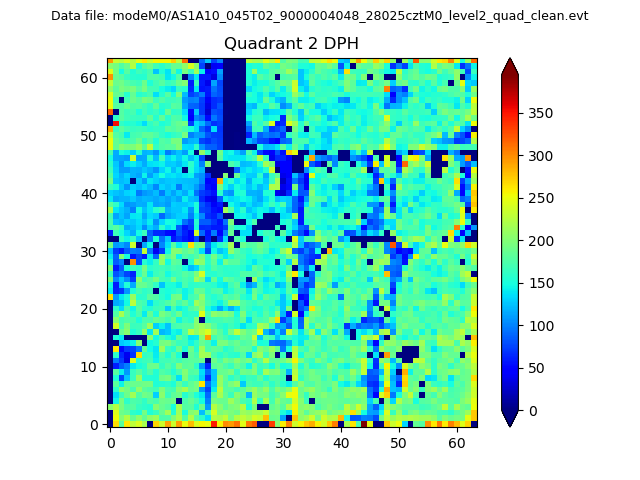
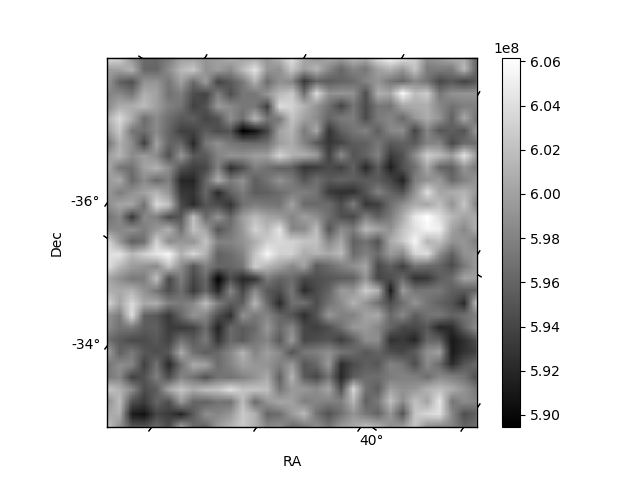
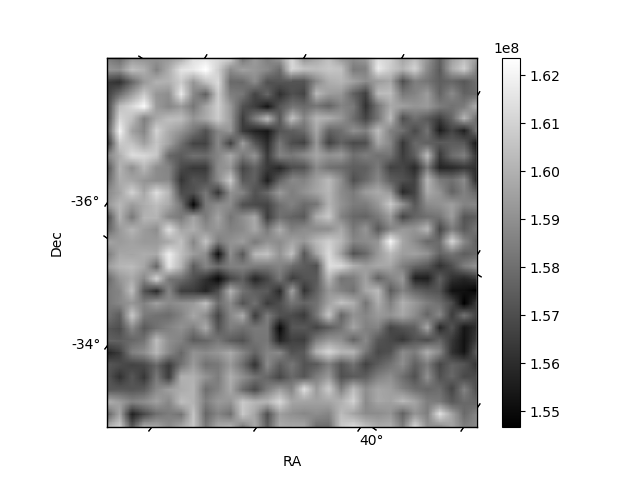
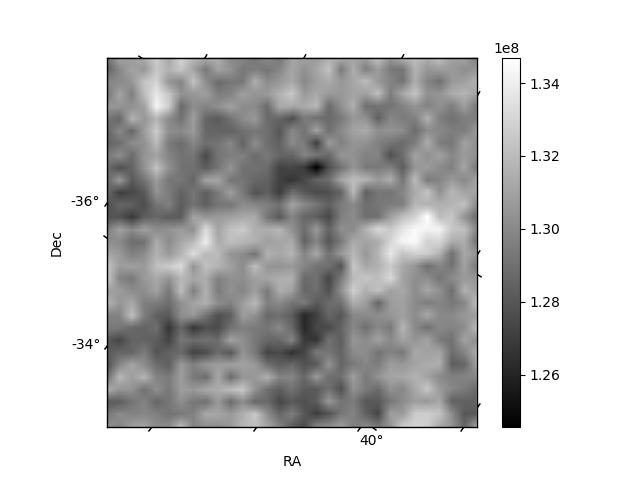
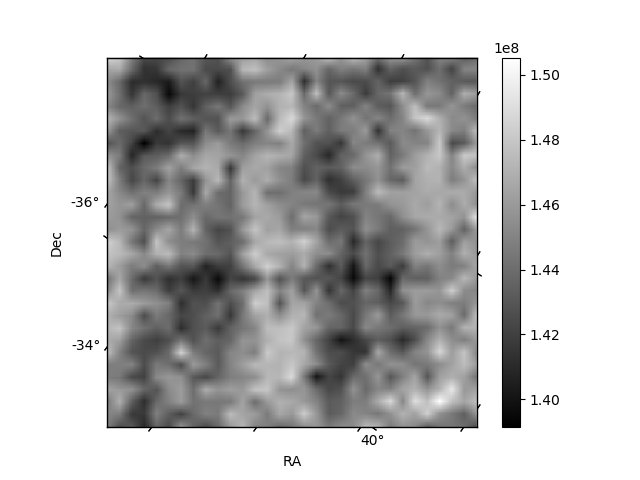
Histogram calculated using DETX and DETY for each event in the final _common_clean file
| Quadrant A | 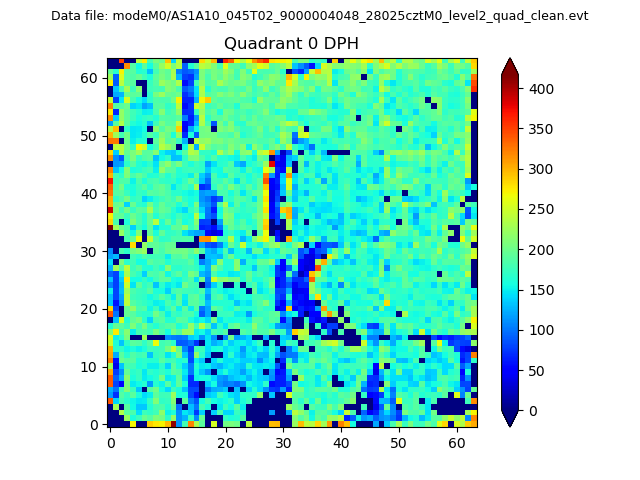 |
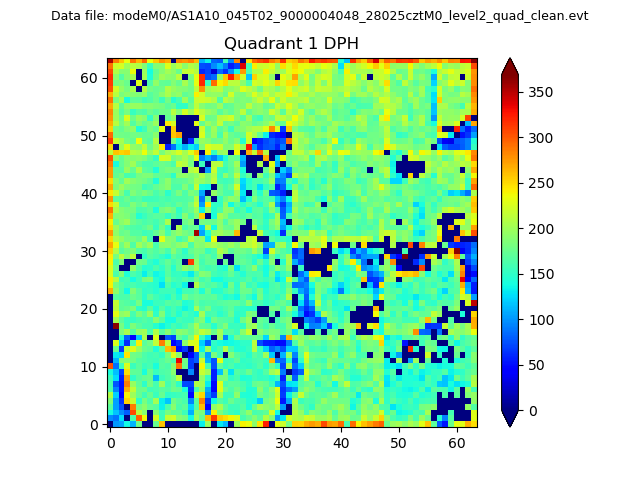 |
Quadrant B |
|---|---|---|---|
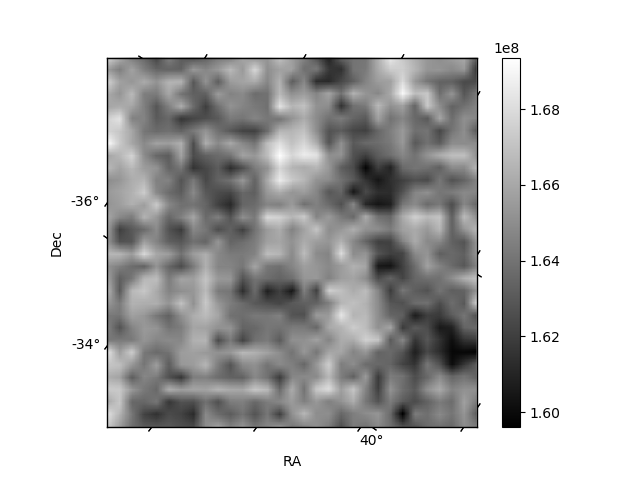
| Quadrant D | 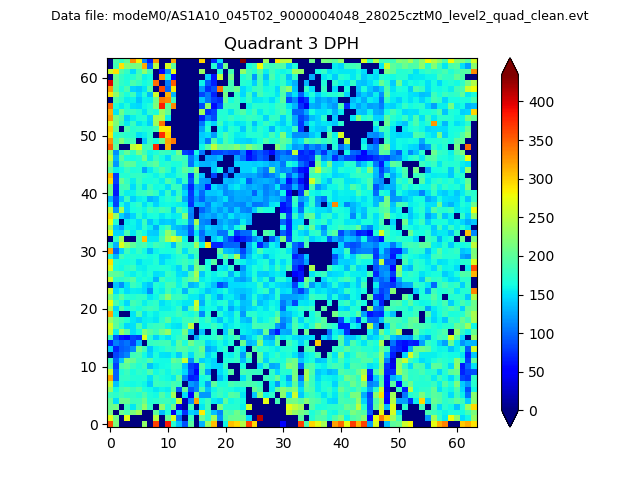 |
 |
Quadrant C |
| Plot type | Count rate plots | Images |
|---|---|---|
| Comparison with Poisson distribution Blue bars denote a histogram of data divided into 1 sec bins. Red curve is a Poisson curve with rate = median count rate of data. |
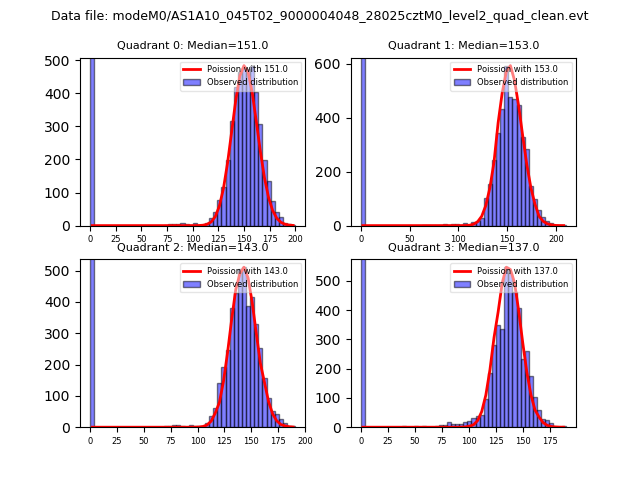 |
 |
| Quadrant-wise count rates Data is divided into 100 sec bins |
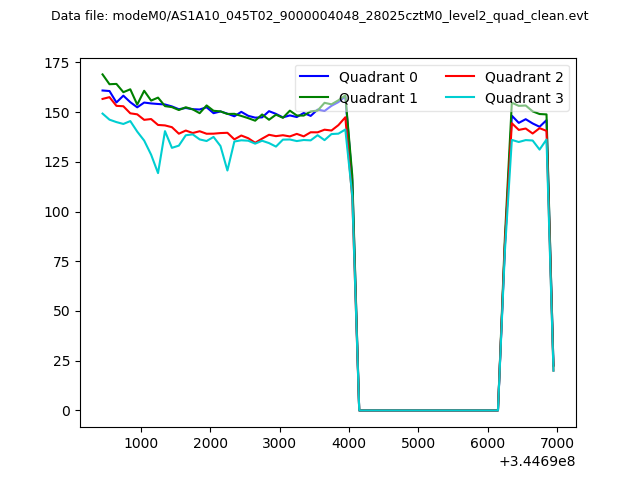 |
|
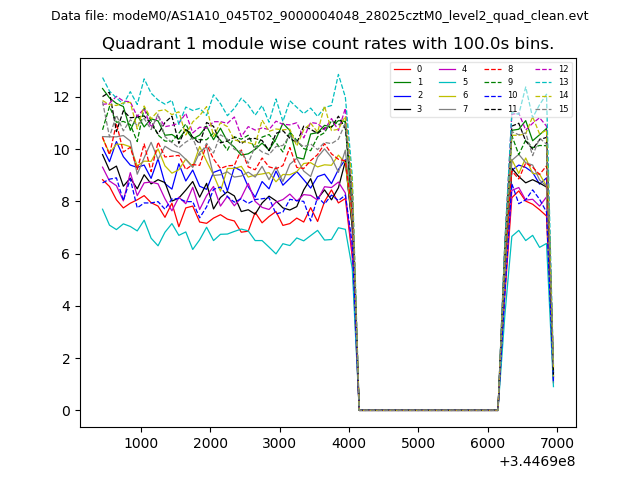
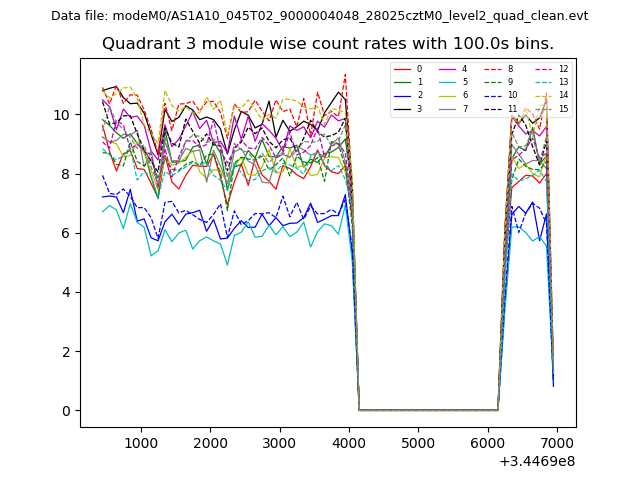
| Module-wise count rates for Quadrant A Data is divided into 100 sec bins |
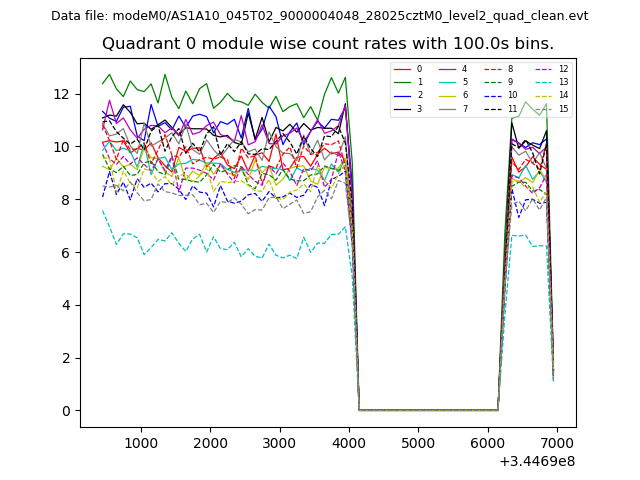 |
 |
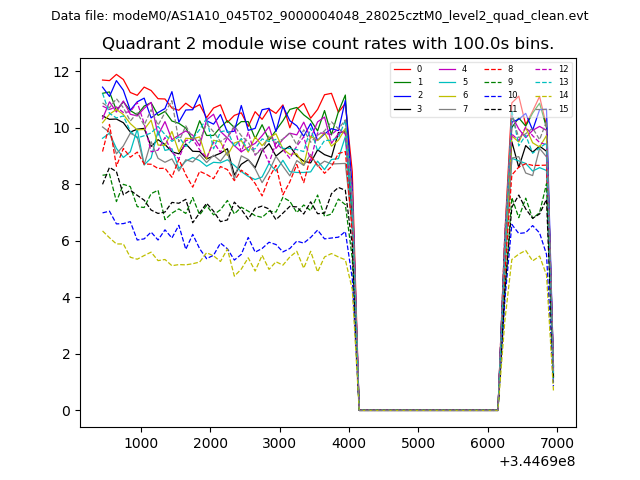
| Module-wise count rates for Quadrant B Data is divided into 100 sec bins |
 |
 |
| Module-wise count rates for Quadrant C Data is divided into 100 sec bins |
 |
 |
| Module-wise count rates for Quadrant D Data is divided into 100 sec bins |
 |
 |
| Parameter | Plot |
|---|---|
| CZT HV Monitor | 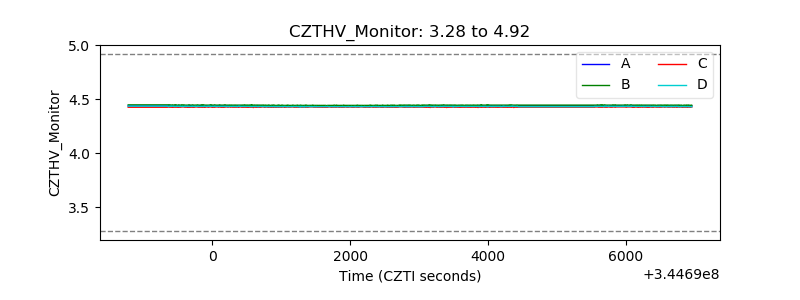 |
| D_VDD | 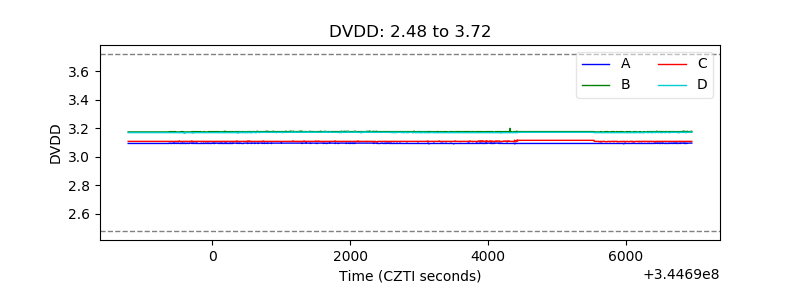 |
| Temperature 1 |  |
| Veto HV Monitor | 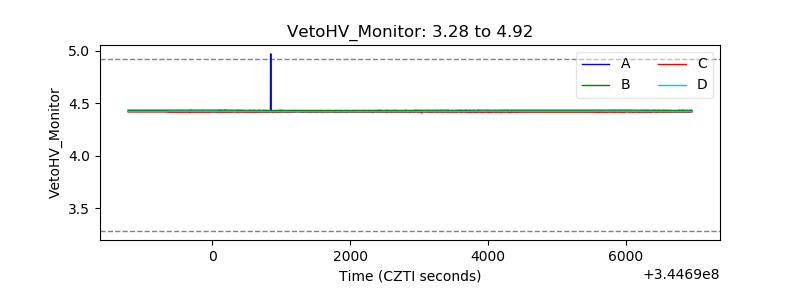 |
| Veto LLD | 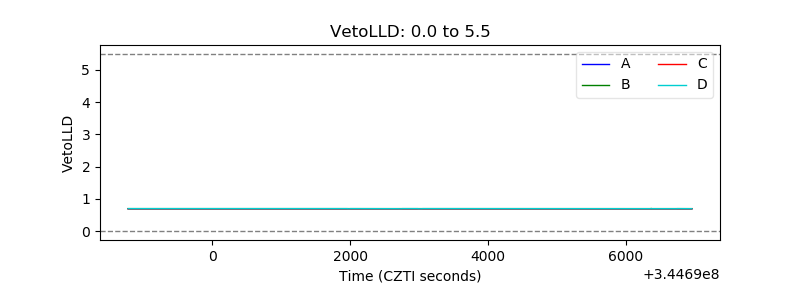 |
| Alpha Counter | 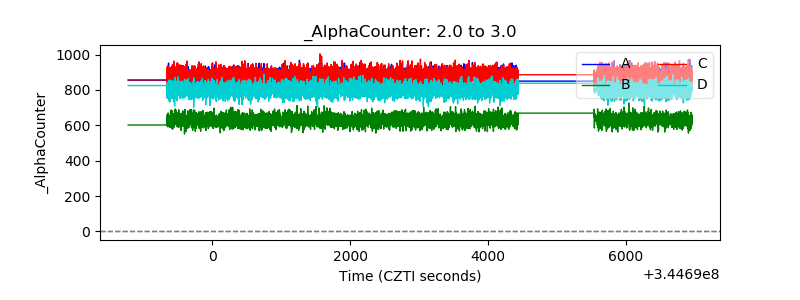 |
| _CPM_Rate | 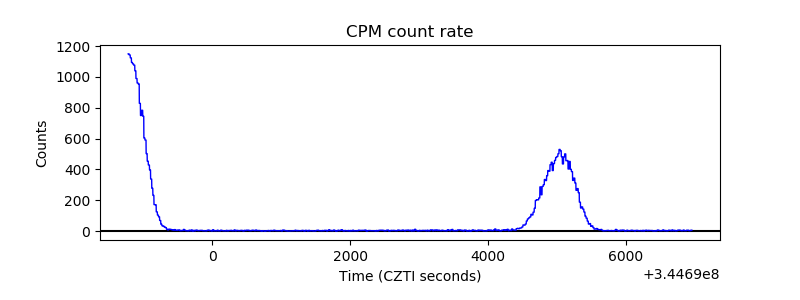 |
| CZT Counter | 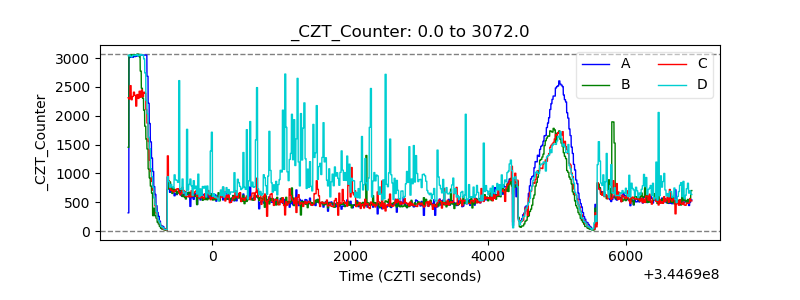 |
| +2.5 Volts monitor |  |
| +5 Volts monitor |  |
| _ROLL_ROT |  |
| _Roll_DEC |  |
| _Roll_RA | 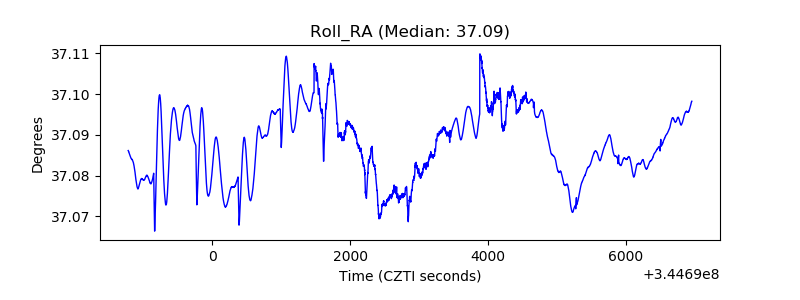 |
| Veto Counter |  |