| Param | Original file | Final file |
|---|---|---|
| Filename | modeM0/AS1A10_045T02_9000004048_28026cztM0_level2.evt | modeM0/AS1A10_045T02_9000004048_28026cztM0_level2_quad_clean.evt |
| Size (bytes) | 537,886,080 | 100,480,320 |
| Size | 513.0 MB | 95.8 MB |
| Events in quadrant A | 3,444,421 | 665,383 |
| Events in quadrant B | 3,515,906 | 670,062 |
| Events in quadrant C | 3,571,235 | 626,982 |
| Events in quadrant D | 5,300,908 | 610,396 |
| Mode M0 | |||
|---|---|---|---|
| Quadrant | BADHDUFLAG | Total packets | Discarded packets |
| A | 0 | 14261 | 0 |
| B | 0 | 14568 | 0 |
| C | 0 | 14829 | 0 |
| D | 0 | 20690 | 0 |
| Mode M9 | |||
|---|---|---|---|
| Quadrant | BADHDUFLAG | Total packets | Discarded packets |
| A | 0 | 10 | 0 |
| B | 0 | 10 | 0 |
| C | 0 | 10 | 0 |
| D | 0 | 10 | 0 |
| Quadrant | Total seconds | Saturated seconds | Saturation percentage |
|---|---|---|---|
| A | 6755 | 118 | 1.746854% |
| B | 6756 | 148 | 2.190645% |
| C | 6755 | 171 | 2.531458% |
| D | 6755 | 250 | 3.700962% |
Noise dominated data is calculated using 1-second bins in cleaned event files. If a bin has >2000 counts, and if more than 50% of those come from <1% of pixels, then it is considered to be noise-dominated and hence unusable.
| Quadrant | # 1 sec bins | Bins with >0 counts | Bins with >2000 counts | High rate bins dominated by noise | Noise dominated (total time) | Noise dominated (detector-on time) | Marked lightcurve |
|---|---|---|---|---|---|---|---|
| A | 7625 | 6756 | 0 | 0 | 0.00% | 0.00% | 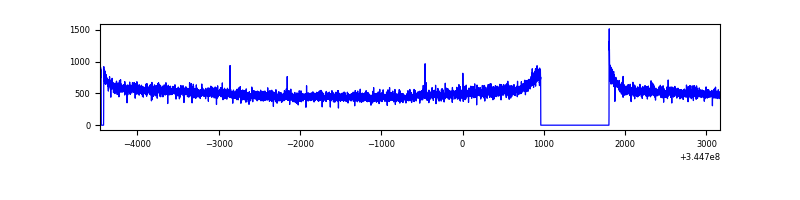 |
| B | 7626 | 6756 | 6 | 6 | 0.08% | 0.09% | 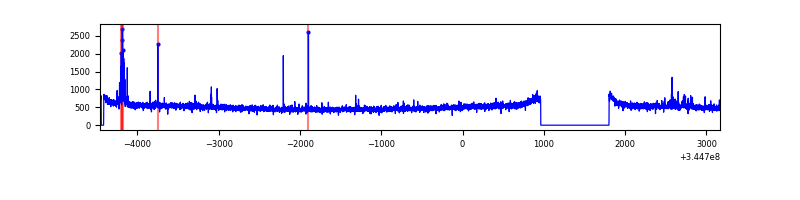 |
| C | 7625 | 6756 | 1 | 1 | 0.01% | 0.01% | 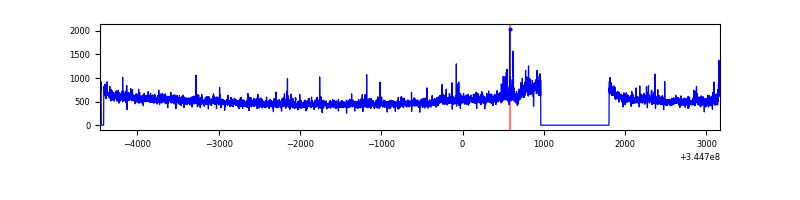 |
| D | 7625 | 6756 | 146 | 146 | 1.91% | 2.16% | 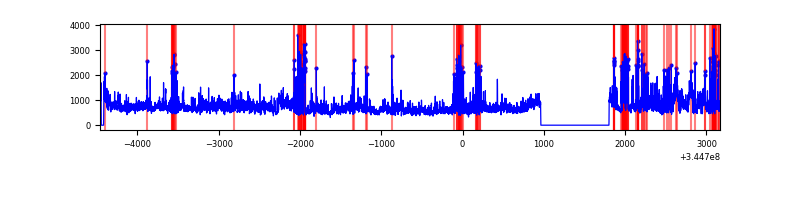 |
Top three noisy pixels from each quadrant. If the there are fewer than three noisy pixels in the level2.evt file, extra rows are filled as -1
| Pixel properties | Quadrant properties | ||||||
|---|---|---|---|---|---|---|---|
| Quadrant | DetID | PixID | Counts | Sigma | Mean | Median | Sigma |
| A | 0 | 13 | 18579 | 100.91 | 882 | 866 | 175.5 |
| A | 8 | 34 | 17259 | 93.39 | 882 | 866 | 175.5 |
| A | 13 | 254 | 10642 | 55.69 | 882 | 866 | 175.5 |
| B | 10 | 245 | 53867 | 321.22 | 872 | 853 | 165.0 |
| B | 0 | 190 | 22528 | 131.33 | 872 | 853 | 165.0 |
| B | 12 | 111 | 20569 | 119.46 | 872 | 853 | 165.0 |
| C | 3 | 233 | 182781 | 933.89 | 833 | 839 | 194.8 |
| C | 14 | 238 | 132975 | 678.24 | 833 | 839 | 194.8 |
| C | 13 | 61 | 5668 | 24.79 | 833 | 839 | 194.8 |
| D | 8 | 195 | 1211821 | 6138.61 | 837 | 817 | 197.3 |
| D | 1 | 52 | 542259 | 2744.58 | 837 | 817 | 197.3 |
| D | 7 | 80 | 336220 | 1700.16 | 837 | 817 | 197.3 |
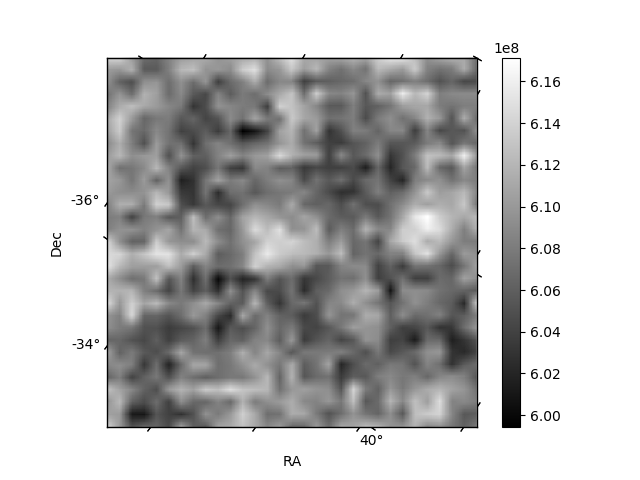
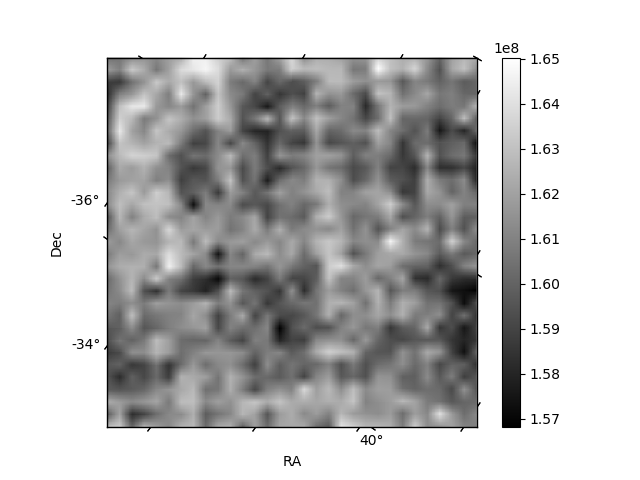
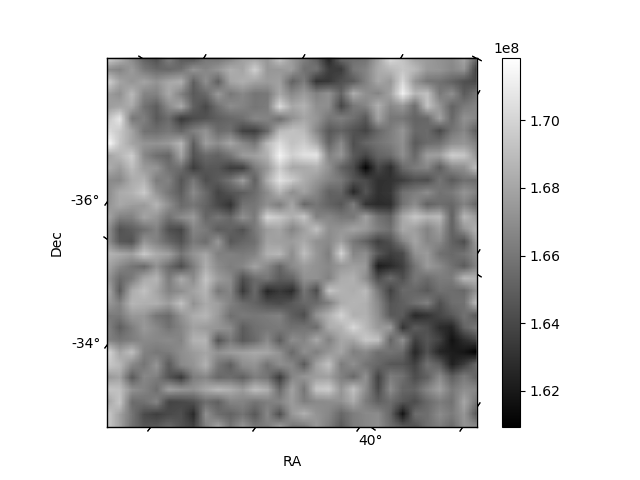
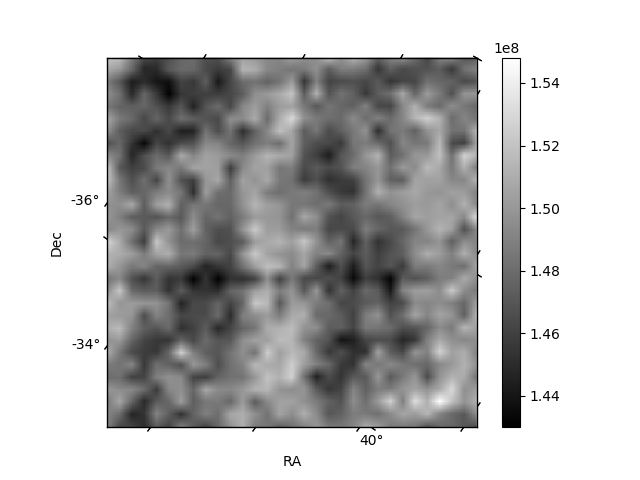
Histogram calculated using DETX and DETY for each event in the final _common_clean file
| Quadrant A | 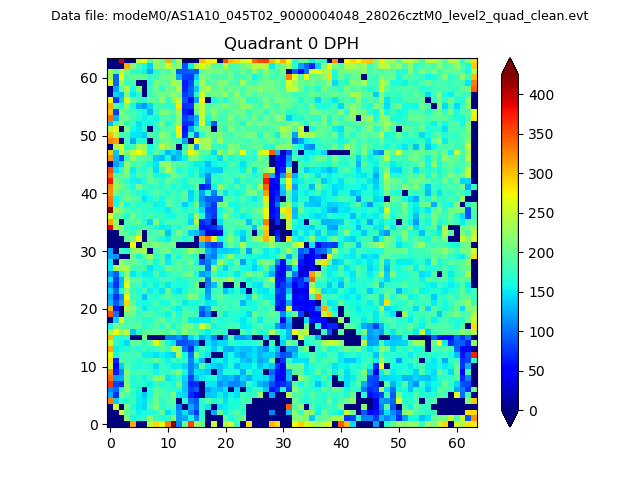 |
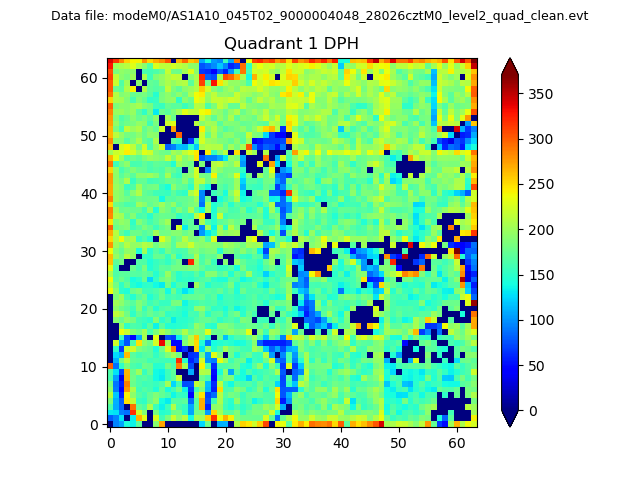 |
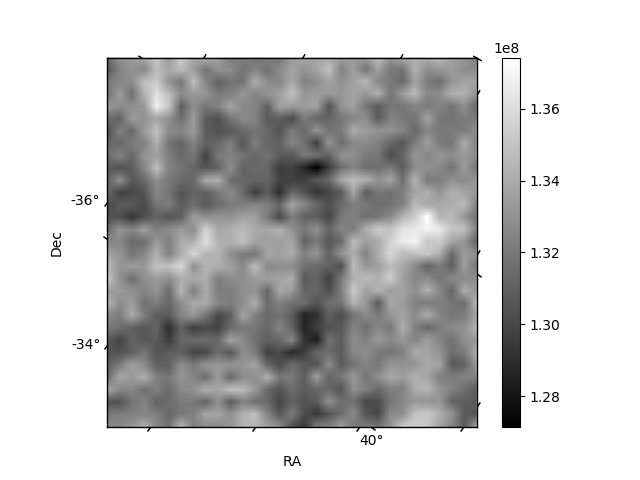
Quadrant B |
|---|---|---|---|
| Quadrant D | 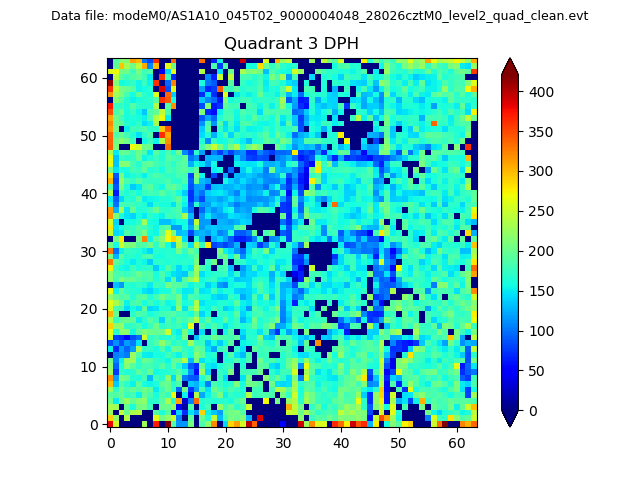 |
 |
Quadrant C |
| Plot type | Count rate plots | Images |
|---|---|---|
| Comparison with Poisson distribution Blue bars denote a histogram of data divided into 1 sec bins. Red curve is a Poisson curve with rate = median count rate of data. |
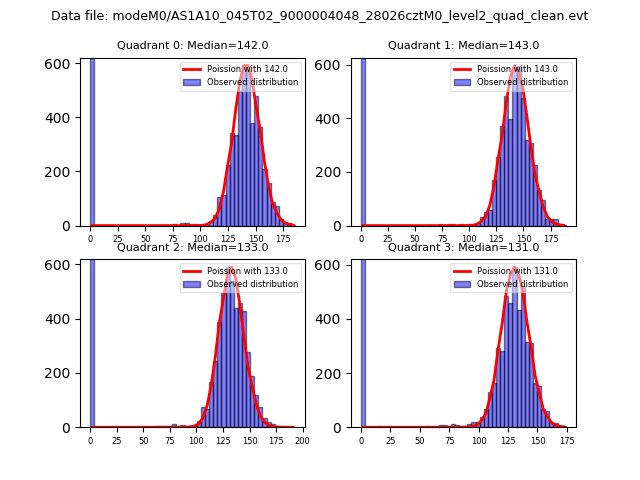 |
 |
| Quadrant-wise count rates Data is divided into 100 sec bins |
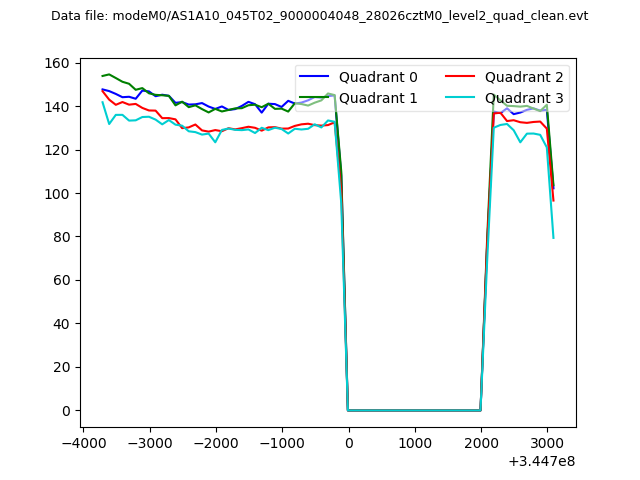 |
|
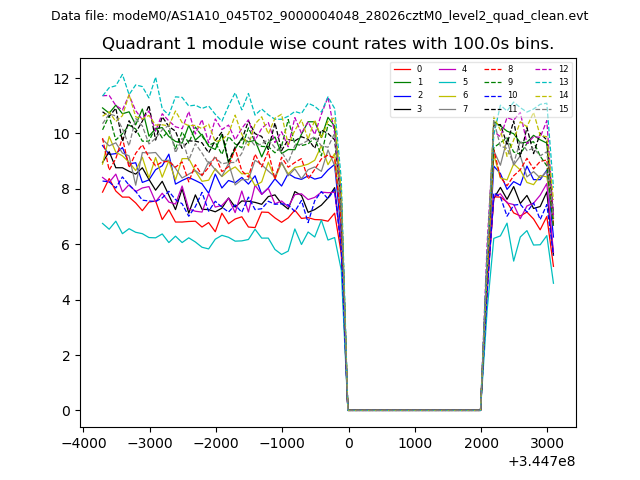
| Module-wise count rates for Quadrant A Data is divided into 100 sec bins |
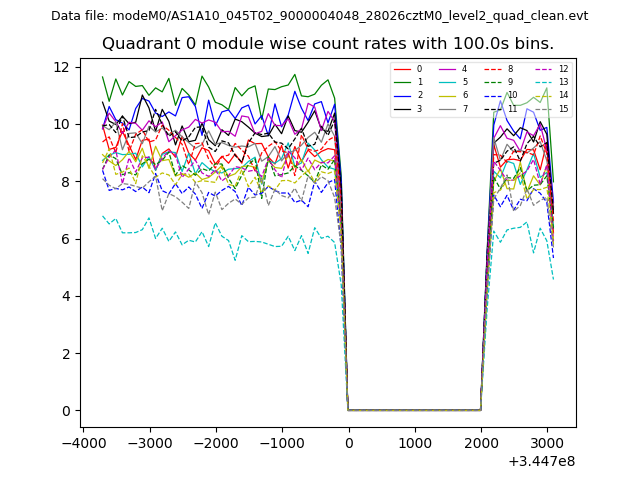 |
 |
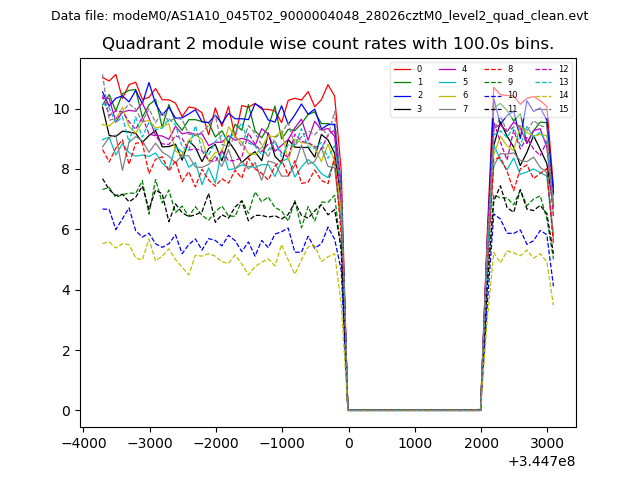
| Module-wise count rates for Quadrant B Data is divided into 100 sec bins |
 |
 |
| Module-wise count rates for Quadrant C Data is divided into 100 sec bins |
 |
 |
| Module-wise count rates for Quadrant D Data is divided into 100 sec bins |
 |
 |
| Parameter | Plot |
|---|---|
| CZT HV Monitor | 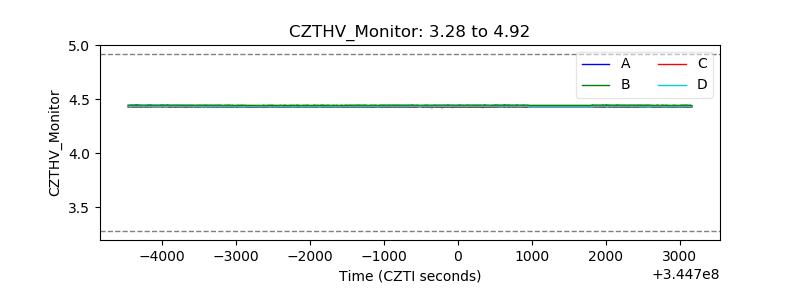 |
| D_VDD | 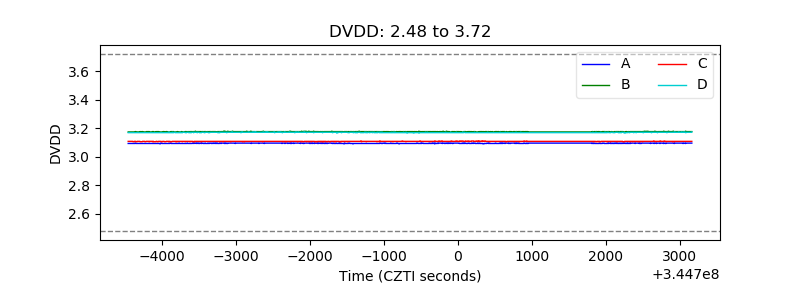 |
| Temperature 1 | 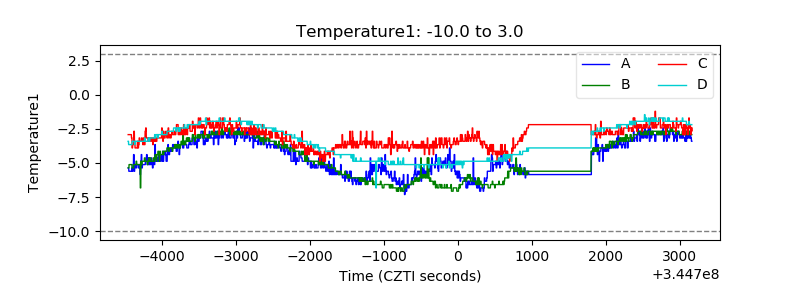 |
| Veto HV Monitor | 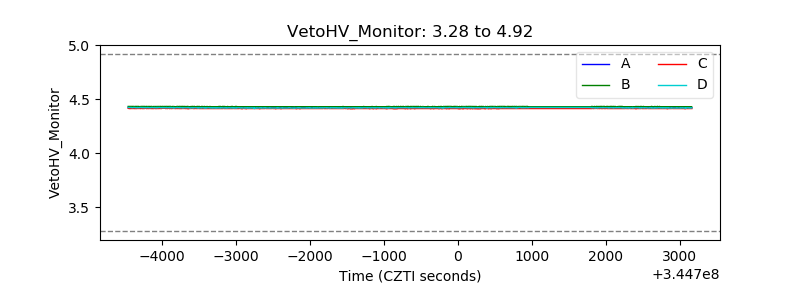 |
| Veto LLD | 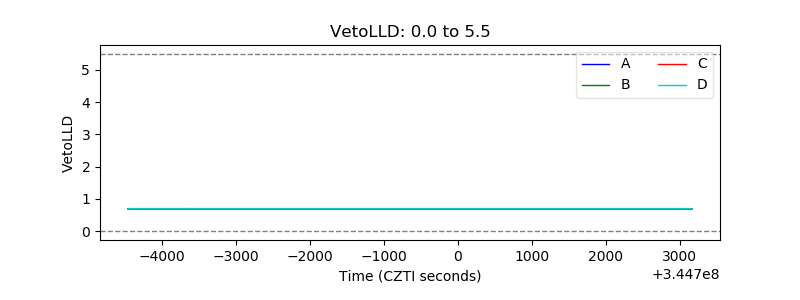 |
| Alpha Counter | 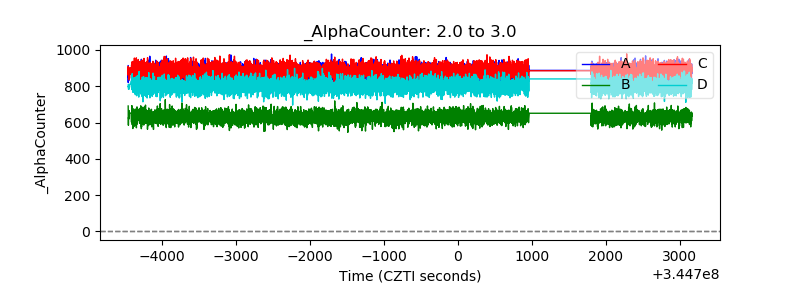 |
| _CPM_Rate | 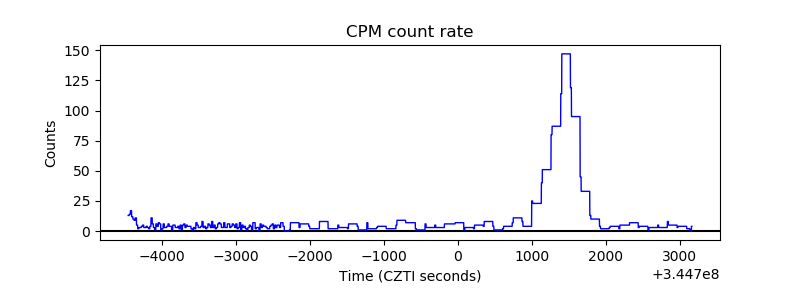 |
| CZT Counter |  |
| +2.5 Volts monitor |  |
| +5 Volts monitor | 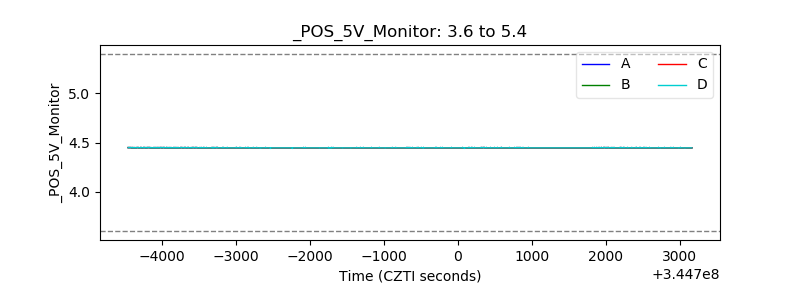 |
| _ROLL_ROT | 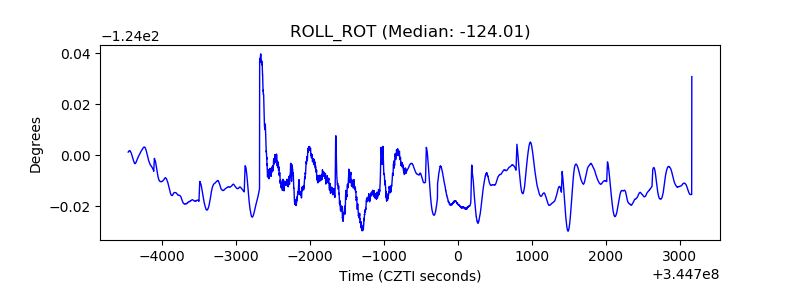 |
| _Roll_DEC | 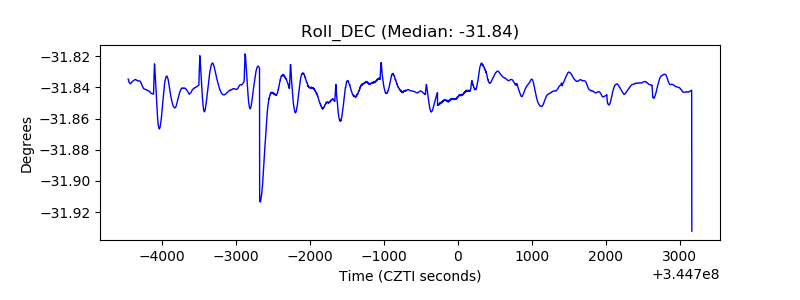 |
| _Roll_RA | 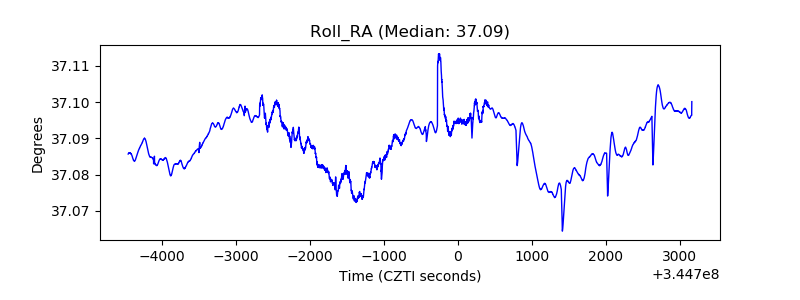 |
| Veto Counter | 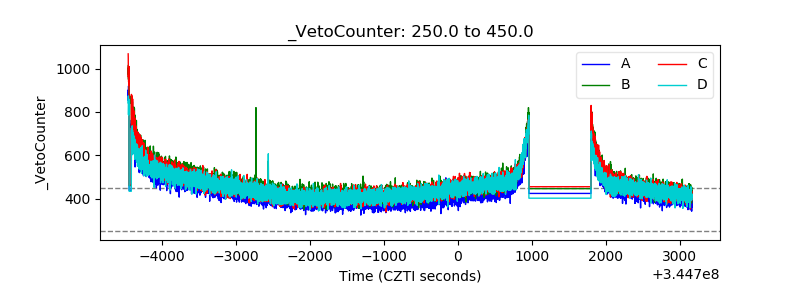 |