| Param | Original file | Final file |
|---|---|---|
| Filename | modeM0/AS1A10_045T02_9000004048_28027cztM0_level2.evt | modeM0/AS1A10_045T02_9000004048_28027cztM0_level2_quad_clean.evt |
| Size (bytes) | 169,770,240 | 41,924,160 |
| Size | 161.9 MB | 40.0 MB |
| Events in quadrant A | 1,007,743 | 289,845 |
| Events in quadrant B | 1,024,561 | 289,772 |
| Events in quadrant C | 1,116,434 | 272,322 |
| Events in quadrant D | 1,845,293 | 262,435 |
| Mode M0 | |||
|---|---|---|---|
| Quadrant | BADHDUFLAG | Total packets | Discarded packets |
| A | 0 | 4311 | 0 |
| B | 0 | 4404 | 0 |
| C | 0 | 4653 | 0 |
| D | 0 | 7018 | 0 |
| Quadrant | Total seconds | Saturated seconds | Saturation percentage |
|---|---|---|---|
| A | 2139 | 0 | 0.000000% |
| B | 2140 | 4 | 0.186916% |
| C | 2140 | 10 | 0.467290% |
| D | 2140 | 88 | 4.112150% |
Noise dominated data is calculated using 1-second bins in cleaned event files. If a bin has >2000 counts, and if more than 50% of those come from <1% of pixels, then it is considered to be noise-dominated and hence unusable.
| Quadrant | # 1 sec bins | Bins with >0 counts | Bins with >2000 counts | High rate bins dominated by noise | Noise dominated (total time) | Noise dominated (detector-on time) | Marked lightcurve |
|---|---|---|---|---|---|---|---|
| A | 2139 | 2139 | 0 | 0 | 0.00% | 0.00% | 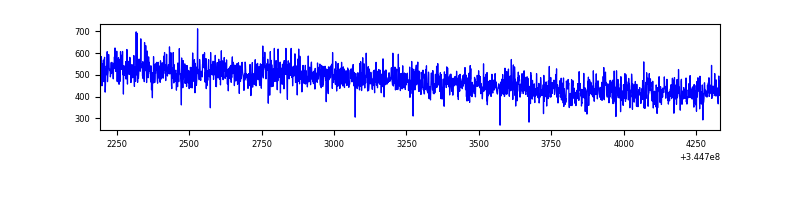 |
| B | 2140 | 2140 | 0 | 0 | 0.00% | 0.00% | 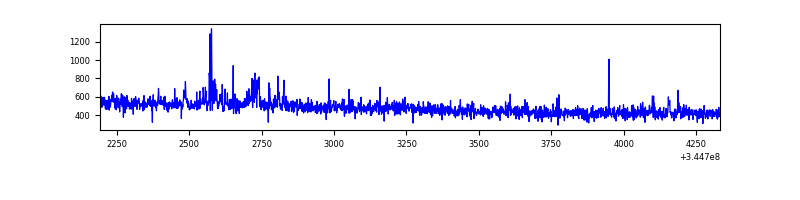 |
| C | 2140 | 2140 | 0 | 0 | 0.00% | 0.00% | 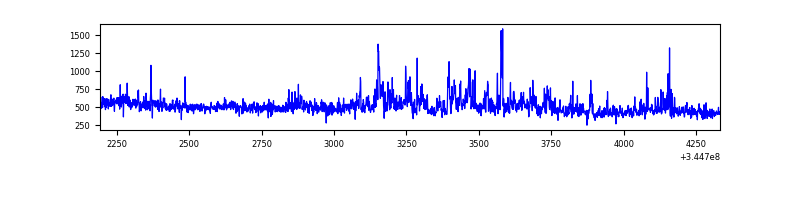 |
| D | 2140 | 2140 | 99 | 99 | 4.63% | 4.63% | 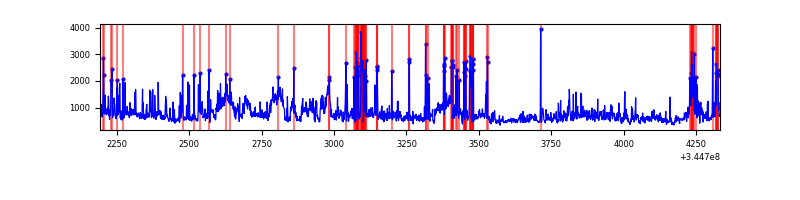 |
Top three noisy pixels from each quadrant. If the there are fewer than three noisy pixels in the level2.evt file, extra rows are filled as -1
| Pixel properties | Quadrant properties | ||||||
|---|---|---|---|---|---|---|---|
| Quadrant | DetID | PixID | Counts | Sigma | Mean | Median | Sigma |
| A | 0 | 13 | 12487 | 229.35 | 257 | 252 | 53.3 |
| A | 13 | 254 | 3672 | 64.11 | 257 | 252 | 53.3 |
| A | 8 | 34 | 2653 | 45.01 | 257 | 252 | 53.3 |
| B | 0 | 190 | 16075 | 317.61 | 253 | 247 | 49.8 |
| B | 4 | 200 | 7607 | 147.69 | 253 | 247 | 49.8 |
| B | 12 | 111 | 5833 | 112.09 | 253 | 247 | 49.8 |
| C | 3 | 233 | 149764 | 2639.67 | 237 | 238 | 56.6 |
| C | 14 | 238 | 38732 | 679.56 | 237 | 238 | 56.6 |
| C | 10 | 22 | 2060 | 32.16 | 237 | 238 | 56.6 |
| D | 8 | 195 | 400130 | 6961.78 | 237 | 230 | 57.4 |
| D | 1 | 52 | 372108 | 6473.95 | 237 | 230 | 57.4 |
| D | 7 | 80 | 144846 | 2517.59 | 237 | 230 | 57.4 |
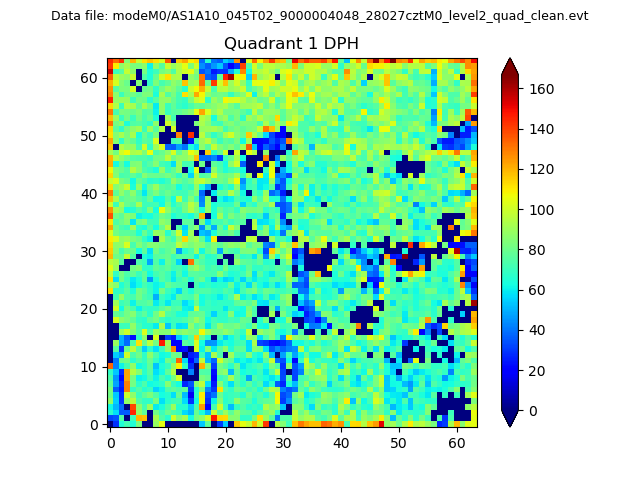
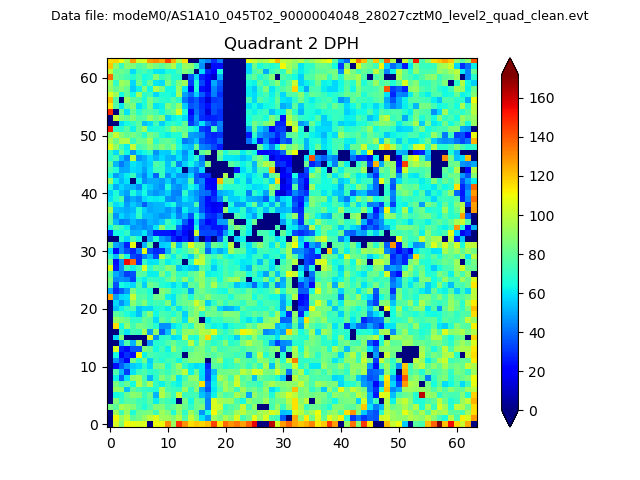
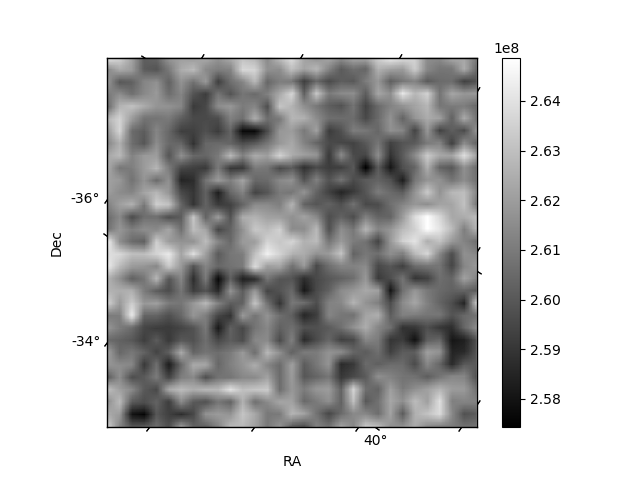
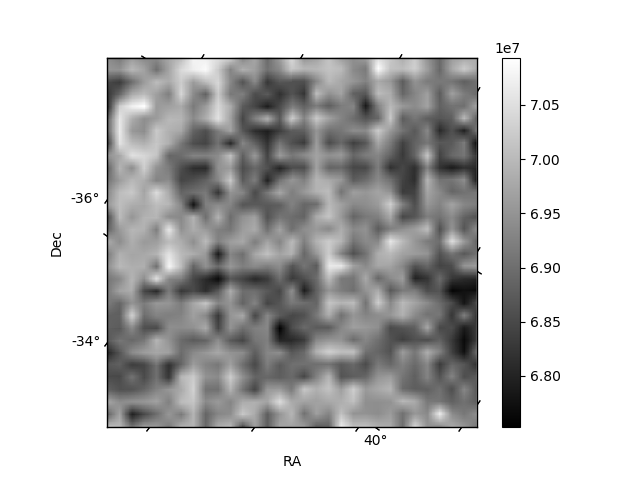
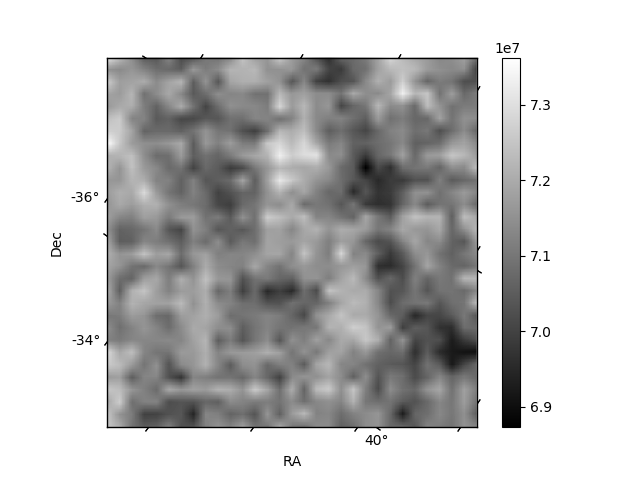
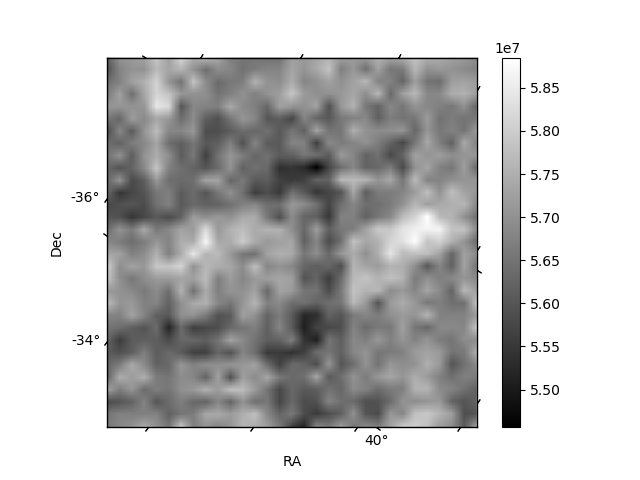
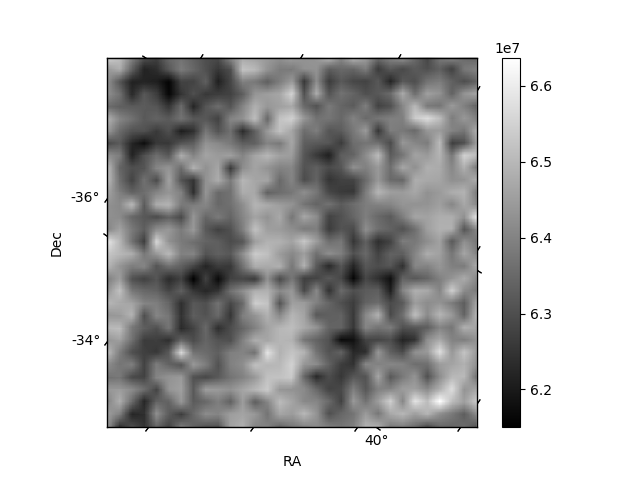
Histogram calculated using DETX and DETY for each event in the final _common_clean file
| Quadrant A |  |
 |
Quadrant B |
|---|---|---|---|
| Quadrant D | 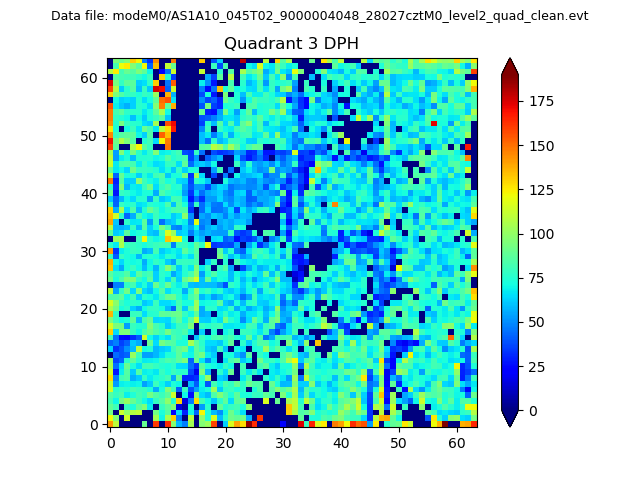 |
 |
Quadrant C |
| Plot type | Count rate plots | Images |
|---|---|---|
| Comparison with Poisson distribution Blue bars denote a histogram of data divided into 1 sec bins. Red curve is a Poisson curve with rate = median count rate of data. |
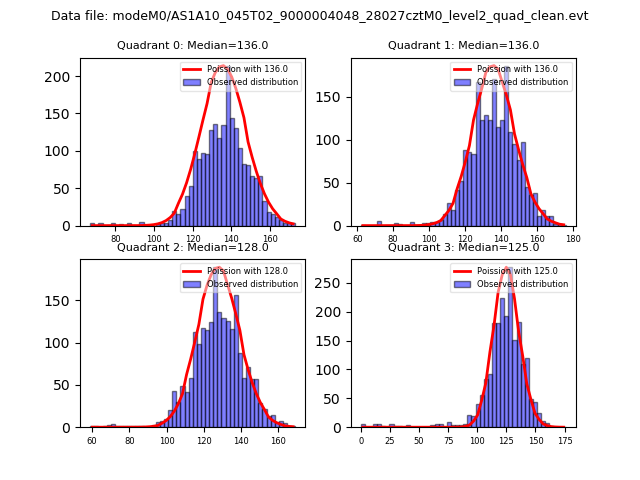 |
 |
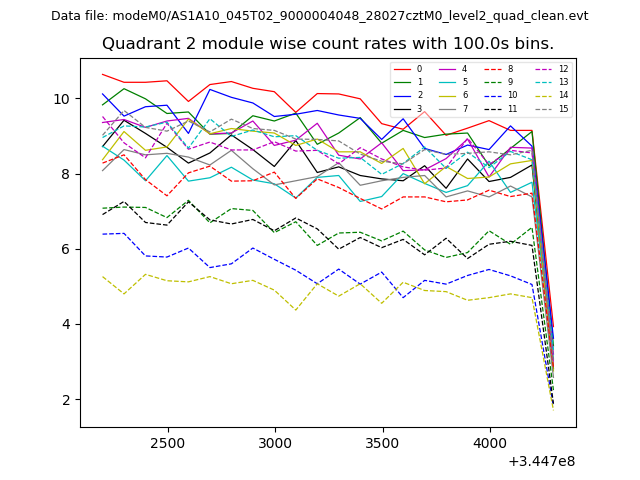
| Quadrant-wise count rates Data is divided into 100 sec bins |
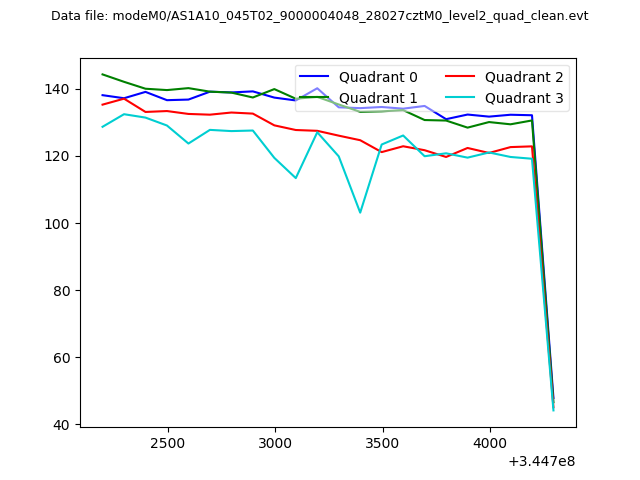 |
|
| Module-wise count rates for Quadrant A Data is divided into 100 sec bins |
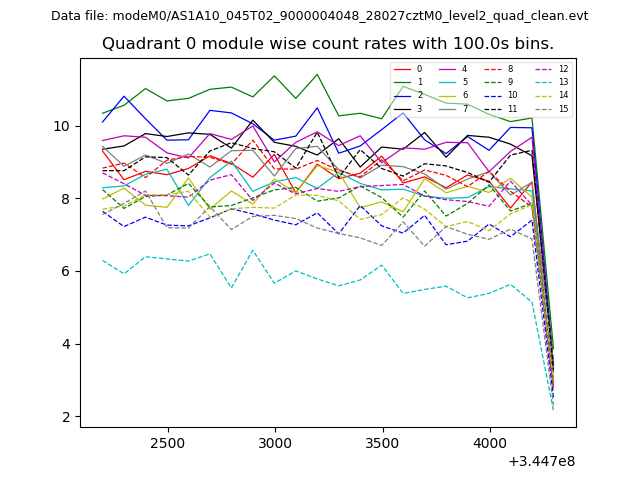 |
 |
| Module-wise count rates for Quadrant B Data is divided into 100 sec bins |
 |
 |
| Module-wise count rates for Quadrant C Data is divided into 100 sec bins |
 |
 |
| Module-wise count rates for Quadrant D Data is divided into 100 sec bins |
 |
 |
| Parameter | Plot |
|---|---|
| CZT HV Monitor |  |
| D_VDD | 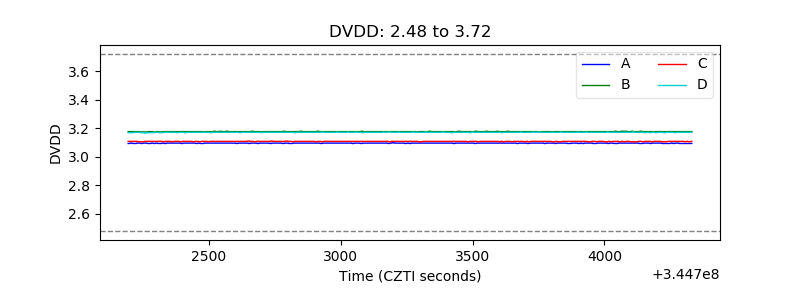 |
| Temperature 1 | 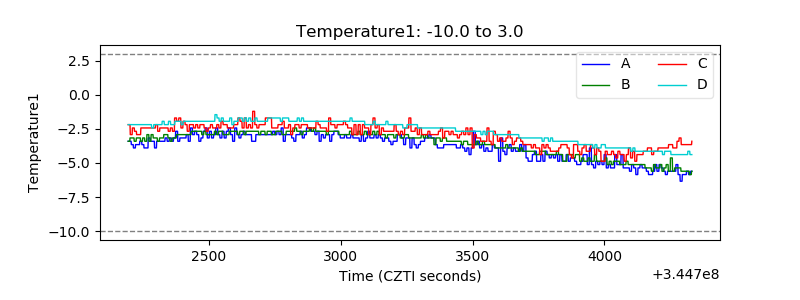 |
| Veto HV Monitor | 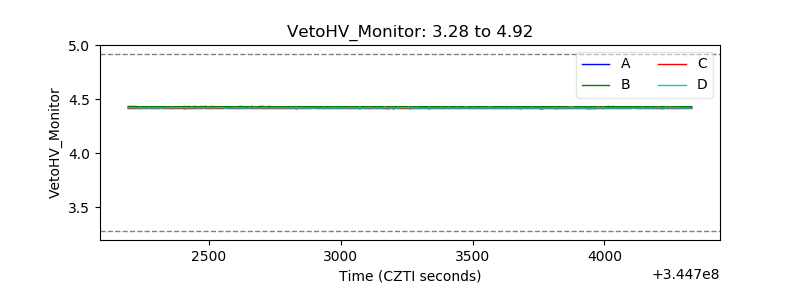 |
| Veto LLD |  |
| Alpha Counter | 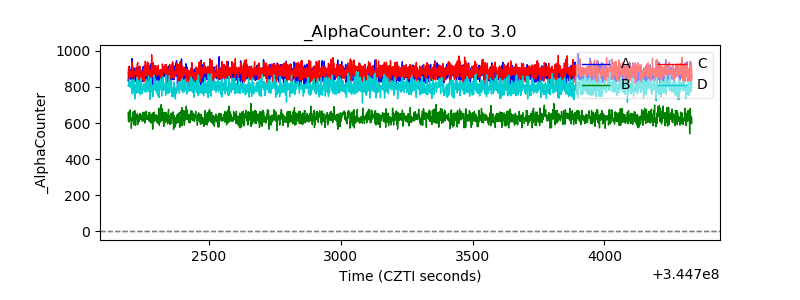 |
| _CPM_Rate | 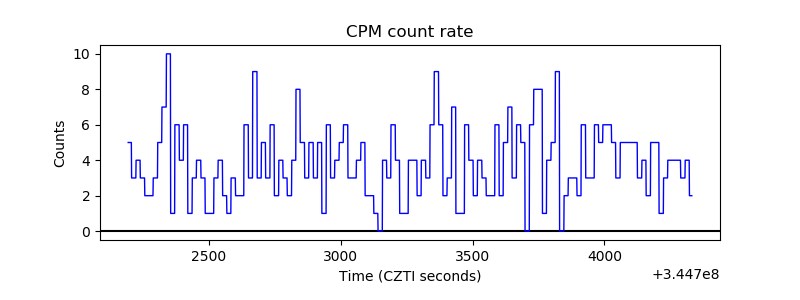 |
| CZT Counter | 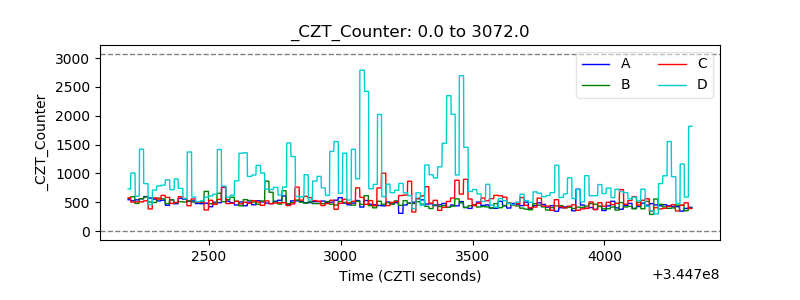 |
| +2.5 Volts monitor | 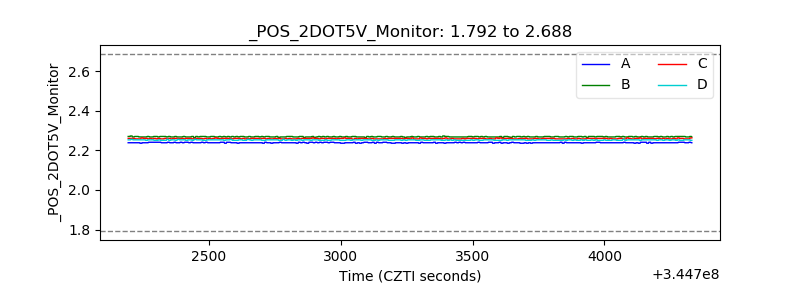 |
| +5 Volts monitor | 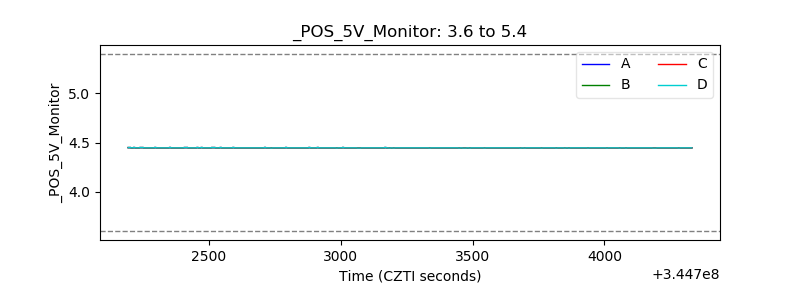 |
| _ROLL_ROT | 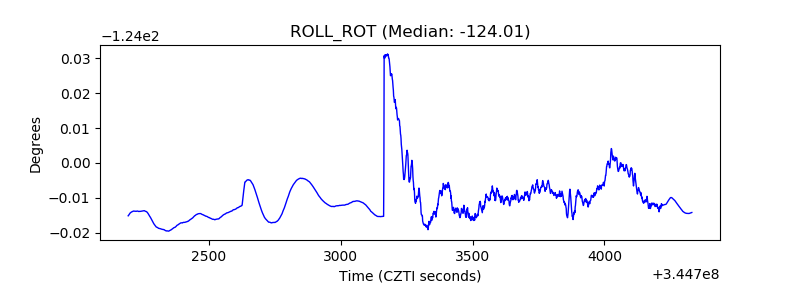 |
| _Roll_DEC | 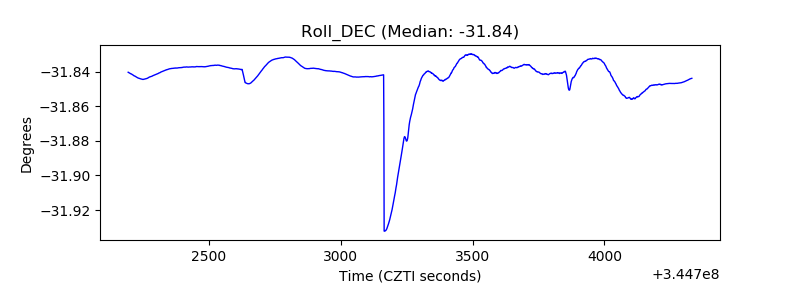 |
| _Roll_RA | 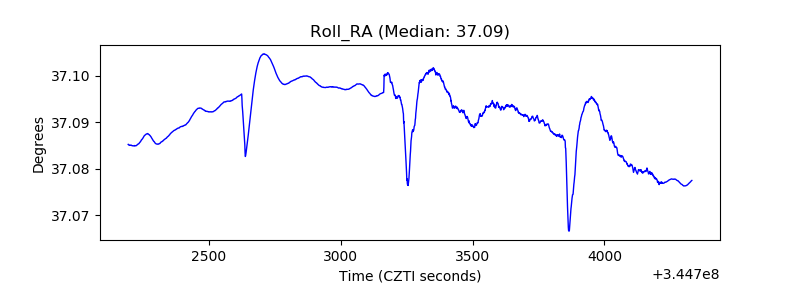 |
| Veto Counter | 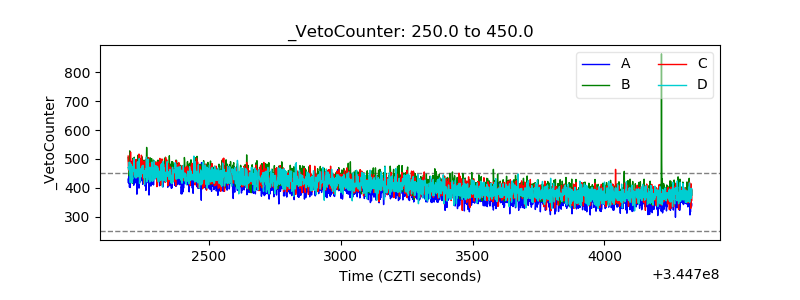 |