| Param | Original file | Final file |
|---|---|---|
| Filename | modeM0/AS1A10_048T02_9000004050cztM0_level2.fits | modeM0/AS1A10_048T02_9000004050cztM0_level2_quad_clean.evt |
| Size (bytes) | 838,491,840 | 682,758,720 |
| Size | 799.6 MB | 651.1 MB |
| Events in quadrant A | 5,257,864 | 4,043,043 |
| Events in quadrant B | 5,077,360 | 3,979,084 |
| Events in quadrant C | 5,092,718 | 3,714,474 |
| Events in quadrant D | 4,372,318 | 3,346,370 |
| Mode M0 | |||
|---|---|---|---|
| Quadrant | BADHDUFLAG | Total packets | Discarded packets |
| A | 0 | 171442 | 0 |
| B | 0 | 173692 | 0 |
| C | 0 | 181079 | 0 |
| D | 0 | 263050 | 0 |
| Mode SS | |||
|---|---|---|---|
| Quadrant | BADHDUFLAG | Total packets | Discarded packets |
| A | 0 | 1668 | 0 |
| B | 0 | 1668 | 0 |
| C | 0 | 1668 | 0 |
| D | 0 | 1668 | 0 |
| Mode M9 | |||
|---|---|---|---|
| Quadrant | BADHDUFLAG | Total packets | Discarded packets |
| A | 0 | 117 | 0 |
| B | 0 | 117 | 0 |
| C | 0 | 117 | 0 |
| D | 0 | 117 | 0 |
| Quadrant | Total seconds | Saturated seconds | Saturation percentage |
|---|---|---|---|
| A | 81548 | 927 | 1.136754% |
| B | 81548 | 1170 | 1.434738% |
| C | 81548 | 1683 | 2.063815% |
| D | 81548 | 5004 | 6.136263% |
Noise dominated data is calculated using 1-second bins in cleaned event files. If a bin has >2000 counts, and if more than 50% of those come from <1% of pixels, then it is considered to be noise-dominated and hence unusable.
| Quadrant | # 1 sec bins | Bins with >0 counts | Bins with >2000 counts | High rate bins dominated by noise | Noise dominated (total time) | Noise dominated (detector-on time) | Marked lightcurve |
|---|---|---|---|---|---|---|---|
| A | 93583 | 81540 | 0 | 0 | 0.00% | 0.00% | 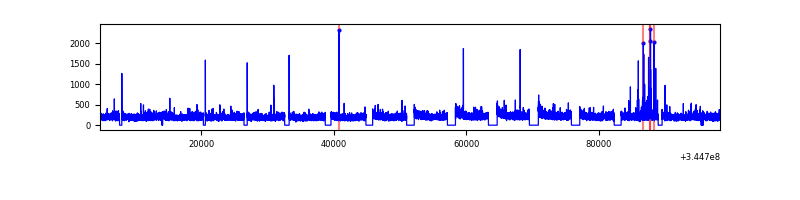 |
| B | 93583 | 81535 | 0 | 0 | 0.00% | 0.00% |  |
| C | 93583 | 81536 | 0 | 0 | 0.00% | 0.00% | 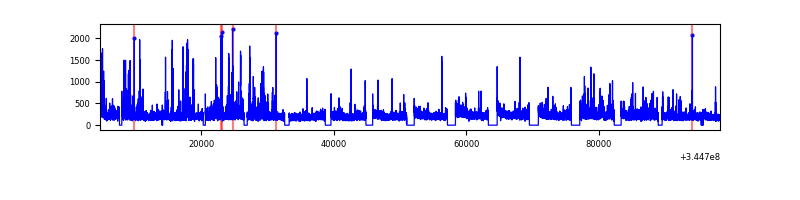 |
| D | 93583 | 81508 | 0 | 0 | 0.00% | 0.00% | 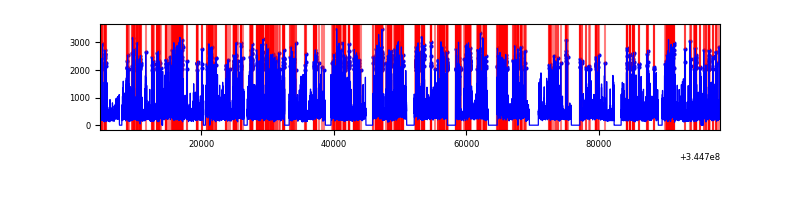 |
Top three noisy pixels from each quadrant. If the there are fewer than three noisy pixels in the level2.evt file, extra rows are filled as -1
| Pixel properties | Quadrant properties | ||||||
|---|---|---|---|---|---|---|---|
| Quadrant | DetID | PixID | Counts | Sigma | Mean | Median | Sigma |
| A | 7 | 110 | 4210 | 8.83 | 1370 | 1292 | 330.3 |
| A | 0 | 29 | 4177 | 8.73 | 1370 | 1292 | 330.3 |
| A | 9 | 19 | 4089 | 8.47 | 1370 | 1292 | 330.3 |
| B | 2 | 9 | 4053 | 10.56 | 1340 | 1282 | 262.4 |
| B | 5 | 128 | 3401 | 8.08 | 1340 | 1282 | 262.4 |
| B | 2 | 8 | 3341 | 7.85 | 1340 | 1282 | 262.4 |
| C | 1 | 81 | 3891 | 7.79 | 1346 | 1265 | 337.0 |
| C | 1 | 80 | 3730 | 7.32 | 1346 | 1265 | 337.0 |
| C | 12 | 241 | 3559 | 6.81 | 1346 | 1265 | 337.0 |
| D | 6 | 231 | 3099 | 5.99 | 1248 | 1143 | 326.7 |
| D | 3 | 14 | 3098 | 5.98 | 1248 | 1143 | 326.7 |
| D | 6 | 67 | 3088 | 5.95 | 1248 | 1143 | 326.7 |
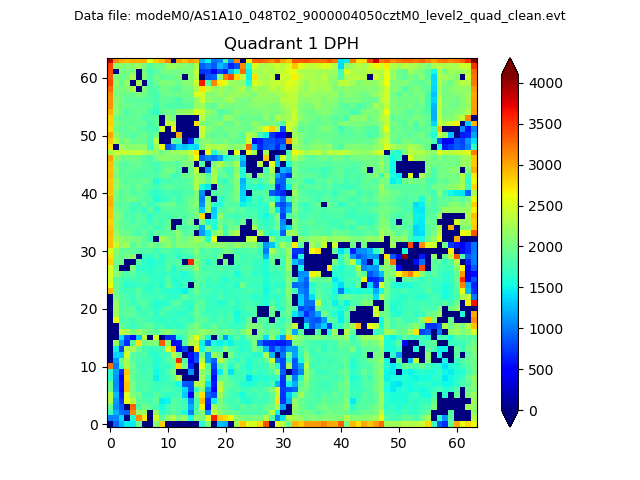
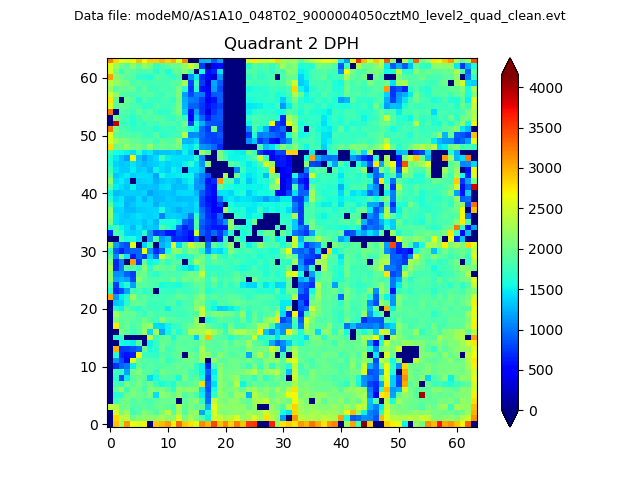
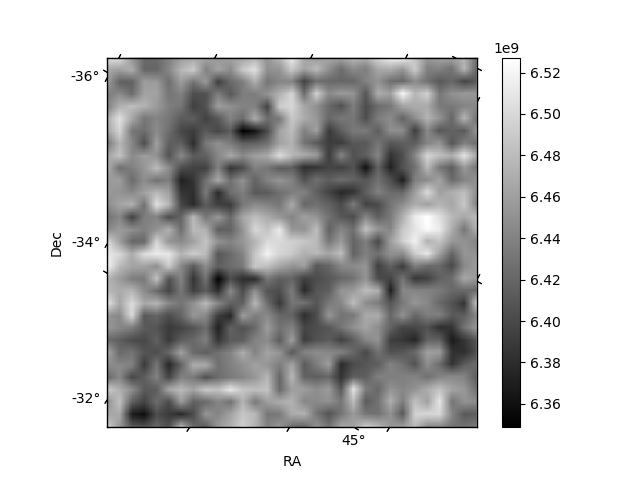
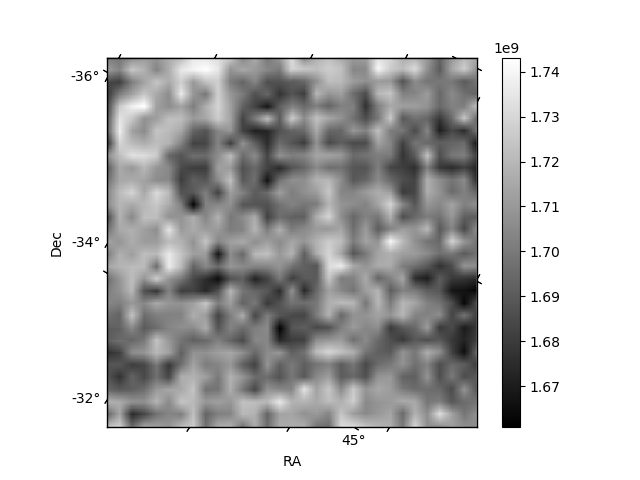
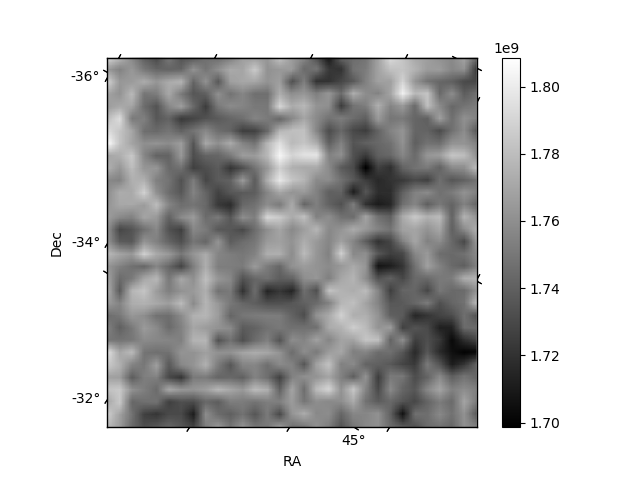
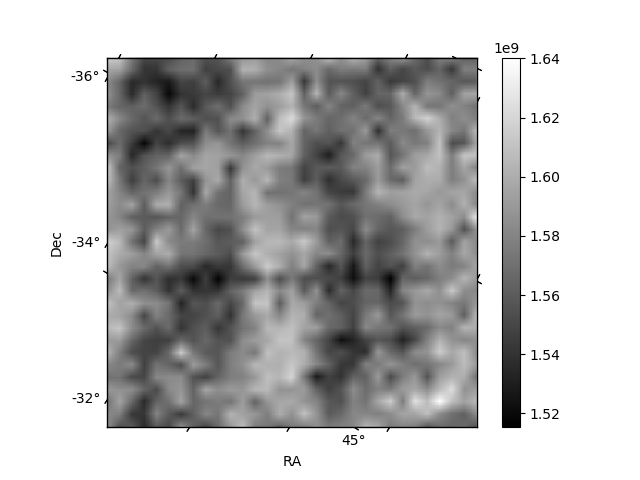
Histogram calculated using DETX and DETY for each event in the final _common_clean file
| Quadrant A | 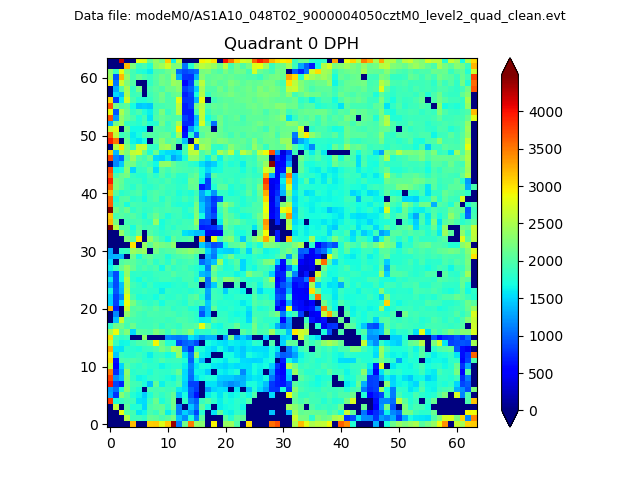 |
 |
Quadrant B |
|---|---|---|---|
| Quadrant D | 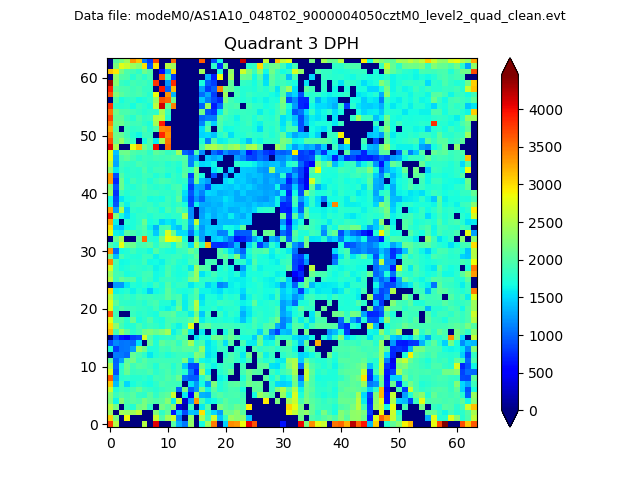 |
 |
Quadrant C |
| Plot type | Count rate plots | Images |
|---|---|---|
| Comparison with Poisson distribution Blue bars denote a histogram of data divided into 1 sec bins. Red curve is a Poisson curve with rate = median count rate of data. |
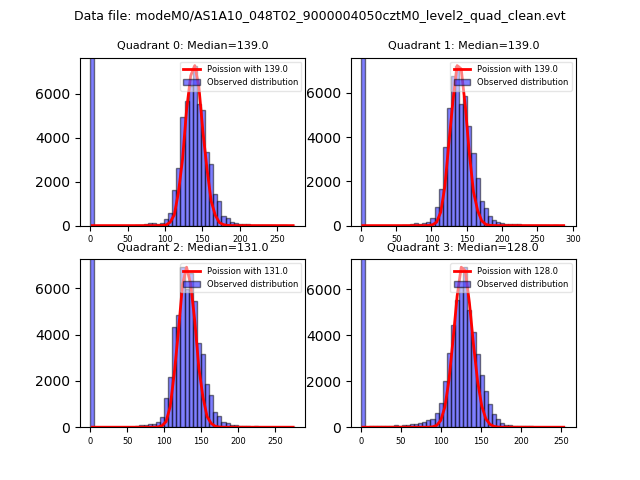 |
 |
| Quadrant-wise count rates Data is divided into 100 sec bins |
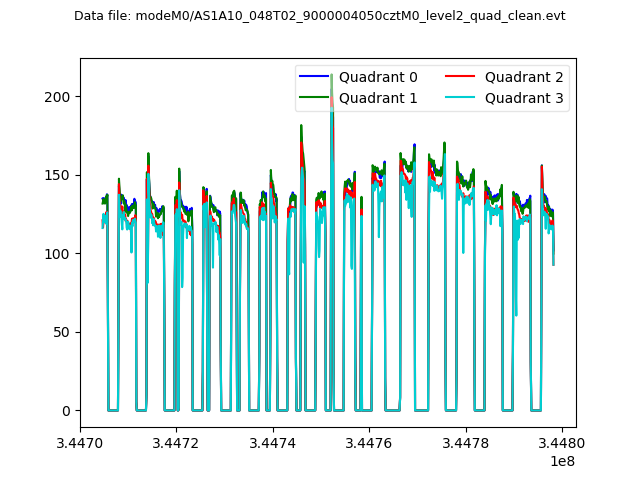 |
|
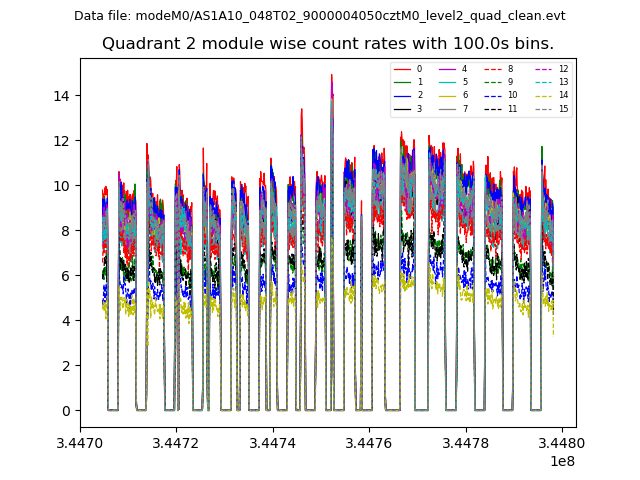
| Module-wise count rates for Quadrant A Data is divided into 100 sec bins |
 |
 |
| Module-wise count rates for Quadrant B Data is divided into 100 sec bins |
 |
 |
| Module-wise count rates for Quadrant C Data is divided into 100 sec bins |
 |
 |
| Module-wise count rates for Quadrant D Data is divided into 100 sec bins |
 |
 |
| Parameter | Plot |
|---|---|
| CZT HV Monitor | 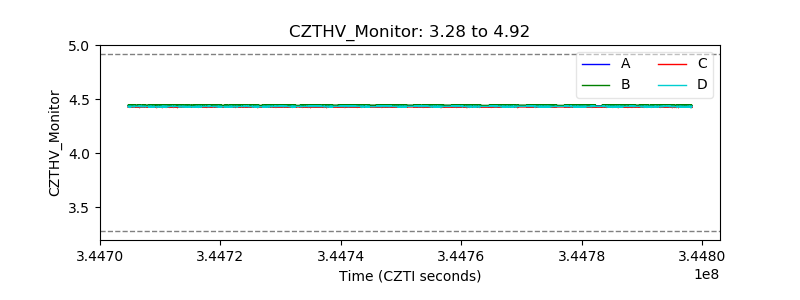 |
| D_VDD | 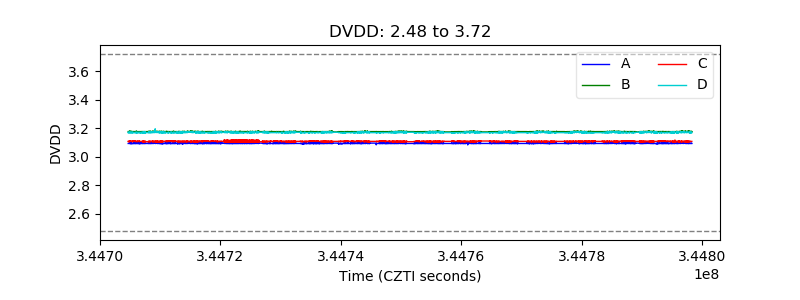 |
| Temperature 1 | 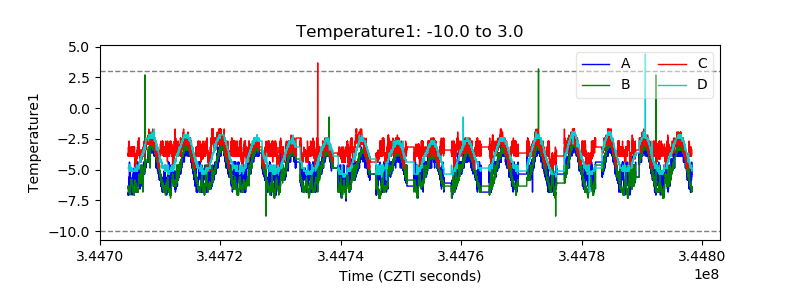 |
| Veto HV Monitor | 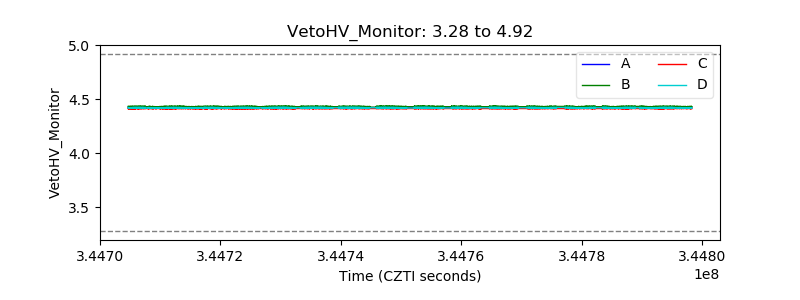 |
| Veto LLD | 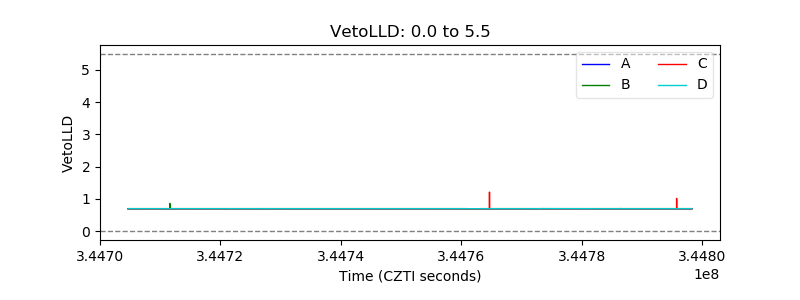 |
| Alpha Counter |  |
| _CPM_Rate | 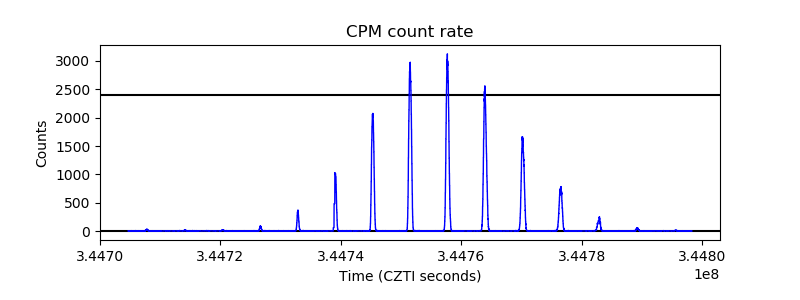 |
| CZT Counter | 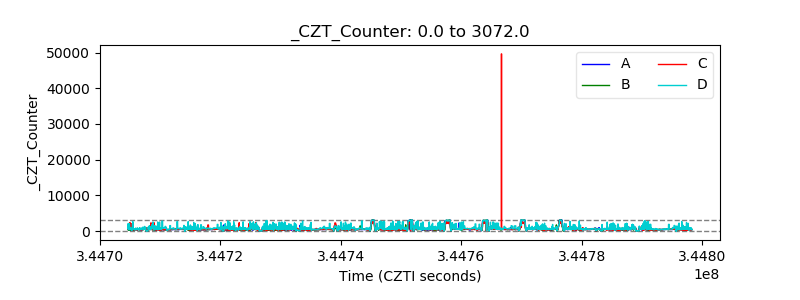 |
| +2.5 Volts monitor | 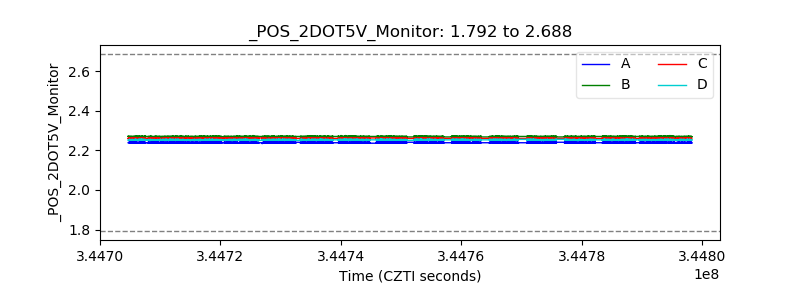 |
| +5 Volts monitor | 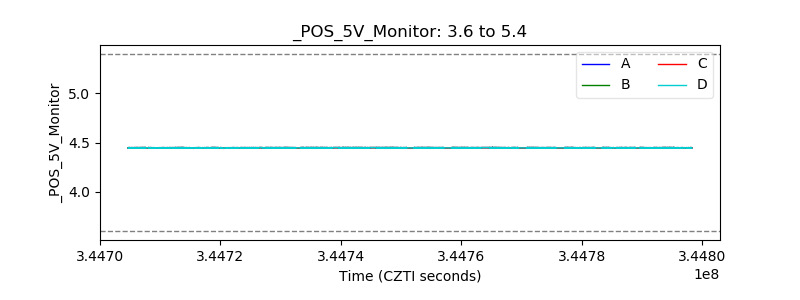 |
| _ROLL_ROT | 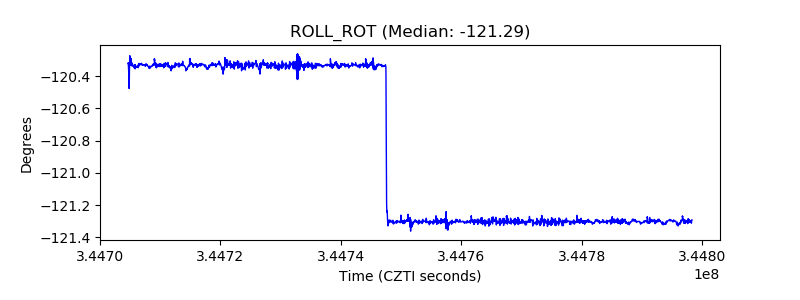 |
| _Roll_DEC | 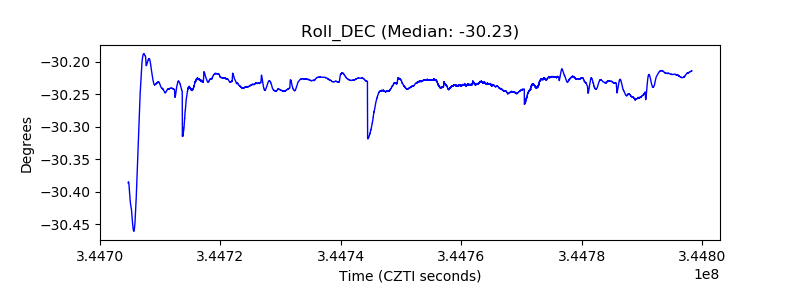 |
| _Roll_RA | 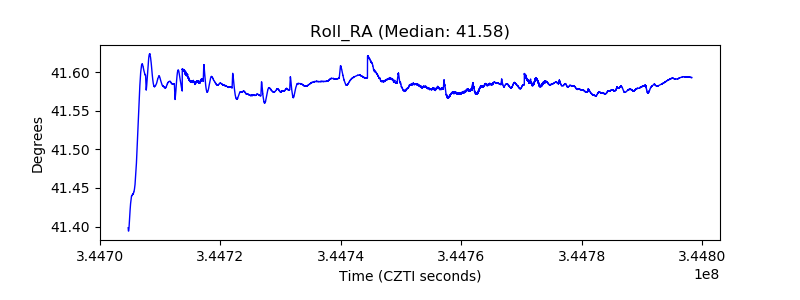 |
| Veto Counter |  |