| Param | Original file | Final file |
|---|---|---|
| Filename | modeM0/AS1A10_048T02_9000004050_28027cztM0_level2.evt | modeM0/AS1A10_048T02_9000004050_28027cztM0_level2_quad_clean.evt |
| Size (bytes) | 385,081,920 | 59,659,200 |
| Size | 367.2 MB | 56.9 MB |
| Events in quadrant A | 2,338,047 | 385,403 |
| Events in quadrant B | 2,394,069 | 384,528 |
| Events in quadrant C | 2,917,326 | 357,459 |
| Events in quadrant D | 3,695,428 | 351,119 |
| Mode M0 | |||
|---|---|---|---|
| Quadrant | BADHDUFLAG | Total packets | Discarded packets |
| A | 0 | 9794 | 0 |
| B | 0 | 9941 | 0 |
| C | 0 | 11714 | 0 |
| D | 0 | 14148 | 0 |
| Mode M9 | |||
|---|---|---|---|
| Quadrant | BADHDUFLAG | Total packets | Discarded packets |
| A | 0 | 4 | 0 |
| B | 0 | 4 | 0 |
| C | 0 | 4 | 0 |
| D | 0 | 4 | 0 |
| Quadrant | Total seconds | Saturated seconds | Saturation percentage |
|---|---|---|---|
| A | 4669 | 101 | 2.163204% |
| B | 4669 | 124 | 2.655815% |
| C | 4669 | 184 | 3.940887% |
| D | 4669 | 138 | 2.955665% |
Noise dominated data is calculated using 1-second bins in cleaned event files. If a bin has >2000 counts, and if more than 50% of those come from <1% of pixels, then it is considered to be noise-dominated and hence unusable.
| Quadrant | # 1 sec bins | Bins with >0 counts | Bins with >2000 counts | High rate bins dominated by noise | Noise dominated (total time) | Noise dominated (detector-on time) | Marked lightcurve |
|---|---|---|---|---|---|---|---|
| A | 5034 | 4669 | 0 | 0 | 0.00% | 0.00% | 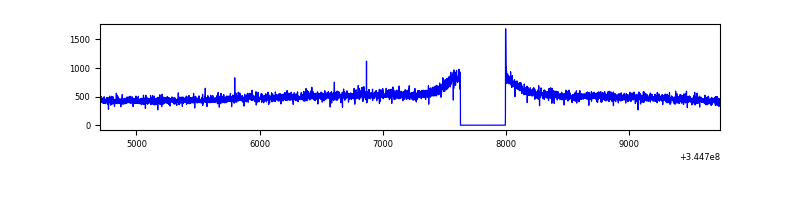 |
| B | 5034 | 4669 | 1 | 1 | 0.02% | 0.02% | 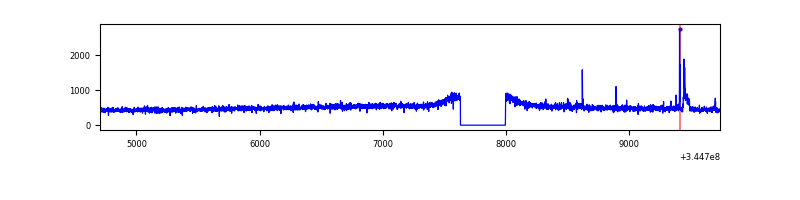 |
| C | 5034 | 4669 | 36 | 36 | 0.72% | 0.77% | 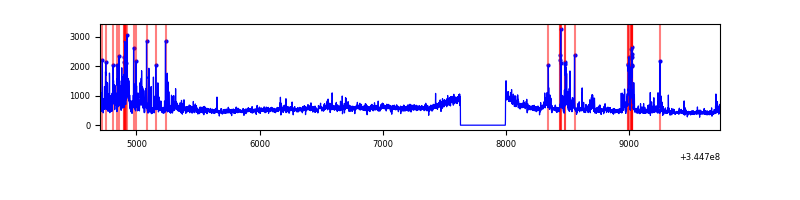 |
| D | 5034 | 4670 | 96 | 96 | 1.91% | 2.06% | 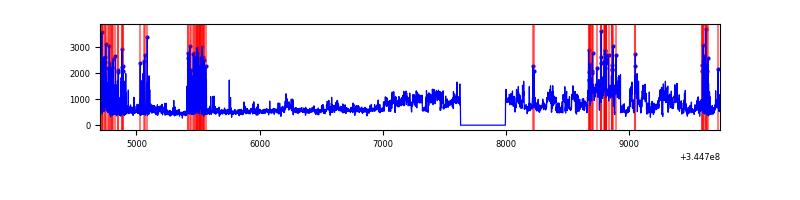 |
Top three noisy pixels from each quadrant. If the there are fewer than three noisy pixels in the level2.evt file, extra rows are filled as -1
| Pixel properties | Quadrant properties | ||||||
|---|---|---|---|---|---|---|---|
| Quadrant | DetID | PixID | Counts | Sigma | Mean | Median | Sigma |
| A | 13 | 254 | 7923 | 59.53 | 603 | 590 | 123.2 |
| A | 3 | 137 | 6275 | 46.15 | 603 | 590 | 123.2 |
| A | 0 | 13 | 5971 | 43.68 | 603 | 590 | 123.2 |
| B | 3 | 209 | 19461 | 161.34 | 599 | 583 | 117.0 |
| B | 12 | 111 | 14785 | 121.38 | 599 | 583 | 117.0 |
| B | 11 | 111 | 13312 | 108.79 | 599 | 583 | 117.0 |
| C | 3 | 233 | 565806 | 4197.45 | 575 | 578 | 134.7 |
| C | 14 | 238 | 91759 | 677.12 | 575 | 578 | 134.7 |
| C | 2 | 16 | 19027 | 137.0 | 575 | 578 | 134.7 |
| D | 8 | 195 | 1216152 | 8739.35 | 579 | 564 | 139.1 |
| D | 1 | 52 | 254329 | 1824.42 | 579 | 564 | 139.1 |
| D | 2 | 234 | 17697 | 123.18 | 579 | 564 | 139.1 |
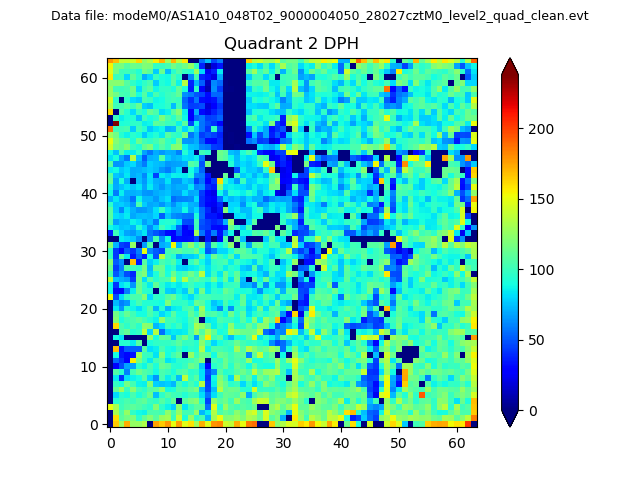
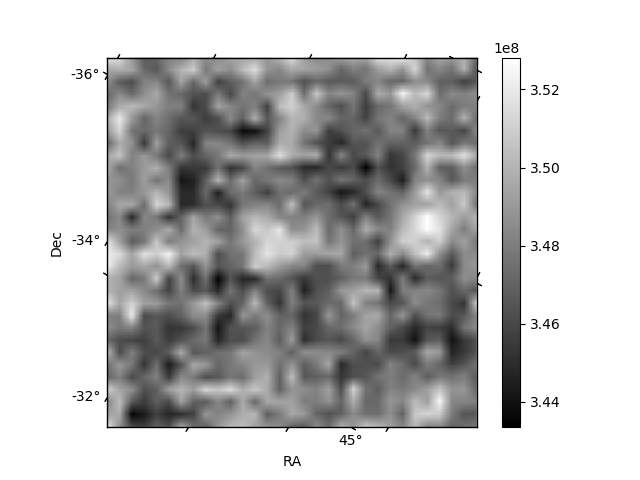
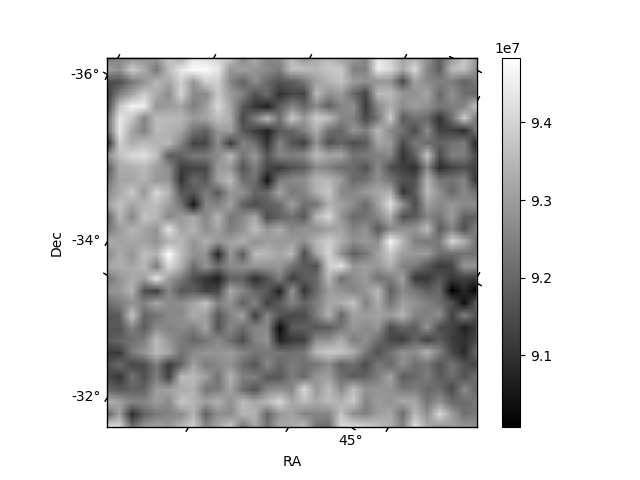
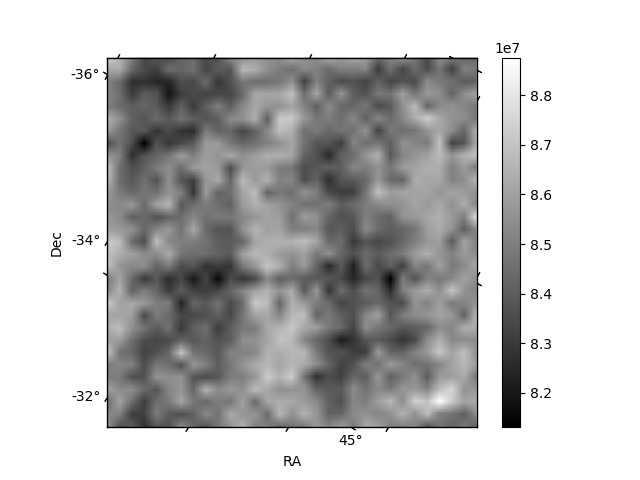
Histogram calculated using DETX and DETY for each event in the final _common_clean file
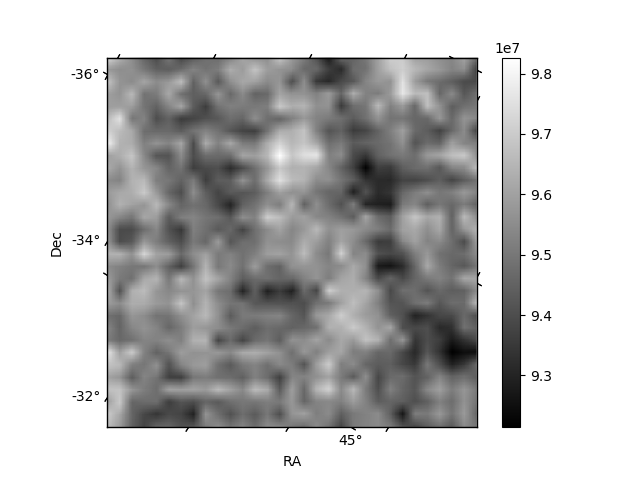
| Quadrant A | 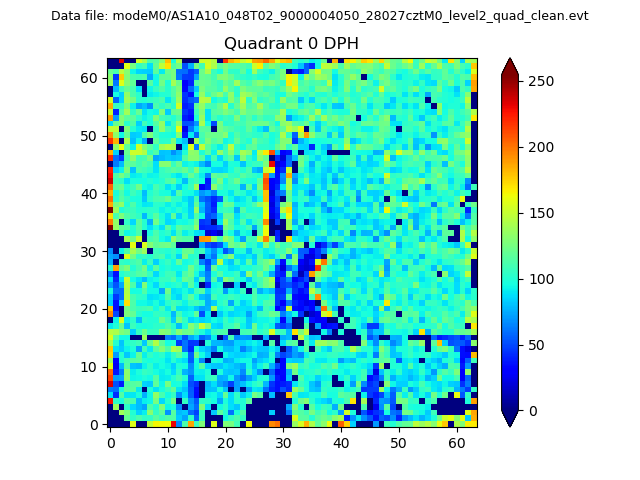 |
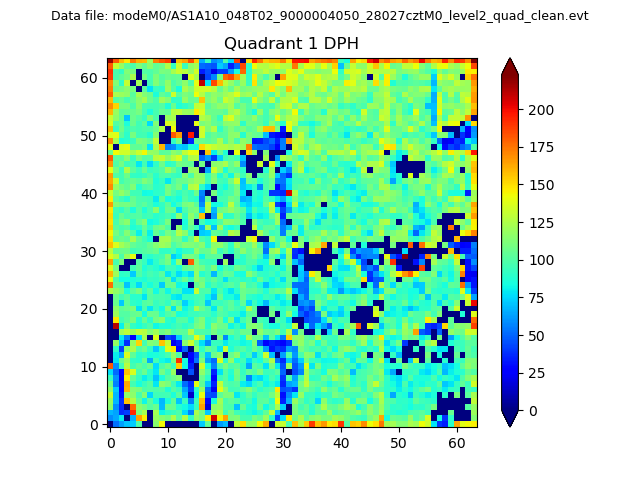 |
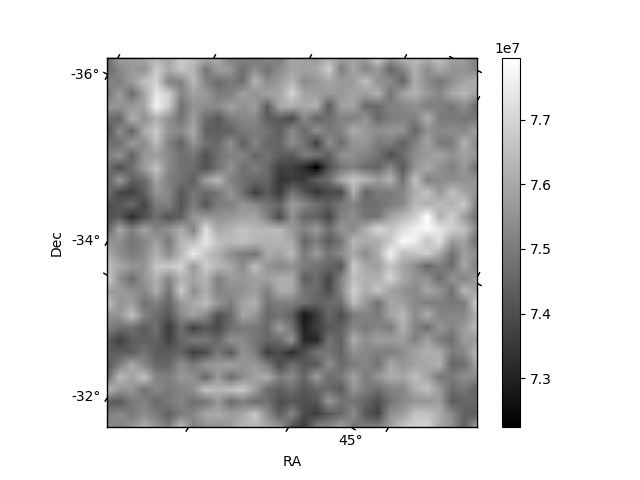
Quadrant B |
|---|---|---|---|
| Quadrant D | 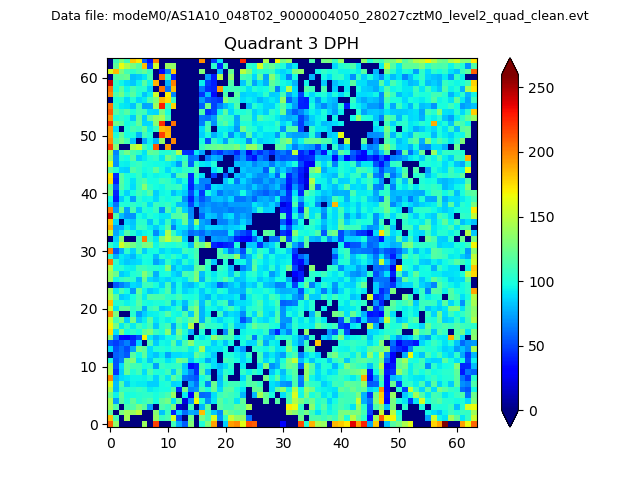 |
 |
Quadrant C |
| Plot type | Count rate plots | Images |
|---|---|---|
| Comparison with Poisson distribution Blue bars denote a histogram of data divided into 1 sec bins. Red curve is a Poisson curve with rate = median count rate of data. |
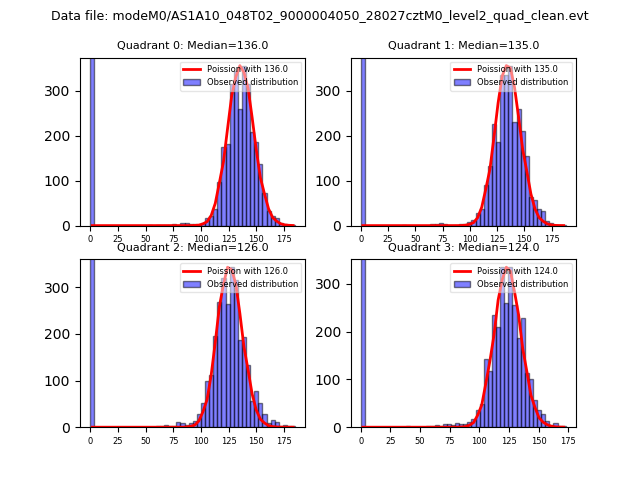 |
 |
| Quadrant-wise count rates Data is divided into 100 sec bins |
 |
|
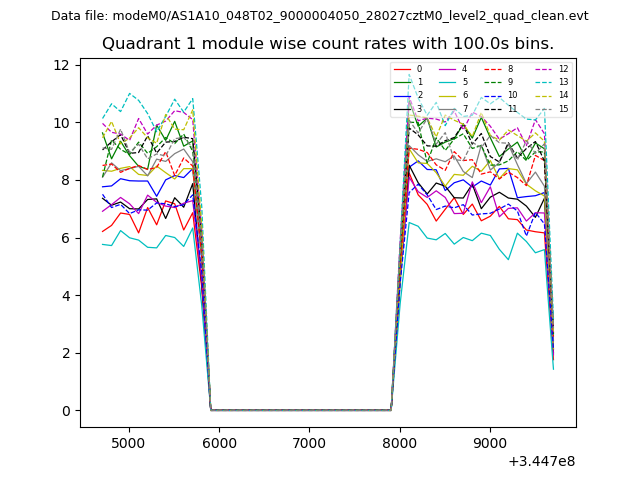
| Module-wise count rates for Quadrant A Data is divided into 100 sec bins |
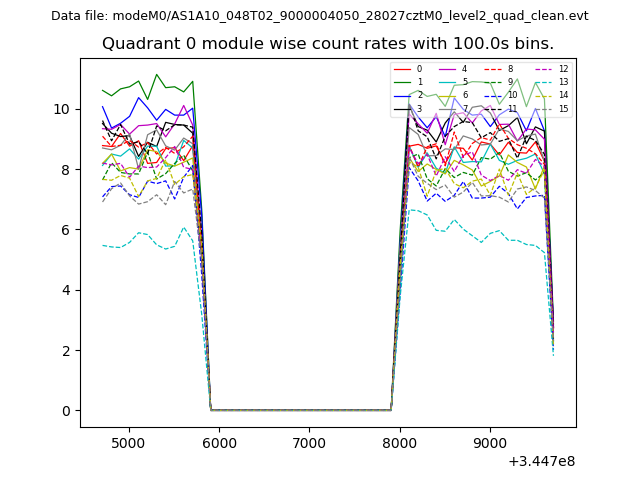 |
 |
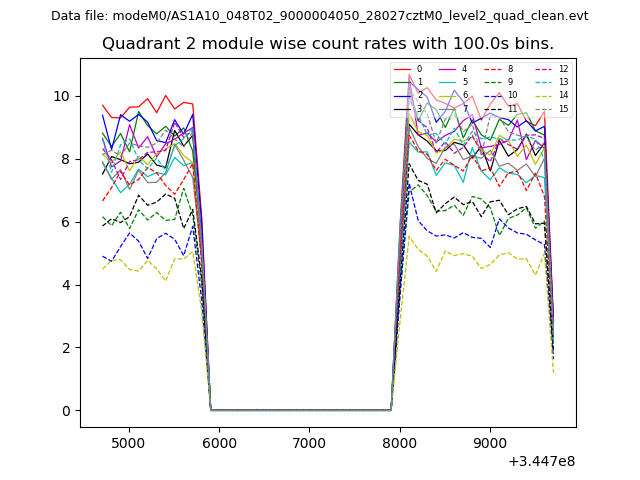
| Module-wise count rates for Quadrant B Data is divided into 100 sec bins |
 |
 |
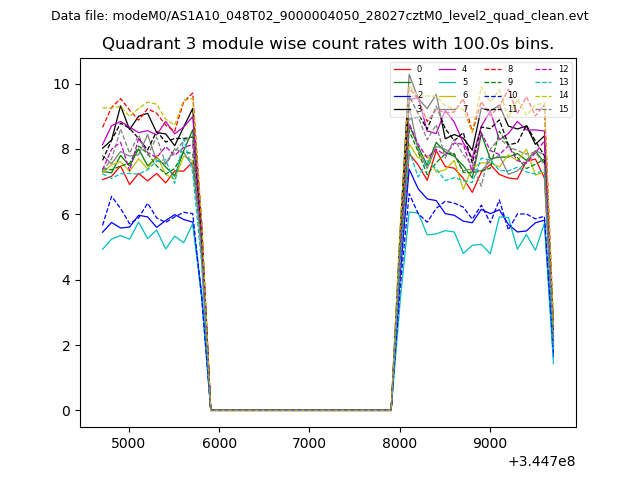
| Module-wise count rates for Quadrant C Data is divided into 100 sec bins |
 |
 |
| Module-wise count rates for Quadrant D Data is divided into 100 sec bins |
 |
 |
| Parameter | Plot |
|---|---|
| CZT HV Monitor | 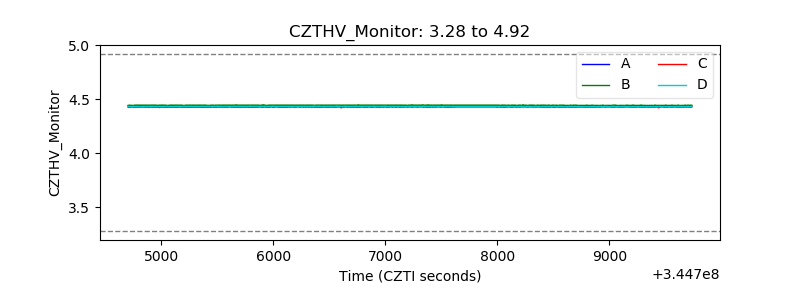 |
| D_VDD | 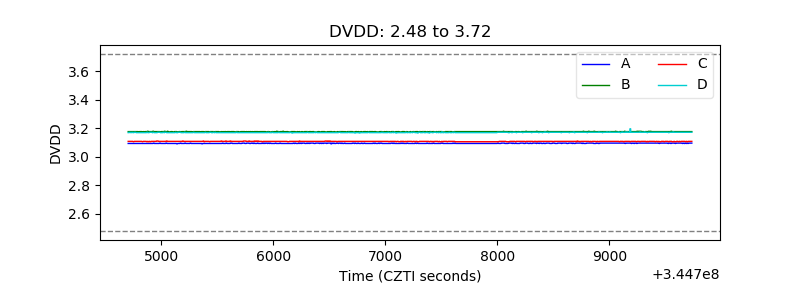 |
| Temperature 1 | 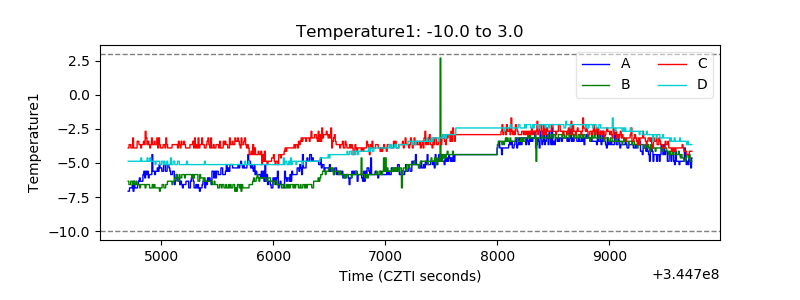 |
| Veto HV Monitor | 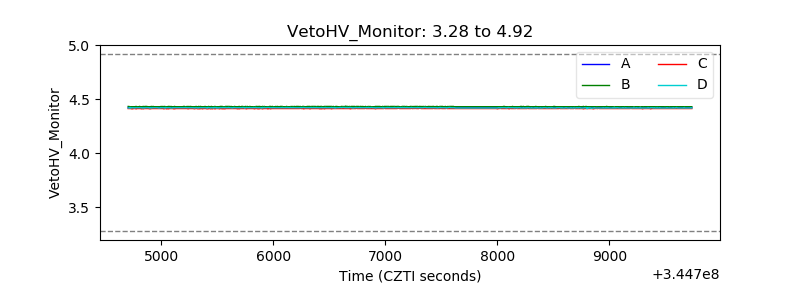 |
| Veto LLD | 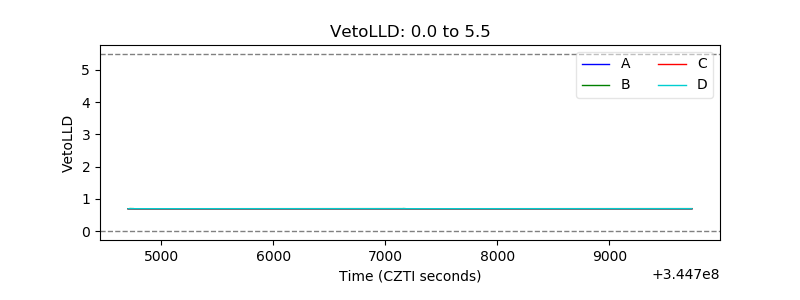 |
| Alpha Counter | 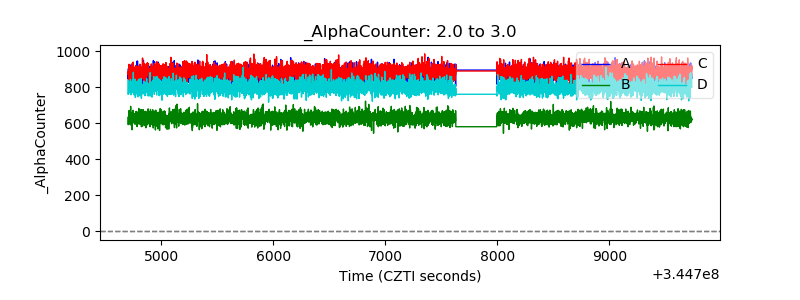 |
| _CPM_Rate |  |
| CZT Counter | 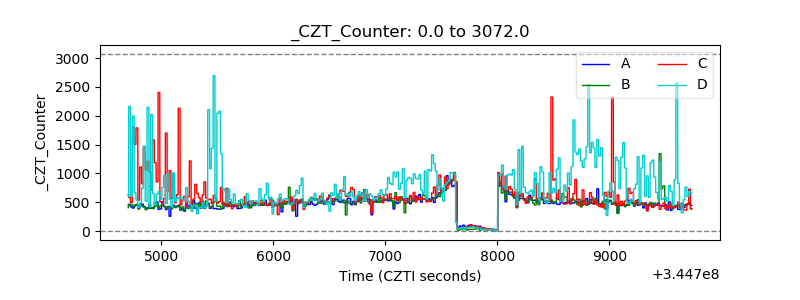 |
| +2.5 Volts monitor |  |
| +5 Volts monitor |  |
| _ROLL_ROT | 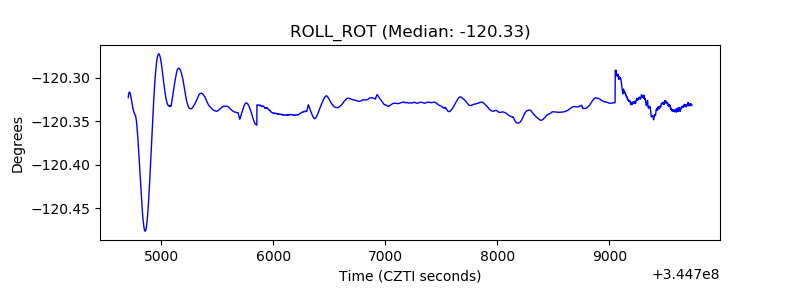 |
| _Roll_DEC | 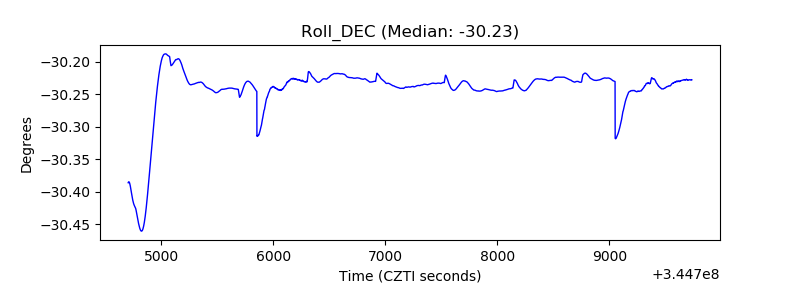 |
| _Roll_RA | 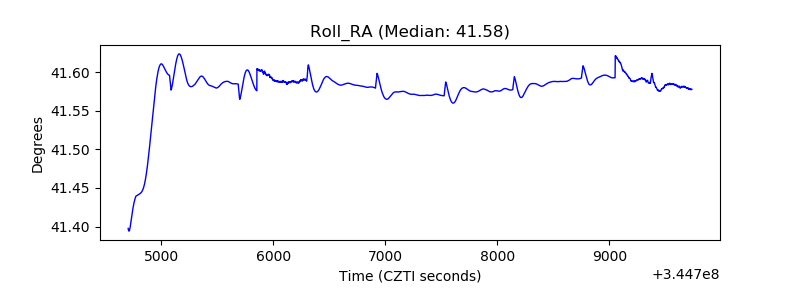 |
| Veto Counter | 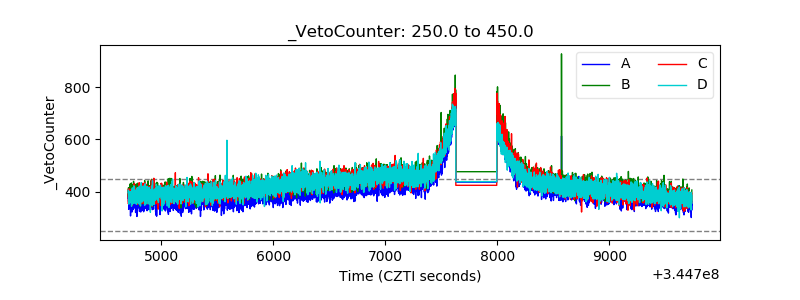 |