| Param | Original file | Final file |
|---|---|---|
| Filename | modeM0/AS1A10_048T02_9000004050_28028cztM0_level2.evt | modeM0/AS1A10_048T02_9000004050_28028cztM0_level2_quad_clean.evt |
| Size (bytes) | 598,596,480 | 107,363,520 |
| Size | 570.9 MB | 102.4 MB |
| Events in quadrant A | 3,642,476 | 710,617 |
| Events in quadrant B | 3,719,168 | 705,457 |
| Events in quadrant C | 4,012,029 | 664,663 |
| Events in quadrant D | 6,246,818 | 648,898 |
| Mode M0 | |||
|---|---|---|---|
| Quadrant | BADHDUFLAG | Total packets | Discarded packets |
| A | 0 | 15595 | 0 |
| B | 0 | 15760 | 0 |
| C | 0 | 16687 | 0 |
| D | 0 | 23867 | 0 |
| Mode M9 | |||
|---|---|---|---|
| Quadrant | BADHDUFLAG | Total packets | Discarded packets |
| A | 0 | 1 | 0 |
| B | 0 | 1 | 0 |
| C | 0 | 1 | 0 |
| D | 0 | 1 | 0 |
| Quadrant | Total seconds | Saturated seconds | Saturation percentage |
|---|---|---|---|
| A | 7497 | 88 | 1.173803% |
| B | 7498 | 138 | 1.840491% |
| C | 7498 | 179 | 2.387303% |
| D | 7498 | 287 | 3.827687% |
Noise dominated data is calculated using 1-second bins in cleaned event files. If a bin has >2000 counts, and if more than 50% of those come from <1% of pixels, then it is considered to be noise-dominated and hence unusable.
| Quadrant | # 1 sec bins | Bins with >0 counts | Bins with >2000 counts | High rate bins dominated by noise | Noise dominated (total time) | Noise dominated (detector-on time) | Marked lightcurve |
|---|---|---|---|---|---|---|---|
| A | 7587 | 7499 | 0 | 0 | 0.00% | 0.00% | 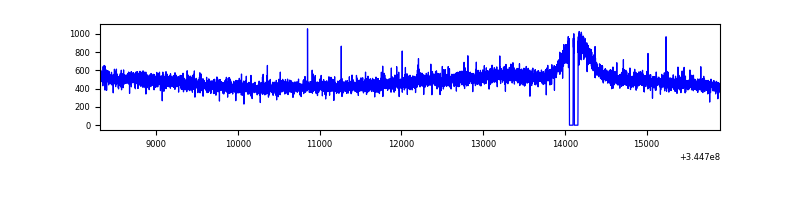 |
| B | 7588 | 7499 | 1 | 1 | 0.01% | 0.01% | 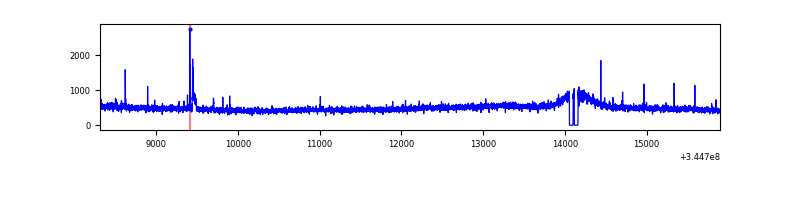 |
| C | 7588 | 7500 | 38 | 38 | 0.50% | 0.51% | 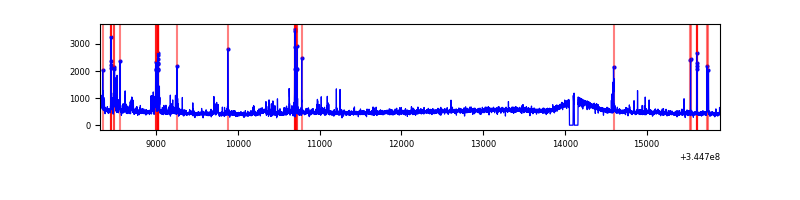 |
| D | 7588 | 7500 | 221 | 221 | 2.91% | 2.95% | 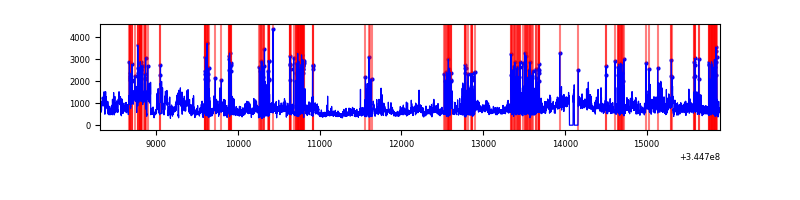 |
Top three noisy pixels from each quadrant. If the there are fewer than three noisy pixels in the level2.evt file, extra rows are filled as -1
| Pixel properties | Quadrant properties | ||||||
|---|---|---|---|---|---|---|---|
| Quadrant | DetID | PixID | Counts | Sigma | Mean | Median | Sigma |
| A | 13 | 254 | 10846 | 52.11 | 943 | 923 | 190.4 |
| A | 3 | 137 | 9699 | 46.08 | 943 | 923 | 190.4 |
| A | 0 | 226 | 7903 | 36.65 | 943 | 923 | 190.4 |
| B | 12 | 111 | 22909 | 122.21 | 931 | 908 | 180.0 |
| B | 3 | 209 | 22853 | 121.9 | 931 | 908 | 180.0 |
| B | 4 | 200 | 20893 | 111.01 | 931 | 908 | 180.0 |
| C | 3 | 233 | 381110 | 1832.84 | 888 | 894 | 207.4 |
| C | 14 | 238 | 143804 | 688.9 | 888 | 894 | 207.4 |
| C | 10 | 22 | 17951 | 82.22 | 888 | 894 | 207.4 |
| D | 8 | 195 | 2026960 | 9355.21 | 893 | 867 | 216.6 |
| D | 1 | 52 | 669344 | 3086.6 | 893 | 867 | 216.6 |
| D | 7 | 80 | 100710 | 461.01 | 893 | 867 | 216.6 |
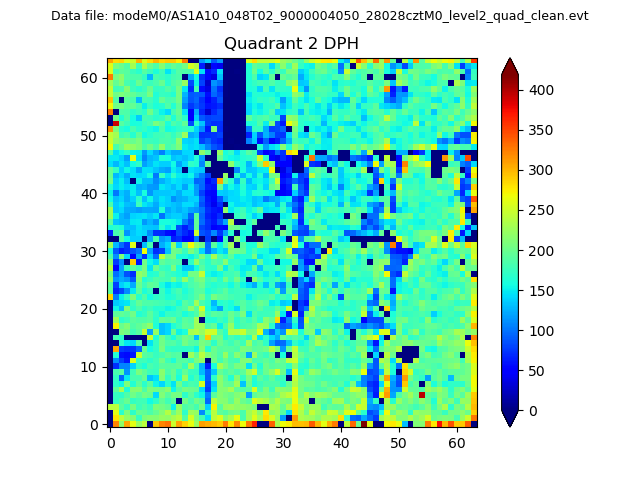
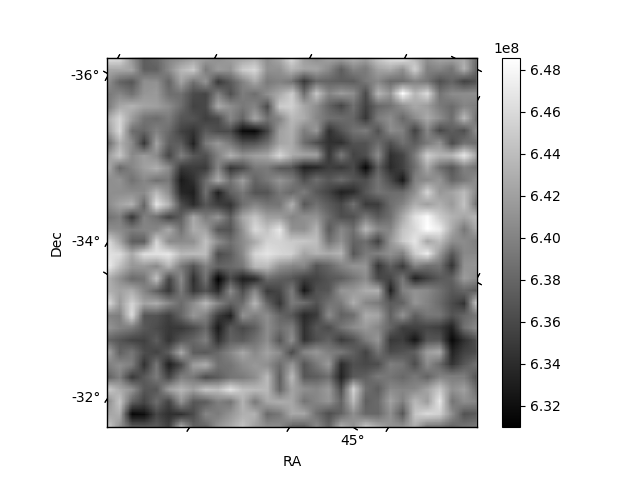
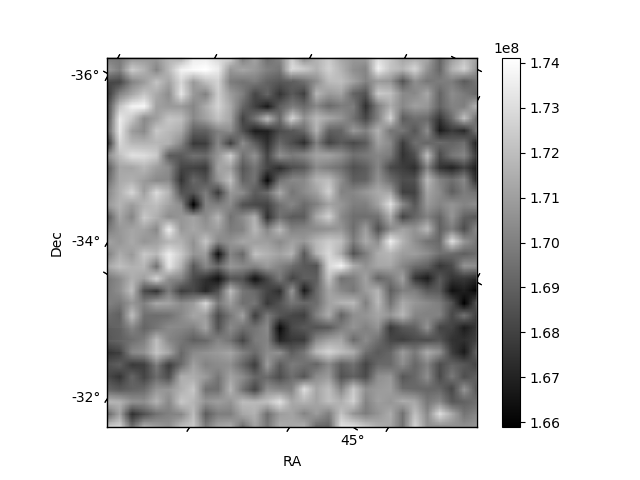
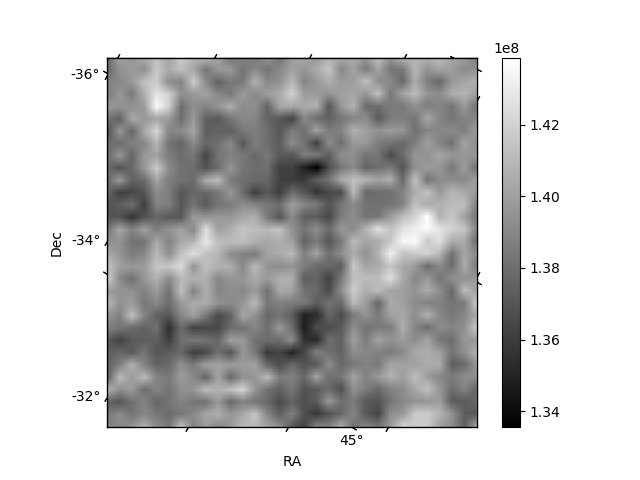
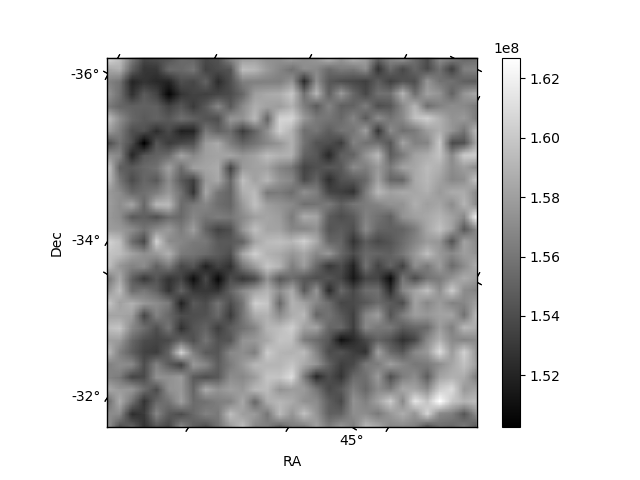
Histogram calculated using DETX and DETY for each event in the final _common_clean file
| Quadrant A | 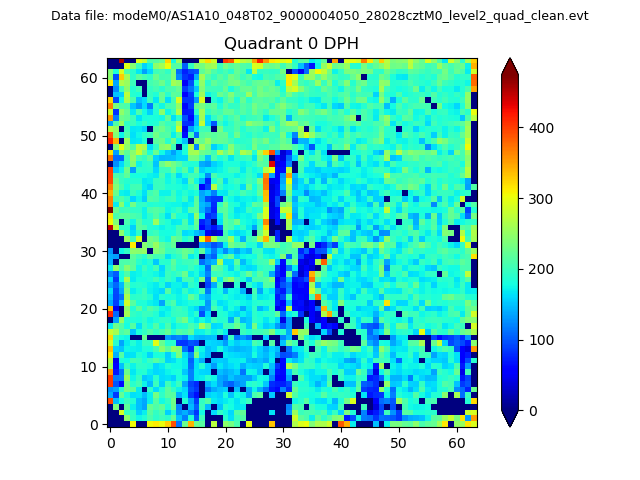 |
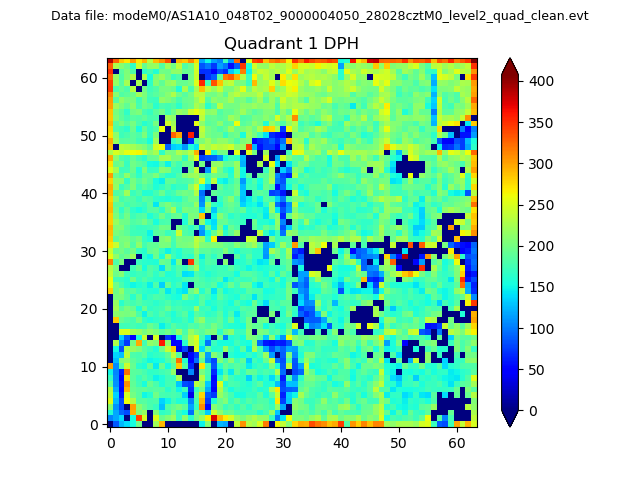 |
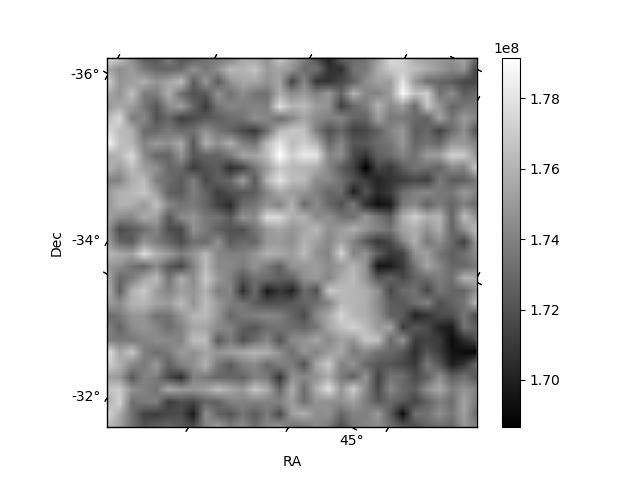
Quadrant B |
|---|---|---|---|
| Quadrant D | 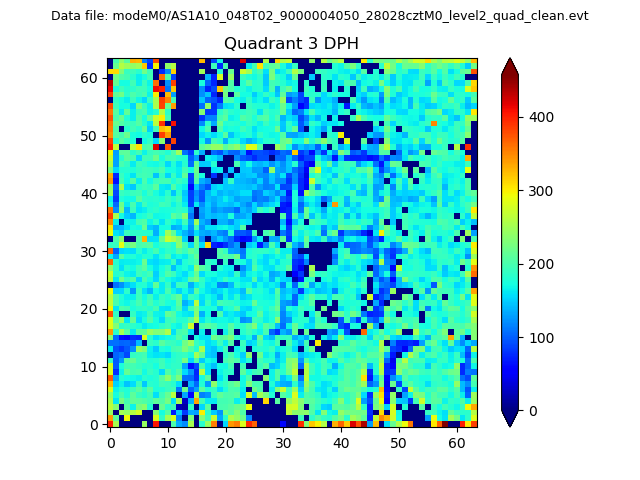 |
 |
Quadrant C |
| Plot type | Count rate plots | Images |
|---|---|---|
| Comparison with Poisson distribution Blue bars denote a histogram of data divided into 1 sec bins. Red curve is a Poisson curve with rate = median count rate of data. |
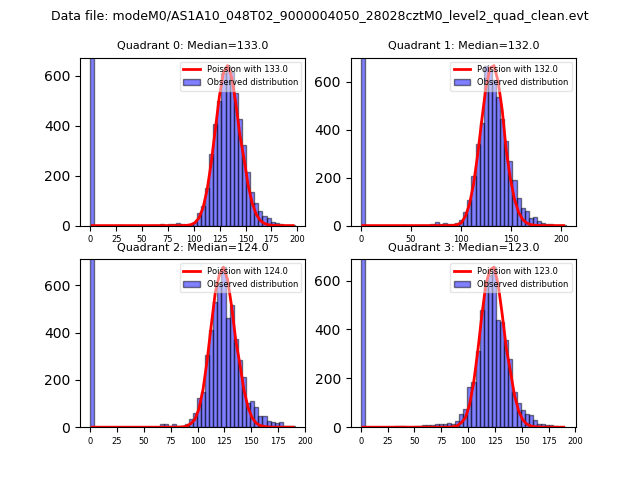 |
 |
| Quadrant-wise count rates Data is divided into 100 sec bins |
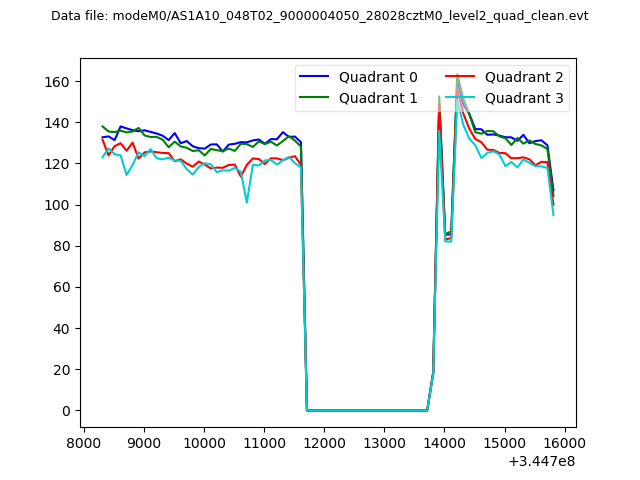 |
|
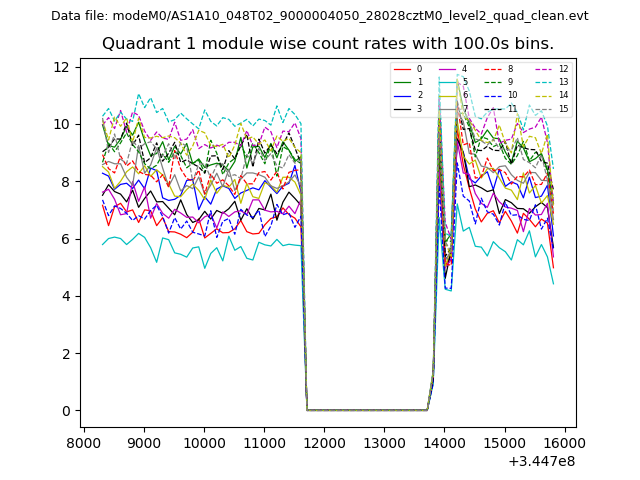
| Module-wise count rates for Quadrant A Data is divided into 100 sec bins |
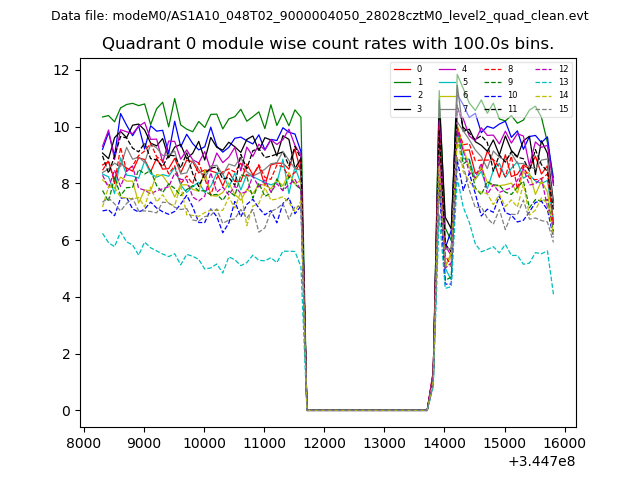 |
 |
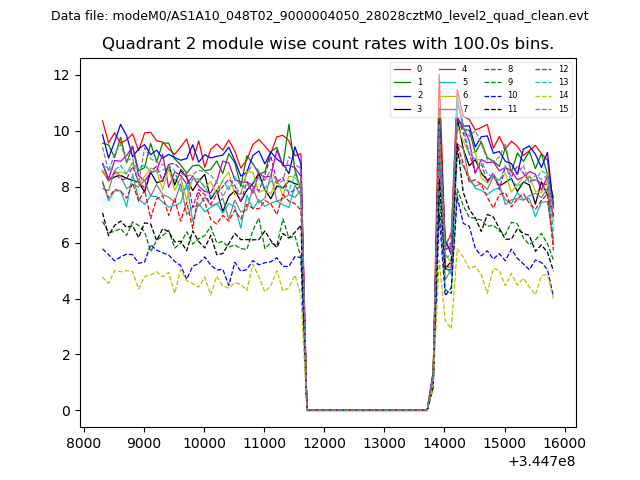
| Module-wise count rates for Quadrant B Data is divided into 100 sec bins |
 |
 |
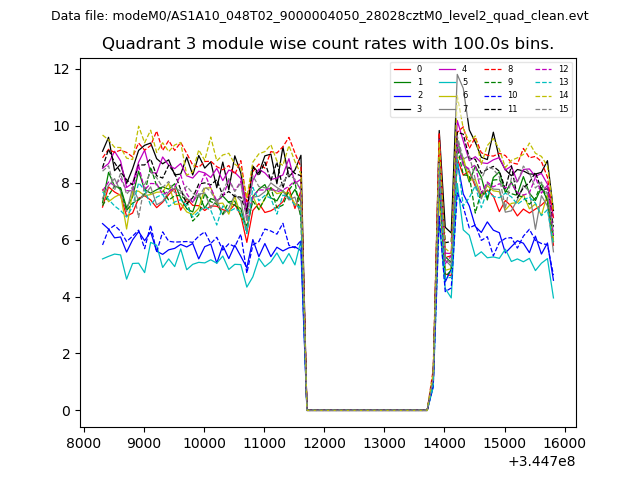
| Module-wise count rates for Quadrant C Data is divided into 100 sec bins |
 |
 |
| Module-wise count rates for Quadrant D Data is divided into 100 sec bins |
 |
 |
| Parameter | Plot |
|---|---|
| CZT HV Monitor | 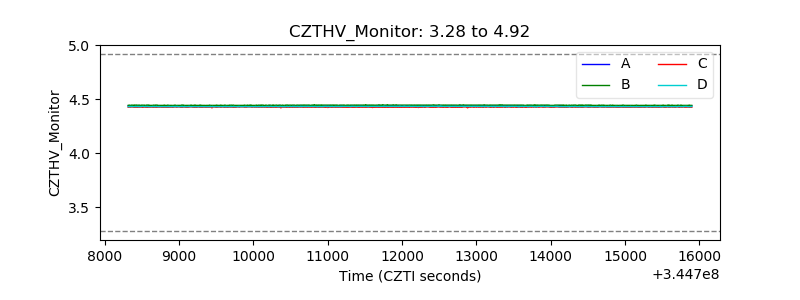 |
| D_VDD | 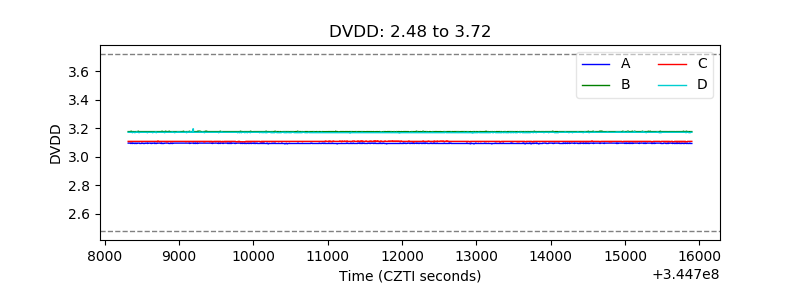 |
| Temperature 1 | 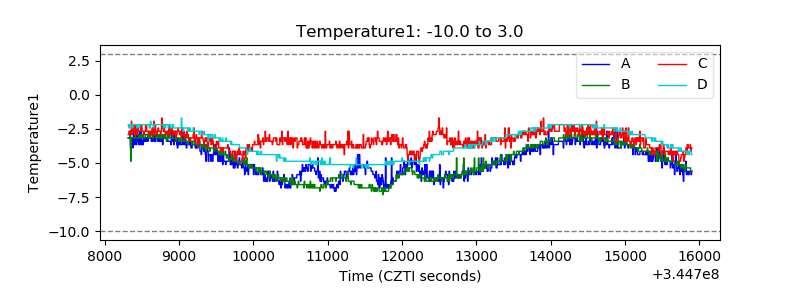 |
| Veto HV Monitor | 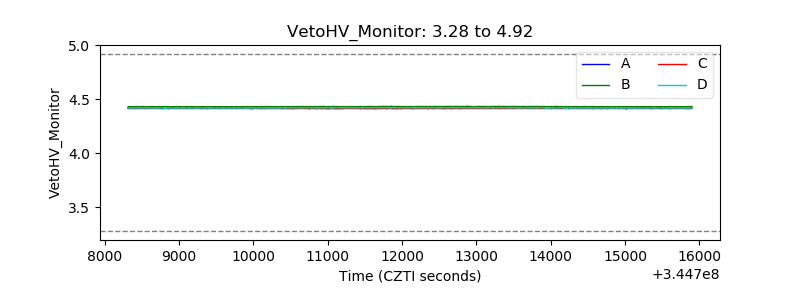 |
| Veto LLD | 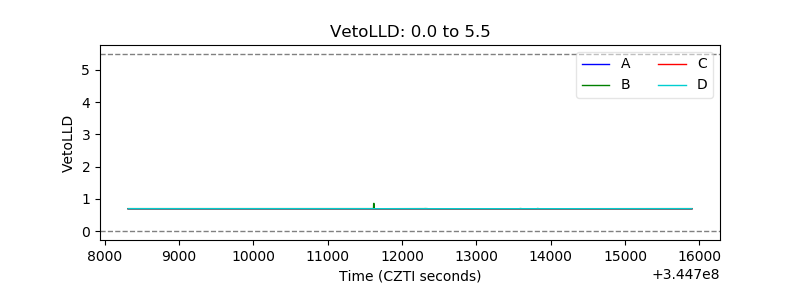 |
| Alpha Counter | 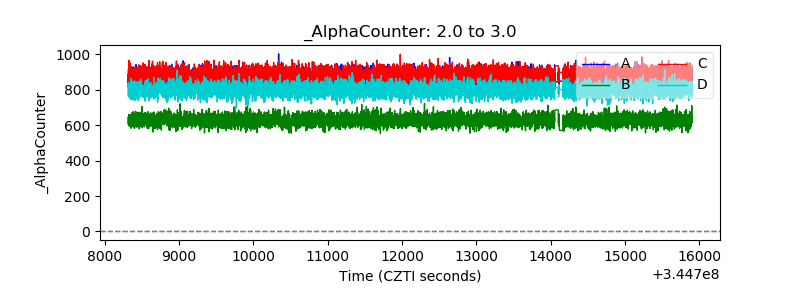 |
| _CPM_Rate | 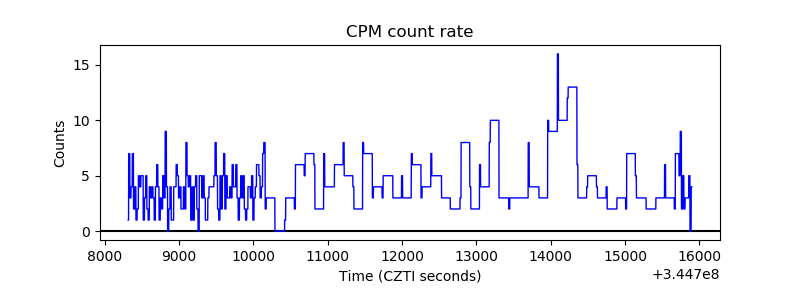 |
| CZT Counter | 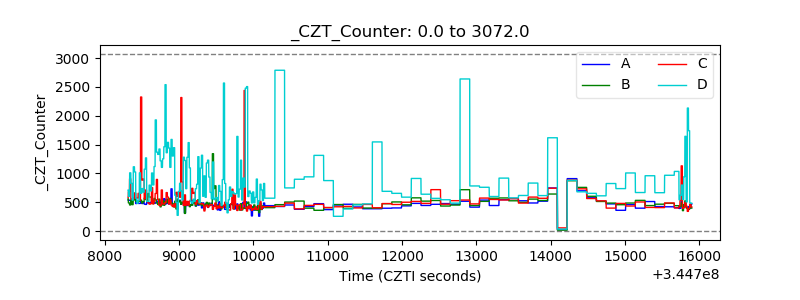 |
| +2.5 Volts monitor | 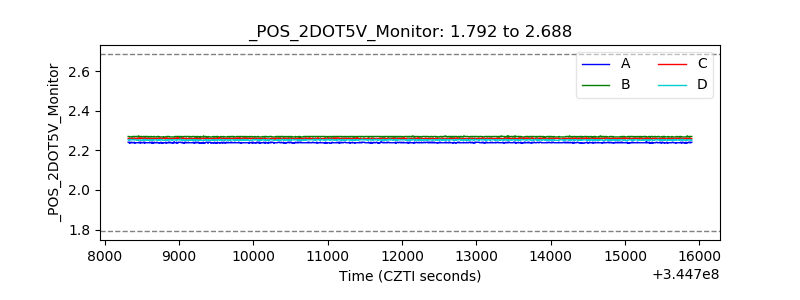 |
| +5 Volts monitor |  |
| _ROLL_ROT | 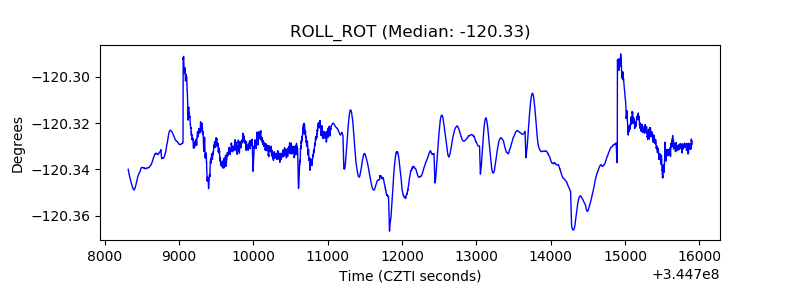 |
| _Roll_DEC | 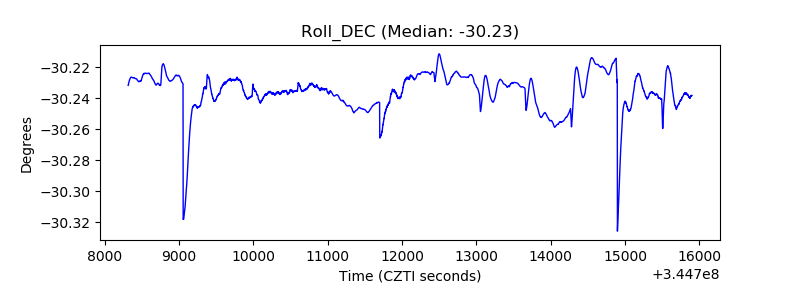 |
| _Roll_RA | 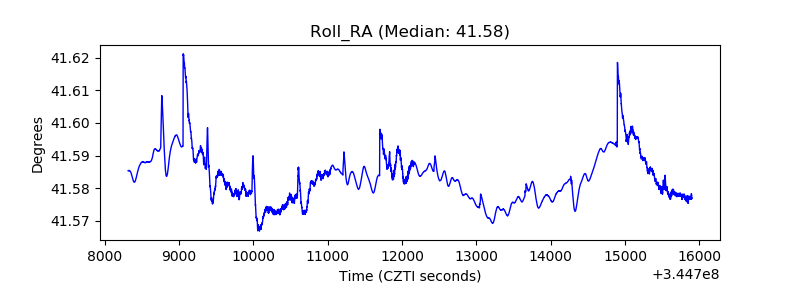 |
| Veto Counter | 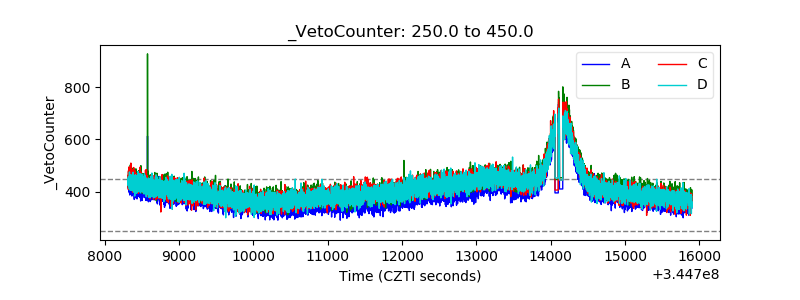 |