| Param | Original file | Final file |
|---|---|---|
| Filename | modeM0/AS1A10_048T02_9000004050_28029cztM0_level2.evt | modeM0/AS1A10_048T02_9000004050_28029cztM0_level2_quad_clean.evt |
| Size (bytes) | 582,912,000 | 102,905,280 |
| Size | 555.9 MB | 98.1 MB |
| Events in quadrant A | 3,475,026 | 680,199 |
| Events in quadrant B | 3,530,019 | 677,027 |
| Events in quadrant C | 3,876,528 | 634,937 |
| Events in quadrant D | 6,272,202 | 611,016 |
| Mode M0 | |||
|---|---|---|---|
| Quadrant | BADHDUFLAG | Total packets | Discarded packets |
| A | 0 | 15105 | 0 |
| B | 0 | 15210 | 0 |
| C | 0 | 16209 | 0 |
| D | 0 | 23851 | 0 |
| Mode M9 | |||
|---|---|---|---|
| Quadrant | BADHDUFLAG | Total packets | Discarded packets |
| A | 0 | 3 | 0 |
| B | 0 | 3 | 0 |
| C | 0 | 3 | 0 |
| D | 0 | 3 | 0 |
| Quadrant | Total seconds | Saturated seconds | Saturation percentage |
|---|---|---|---|
| A | 7372 | 33 | 0.447640% |
| B | 7372 | 41 | 0.556158% |
| C | 7372 | 135 | 1.831253% |
| D | 7373 | 325 | 4.407975% |
Noise dominated data is calculated using 1-second bins in cleaned event files. If a bin has >2000 counts, and if more than 50% of those come from <1% of pixels, then it is considered to be noise-dominated and hence unusable.
| Quadrant | # 1 sec bins | Bins with >0 counts | Bins with >2000 counts | High rate bins dominated by noise | Noise dominated (total time) | Noise dominated (detector-on time) | Marked lightcurve |
|---|---|---|---|---|---|---|---|
| A | 7692 | 7373 | 1 | 1 | 0.01% | 0.01% |  |
| B | 7692 | 7373 | 0 | 0 | 0.00% | 0.00% |  |
| C | 7692 | 7373 | 51 | 51 | 0.66% | 0.69% |  |
| D | 7693 | 7374 | 314 | 314 | 4.08% | 4.26% |  |
Top three noisy pixels from each quadrant. If the there are fewer than three noisy pixels in the level2.evt file, extra rows are filled as -1
| Pixel properties | Quadrant properties | ||||||
|---|---|---|---|---|---|---|---|
| Quadrant | DetID | PixID | Counts | Sigma | Mean | Median | Sigma |
| A | 13 | 254 | 10440 | 52.35 | 899 | 879 | 182.6 |
| A | 3 | 137 | 8959 | 44.24 | 899 | 879 | 182.6 |
| A | 0 | 226 | 7674 | 37.2 | 899 | 879 | 182.6 |
| B | 12 | 111 | 21887 | 121.16 | 889 | 867 | 173.5 |
| B | 11 | 111 | 19743 | 108.8 | 889 | 867 | 173.5 |
| B | 14 | 111 | 18513 | 101.71 | 889 | 867 | 173.5 |
| C | 3 | 233 | 417366 | 2088.23 | 846 | 853 | 199.5 |
| C | 14 | 238 | 136005 | 677.6 | 846 | 853 | 199.5 |
| C | 10 | 22 | 20758 | 99.8 | 846 | 853 | 199.5 |
| D | 8 | 195 | 1603197 | 7989.22 | 843 | 821 | 200.6 |
| D | 1 | 52 | 986591 | 4914.91 | 843 | 821 | 200.6 |
| D | 2 | 250 | 351134 | 1746.61 | 843 | 821 | 200.6 |
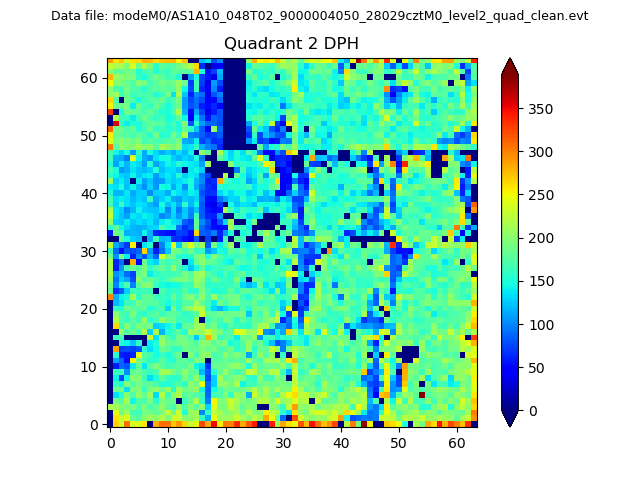
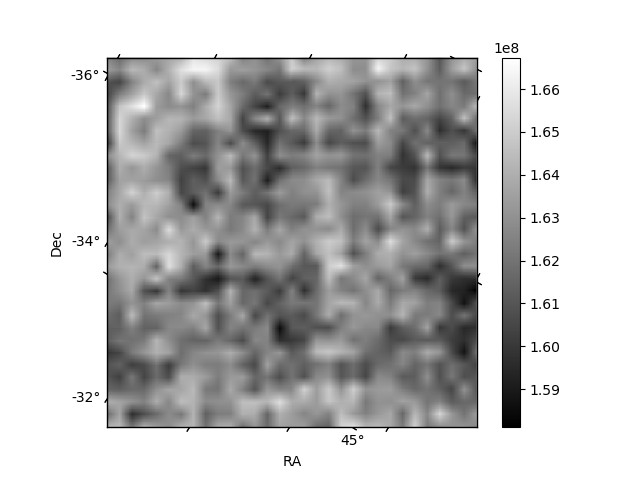
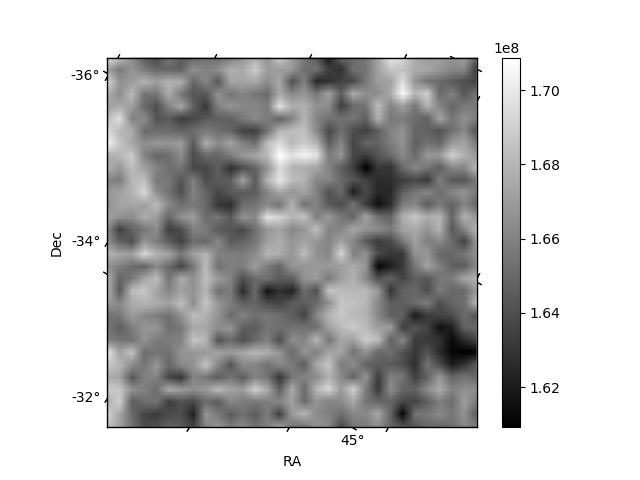
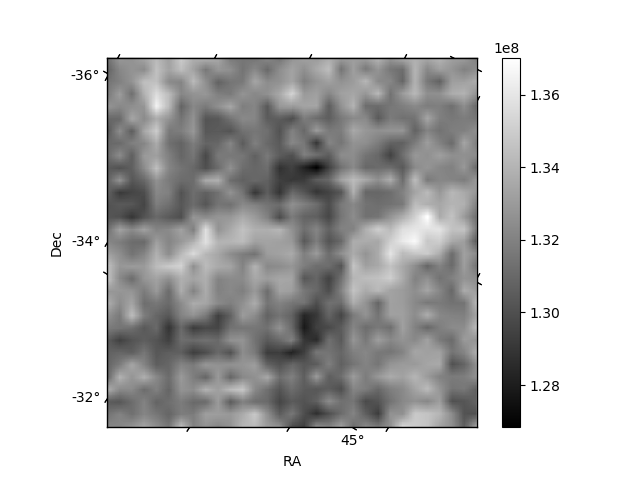
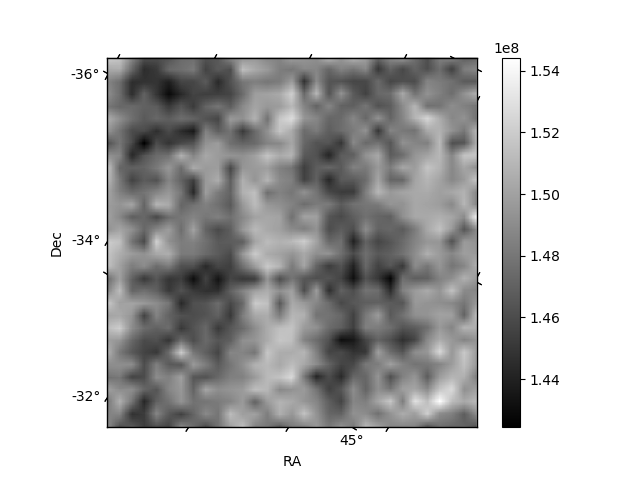
Histogram calculated using DETX and DETY for each event in the final _common_clean file
| Quadrant A | 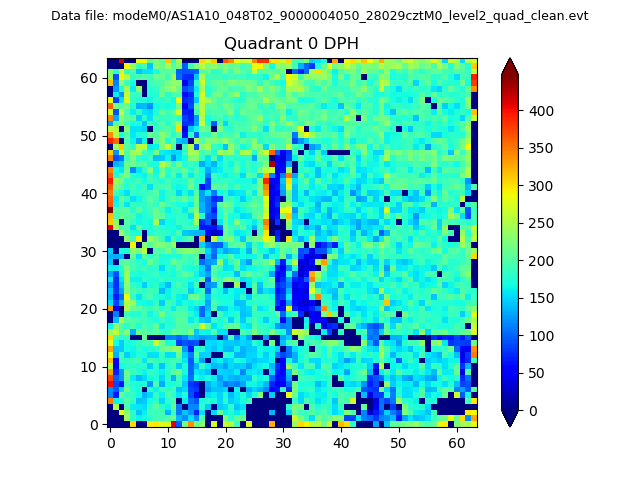 |
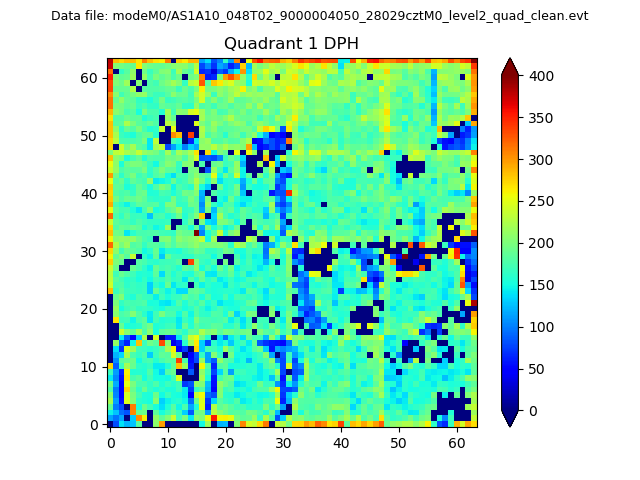 |
Quadrant B |
|---|---|---|---|
| Quadrant D | 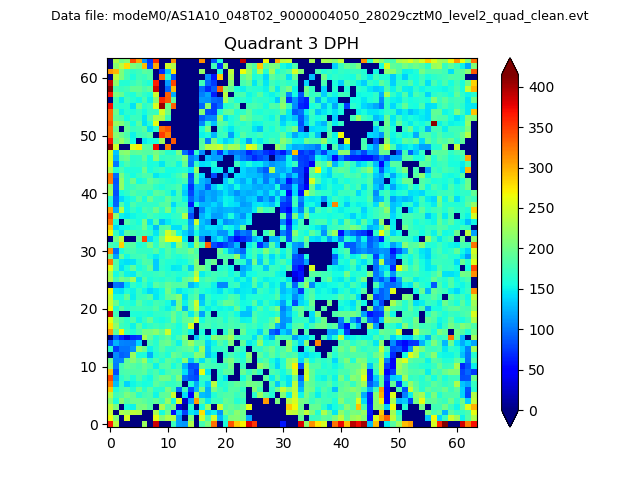 |
 |
Quadrant C |
| Plot type | Count rate plots | Images |
|---|---|---|
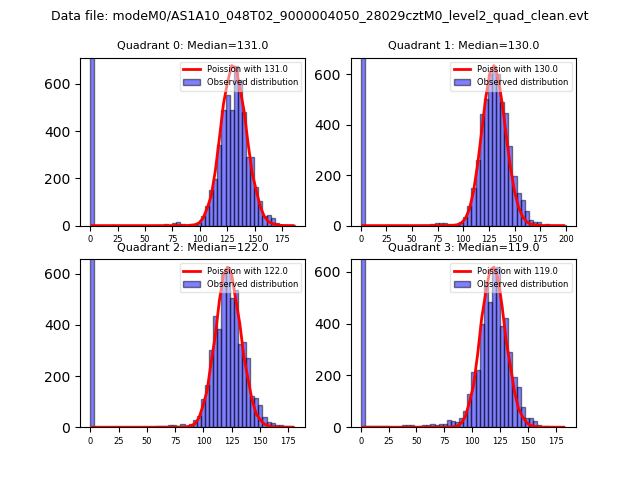
| Comparison with Poisson distribution Blue bars denote a histogram of data divided into 1 sec bins. Red curve is a Poisson curve with rate = median count rate of data. |
 |
 |
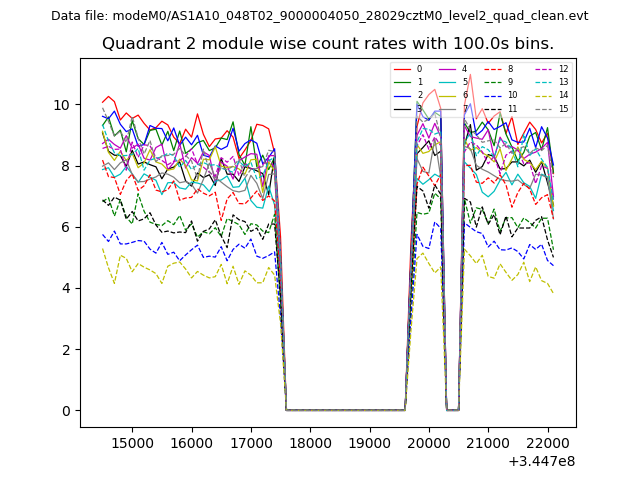
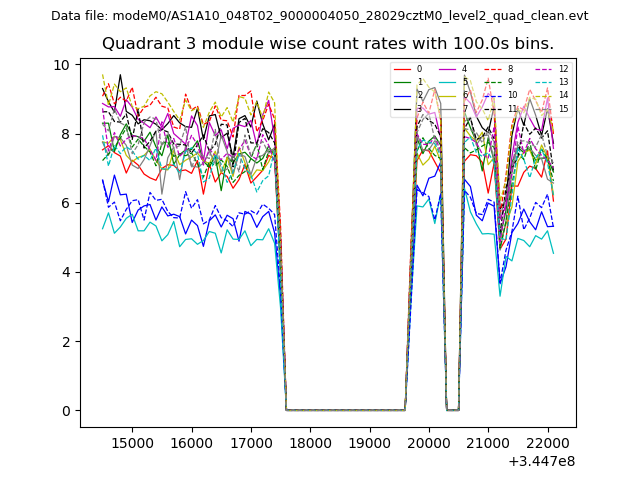
| Quadrant-wise count rates Data is divided into 100 sec bins |
 |
|
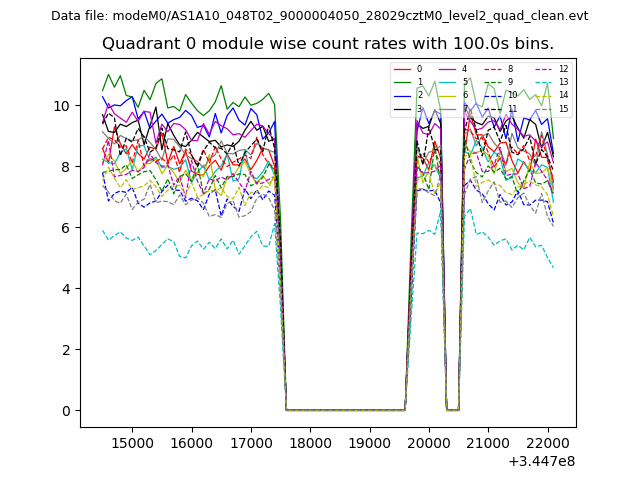
| Module-wise count rates for Quadrant A Data is divided into 100 sec bins |
 |
 |
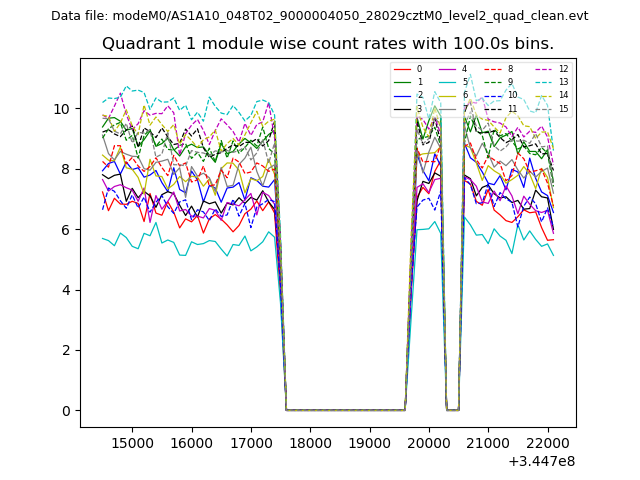
| Module-wise count rates for Quadrant B Data is divided into 100 sec bins |
 |
 |
| Module-wise count rates for Quadrant C Data is divided into 100 sec bins |
 |
 |
| Module-wise count rates for Quadrant D Data is divided into 100 sec bins |
 |
 |
| Parameter | Plot |
|---|---|
| CZT HV Monitor | 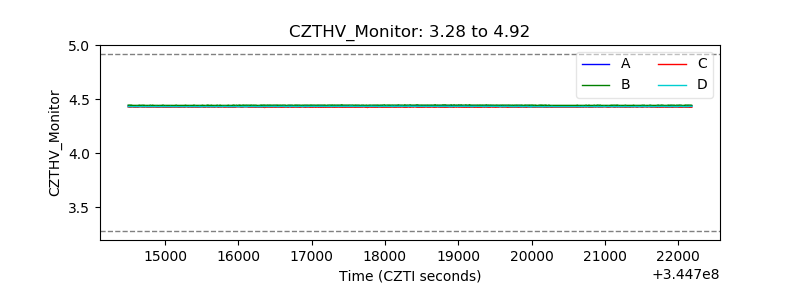 |
| D_VDD | 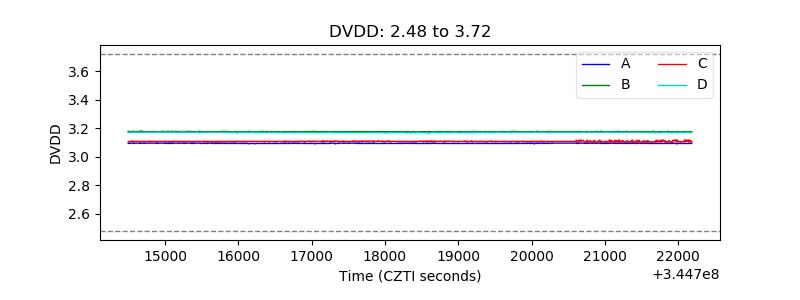 |
| Temperature 1 | 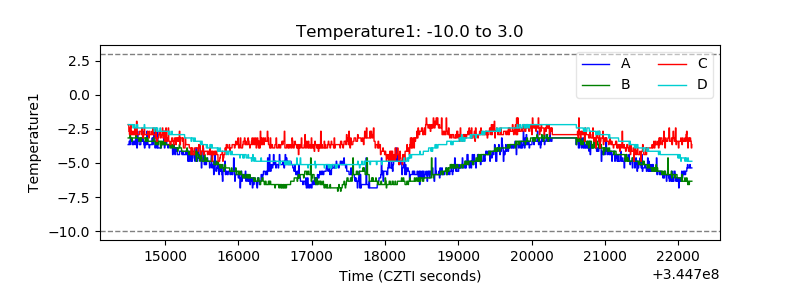 |
| Veto HV Monitor |  |
| Veto LLD | 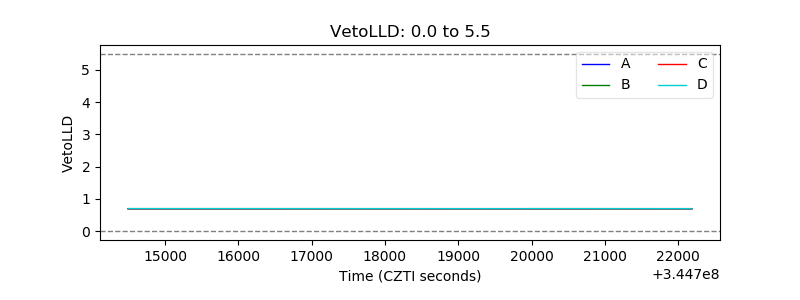 |
| Alpha Counter | 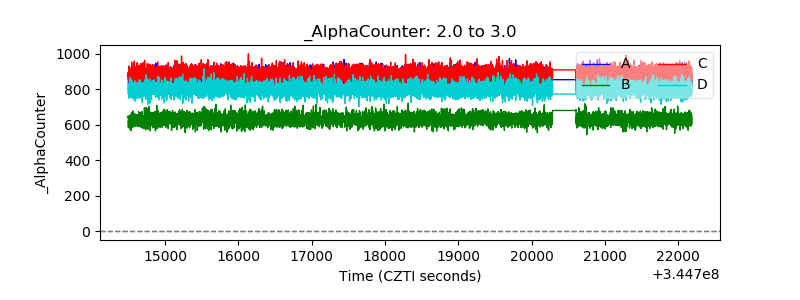 |
| _CPM_Rate | 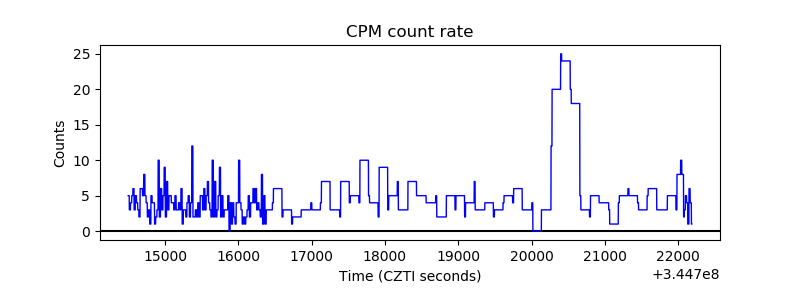 |
| CZT Counter | 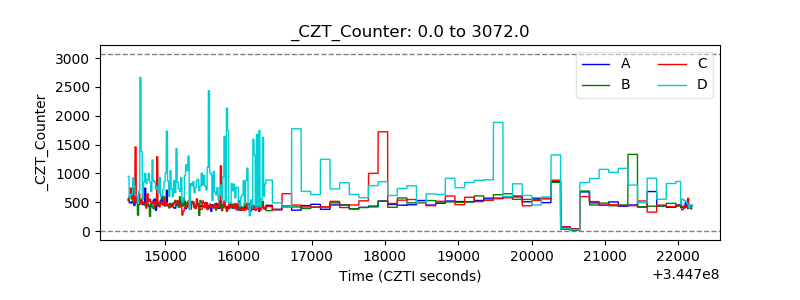 |
| +2.5 Volts monitor | 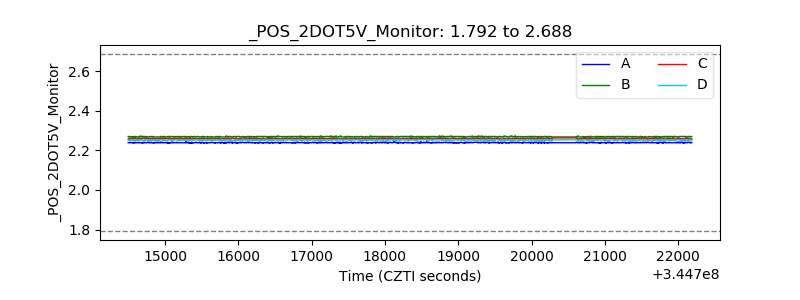 |
| +5 Volts monitor |  |
| _ROLL_ROT | 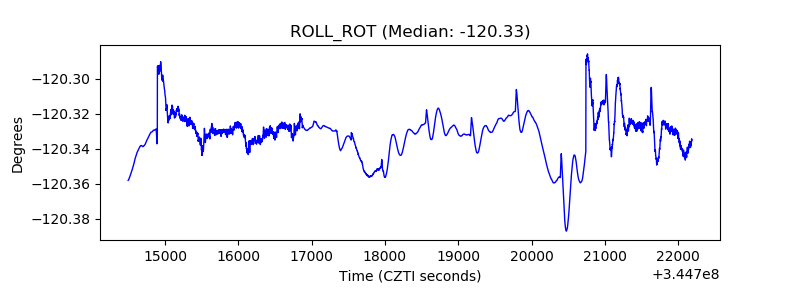 |
| _Roll_DEC | 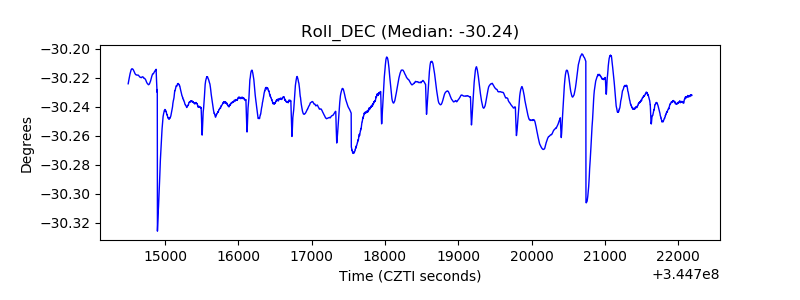 |
| _Roll_RA | 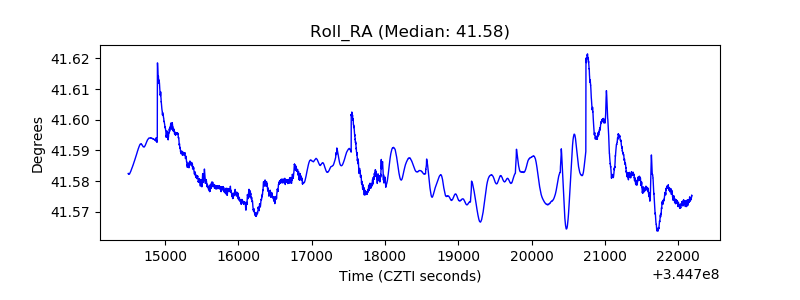 |
| Veto Counter | 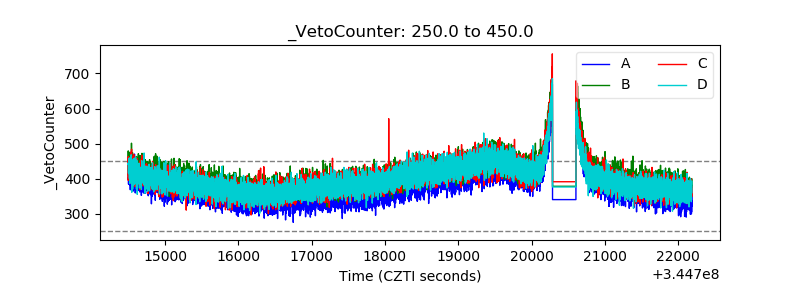 |