| Param | Original file | Final file |
|---|---|---|
| Filename | modeM0/AS1A10_048T02_9000004050_28031cztM0_level2.evt | modeM0/AS1A10_048T02_9000004050_28031cztM0_level2_quad_clean.evt |
| Size (bytes) | 1,043,677,440 | 174,358,080 |
| Size | 995.3 MB | 166.3 MB |
| Events in quadrant A | 6,111,259 | 1,139,760 |
| Events in quadrant B | 6,185,159 | 1,140,375 |
| Events in quadrant C | 6,876,358 | 1,065,424 |
| Events in quadrant D | 11,553,991 | 1,033,648 |
| Mode M0 | |||
|---|---|---|---|
| Quadrant | BADHDUFLAG | Total packets | Discarded packets |
| A | 0 | 26663 | 0 |
| B | 0 | 26708 | 0 |
| C | 0 | 28599 | 0 |
| D | 0 | 43548 | 0 |
| Mode M9 | |||
|---|---|---|---|
| Quadrant | BADHDUFLAG | Total packets | Discarded packets |
| A | 0 | 13 | 0 |
| B | 0 | 14 | 0 |
| C | 0 | 14 | 0 |
| D | 0 | 14 | 0 |
| Quadrant | Total seconds | Saturated seconds | Saturation percentage |
|---|---|---|---|
| A | 13050 | 55 | 0.421456% |
| B | 13050 | 75 | 0.574713% |
| C | 13050 | 167 | 1.279693% |
| D | 13050 | 752 | 5.762452% |
Noise dominated data is calculated using 1-second bins in cleaned event files. If a bin has >2000 counts, and if more than 50% of those come from <1% of pixels, then it is considered to be noise-dominated and hence unusable.
| Quadrant | # 1 sec bins | Bins with >0 counts | Bins with >2000 counts | High rate bins dominated by noise | Noise dominated (total time) | Noise dominated (detector-on time) | Marked lightcurve |
|---|---|---|---|---|---|---|---|
| A | 14225 | 13052 | 2 | 2 | 0.01% | 0.02% | 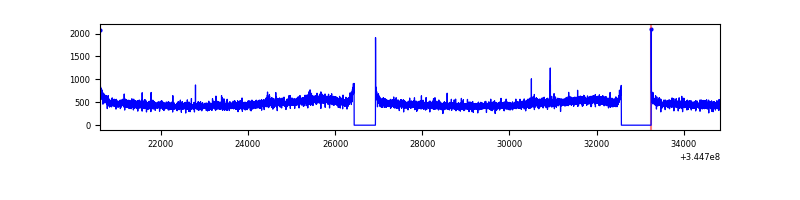 |
| B | 14225 | 13052 | 0 | 0 | 0.00% | 0.00% | 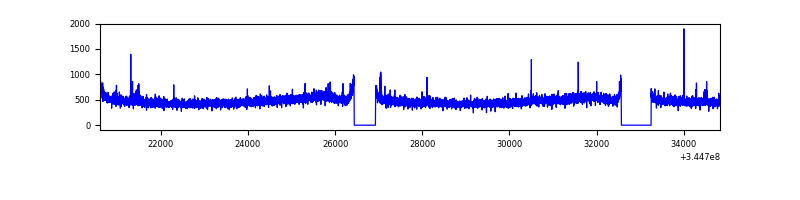 |
| C | 14225 | 13052 | 48 | 48 | 0.34% | 0.37% | 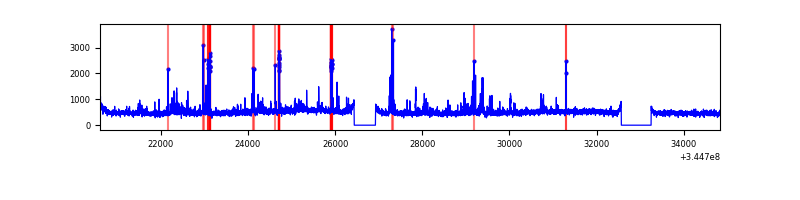 |
| D | 14225 | 13051 | 682 | 682 | 4.79% | 5.23% | 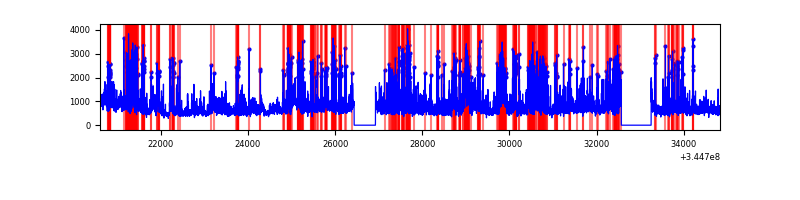 |
Top three noisy pixels from each quadrant. If the there are fewer than three noisy pixels in the level2.evt file, extra rows are filled as -1
| Pixel properties | Quadrant properties | ||||||
|---|---|---|---|---|---|---|---|
| Quadrant | DetID | PixID | Counts | Sigma | Mean | Median | Sigma |
| A | 13 | 254 | 20257 | 59.13 | 1577 | 1544 | 316.5 |
| A | 8 | 192 | 16302 | 46.64 | 1577 | 1544 | 316.5 |
| A | 3 | 137 | 15954 | 45.54 | 1577 | 1544 | 316.5 |
| B | 12 | 111 | 38702 | 122.76 | 1565 | 1522 | 302.9 |
| B | 11 | 111 | 34991 | 110.5 | 1565 | 1522 | 302.9 |
| B | 14 | 111 | 33210 | 104.62 | 1565 | 1522 | 302.9 |
| C | 3 | 233 | 711745 | 2016.54 | 1498 | 1508 | 352.2 |
| C | 14 | 238 | 238264 | 672.21 | 1498 | 1508 | 352.2 |
| C | 10 | 22 | 58178 | 160.9 | 1498 | 1508 | 352.2 |
| D | 8 | 195 | 2101764 | 5941.39 | 1487 | 1448 | 353.5 |
| D | 1 | 52 | 1890169 | 5342.83 | 1487 | 1448 | 353.5 |
| D | 7 | 80 | 1644211 | 4647.06 | 1487 | 1448 | 353.5 |
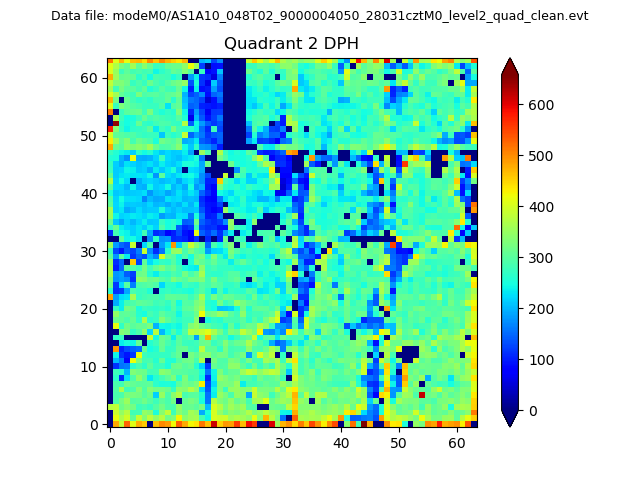
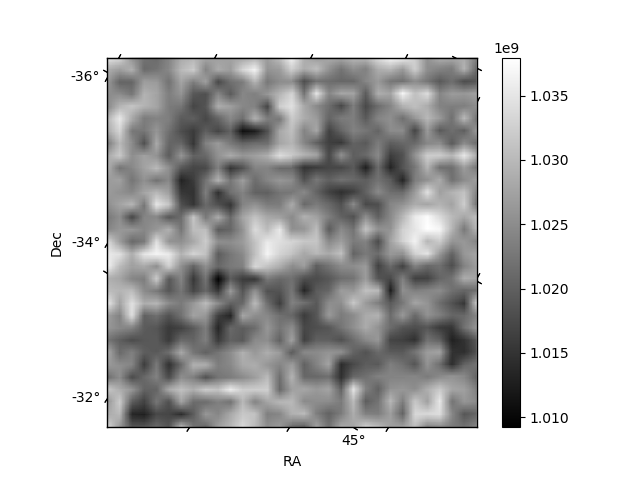
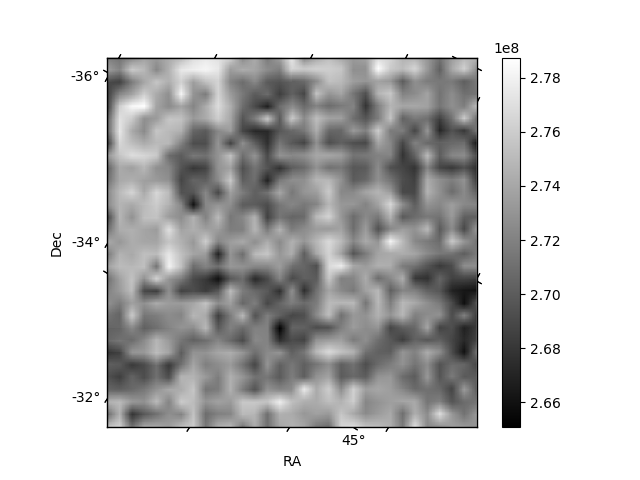
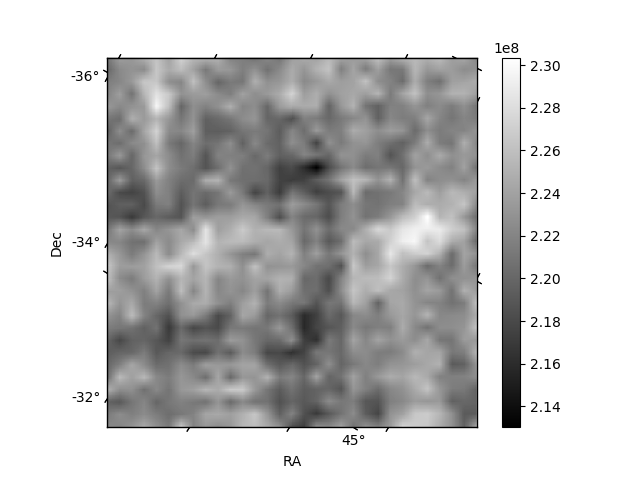
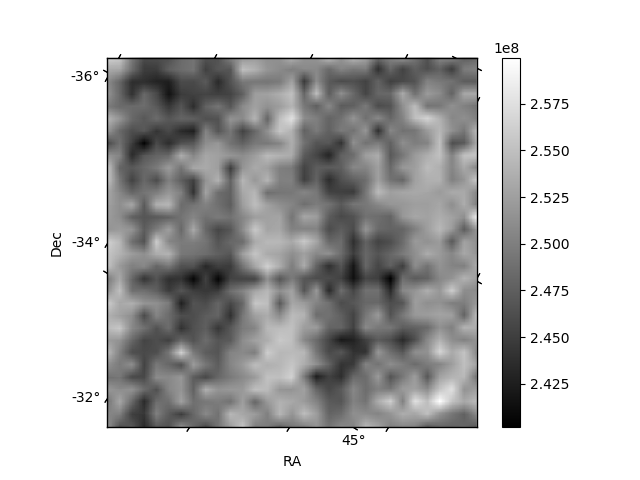
Histogram calculated using DETX and DETY for each event in the final _common_clean file
| Quadrant A | 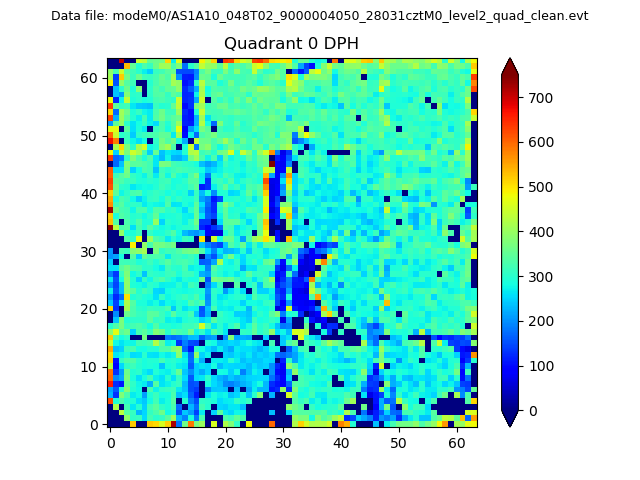 |
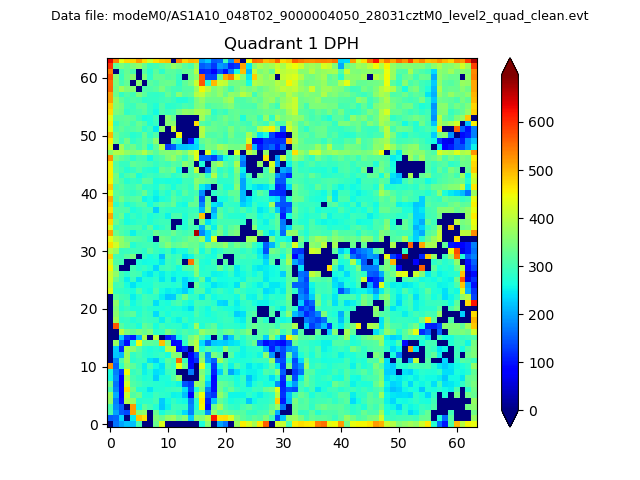 |
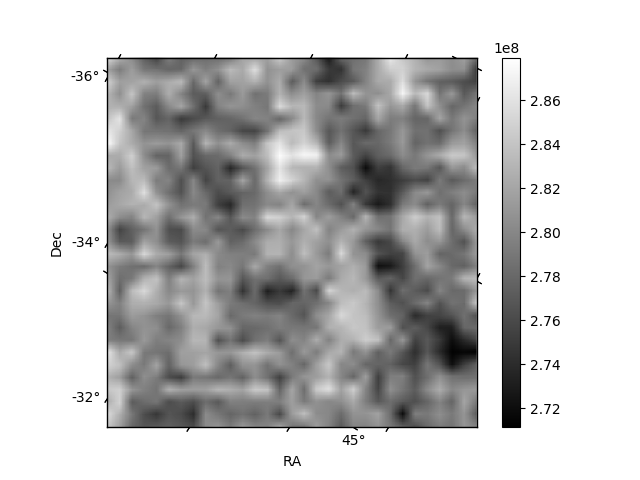
Quadrant B |
|---|---|---|---|
| Quadrant D | 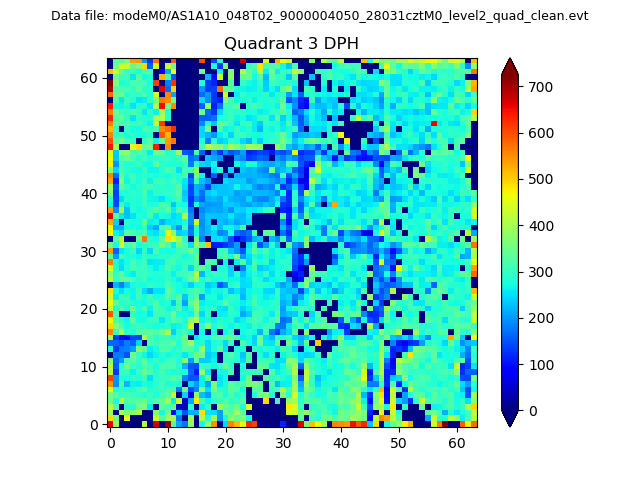 |
 |
Quadrant C |
| Plot type | Count rate plots | Images |
|---|---|---|
| Comparison with Poisson distribution Blue bars denote a histogram of data divided into 1 sec bins. Red curve is a Poisson curve with rate = median count rate of data. |
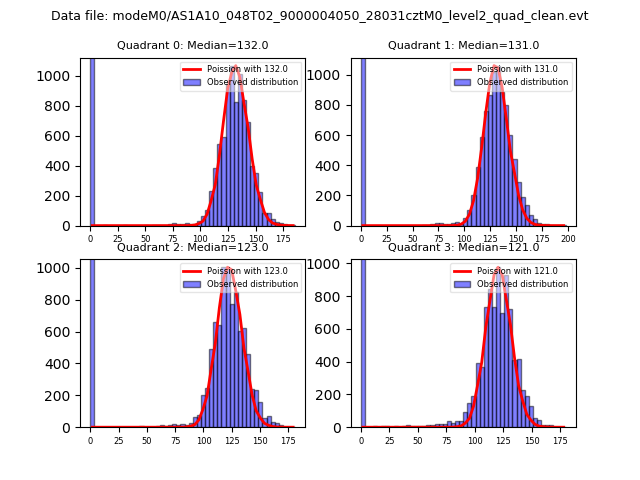 |
 |
| Quadrant-wise count rates Data is divided into 100 sec bins |
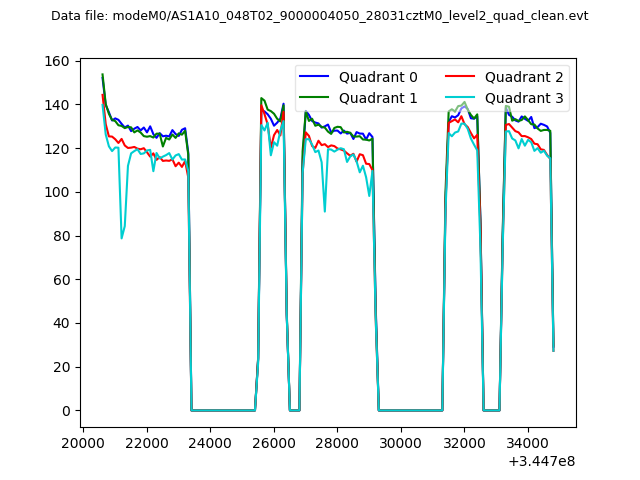 |
|
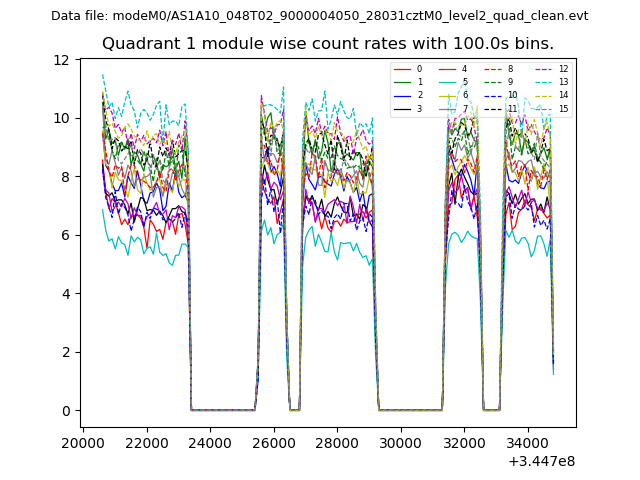
| Module-wise count rates for Quadrant A Data is divided into 100 sec bins |
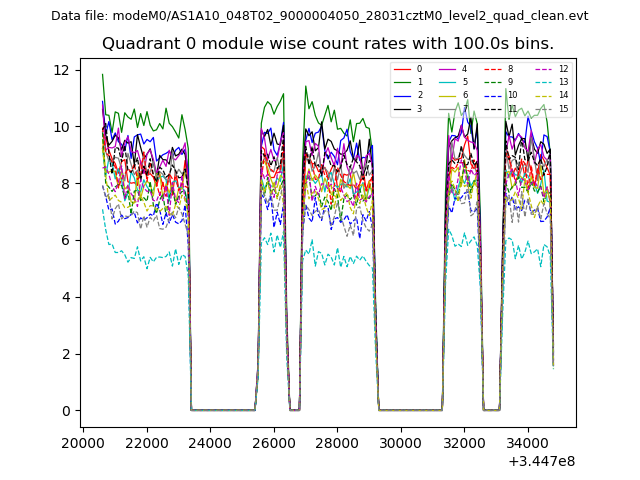 |
 |
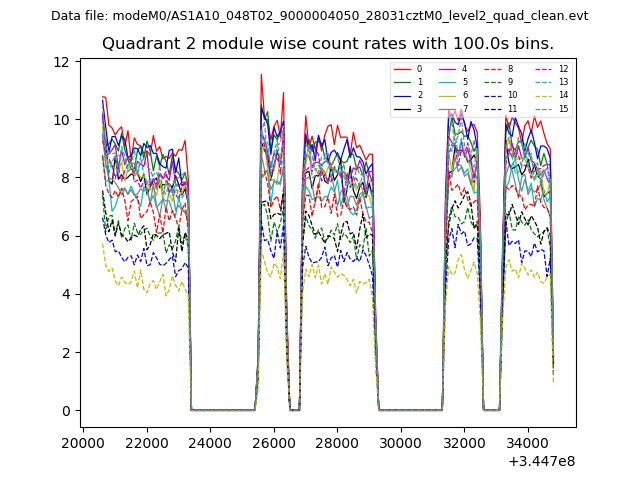
| Module-wise count rates for Quadrant B Data is divided into 100 sec bins |
 |
 |
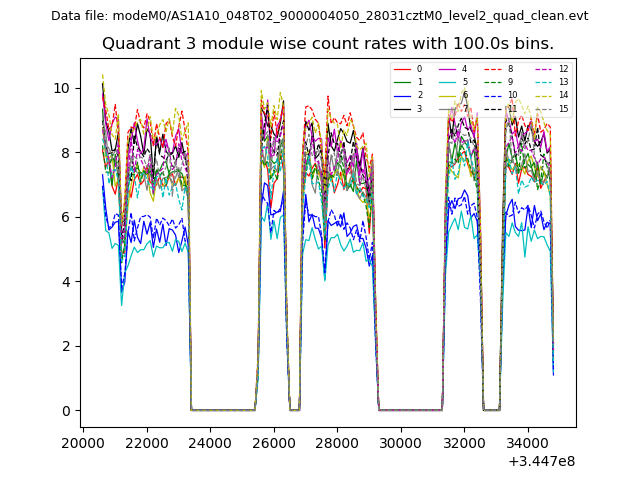
| Module-wise count rates for Quadrant C Data is divided into 100 sec bins |
 |
 |
| Module-wise count rates for Quadrant D Data is divided into 100 sec bins |
 |
 |
| Parameter | Plot |
|---|---|
| CZT HV Monitor | 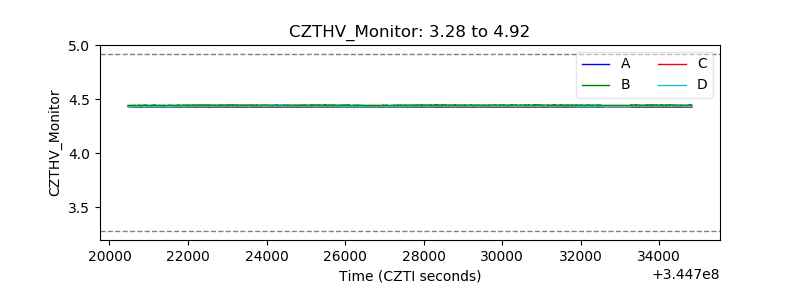 |
| D_VDD | 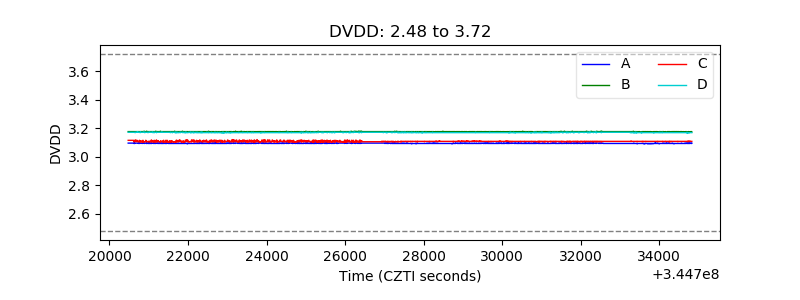 |
| Temperature 1 | 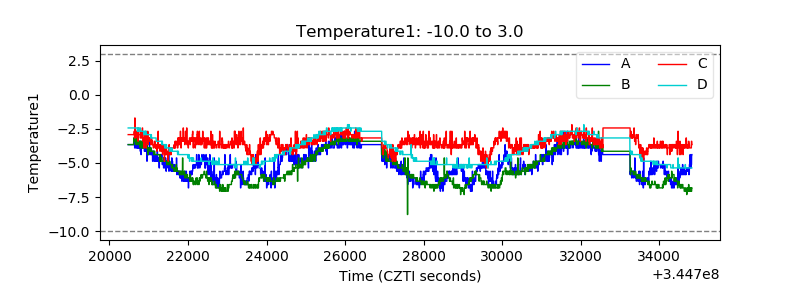 |
| Veto HV Monitor | 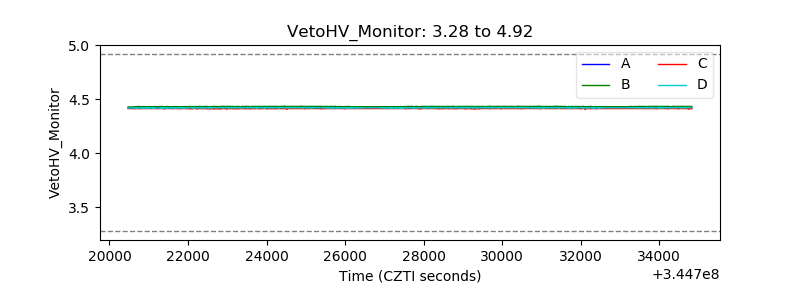 |
| Veto LLD | 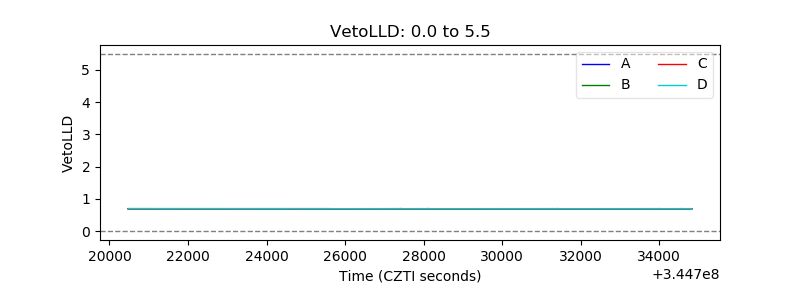 |
| Alpha Counter | 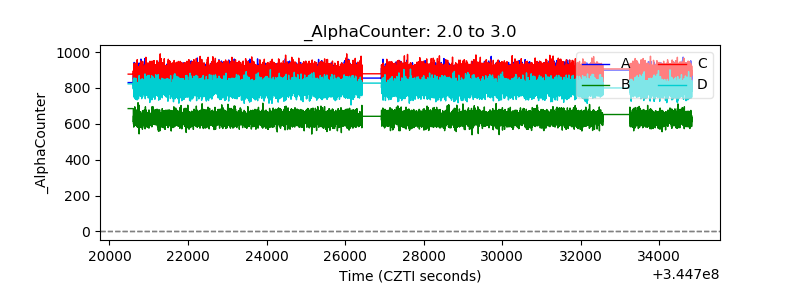 |
| _CPM_Rate | 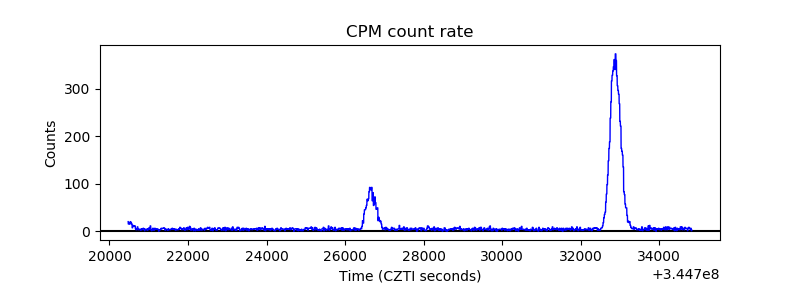 |
| CZT Counter | 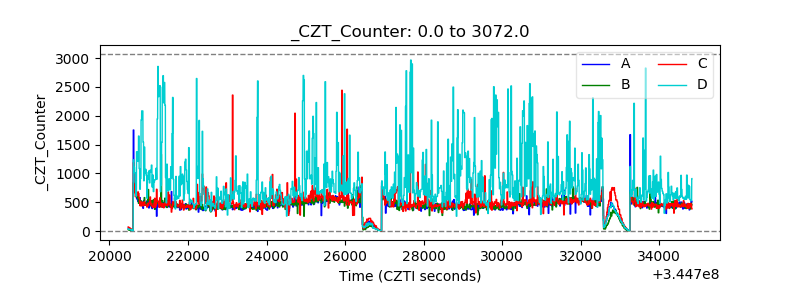 |
| +2.5 Volts monitor |  |
| +5 Volts monitor |  |
| _ROLL_ROT | 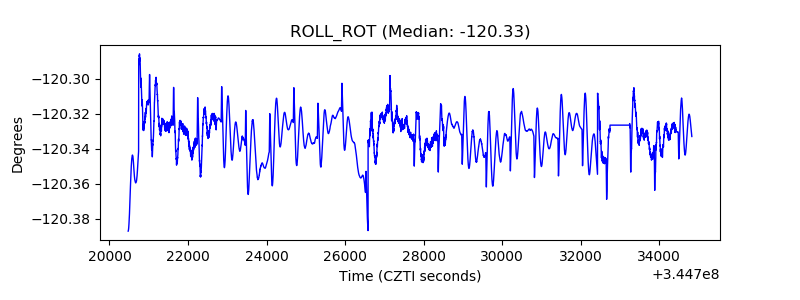 |
| _Roll_DEC |  |
| _Roll_RA | 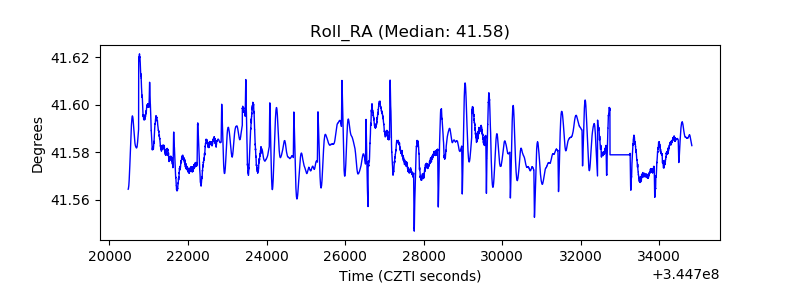 |
| Veto Counter | 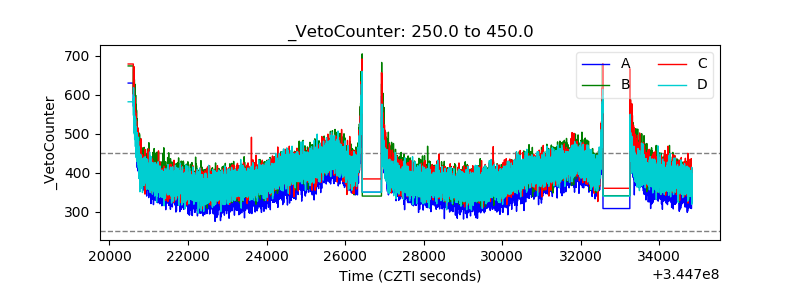 |