| Param | Original file | Final file |
|---|---|---|
| Filename | modeM0/AS1A10_048T02_9000004050_28032cztM0_level2.evt | modeM0/AS1A10_048T02_9000004050_28032cztM0_level2_quad_clean.evt |
| Size (bytes) | 564,865,920 | 105,068,160 |
| Size | 538.7 MB | 100.2 MB |
| Events in quadrant A | 3,497,913 | 688,617 |
| Events in quadrant B | 3,564,328 | 693,036 |
| Events in quadrant C | 3,576,771 | 651,969 |
| Events in quadrant D | 5,966,281 | 633,202 |
| Mode M0 | |||
|---|---|---|---|
| Quadrant | BADHDUFLAG | Total packets | Discarded packets |
| A | 0 | 15009 | 0 |
| B | 0 | 15124 | 0 |
| C | 0 | 15115 | 0 |
| D | 0 | 22955 | 0 |
| Mode M9 | |||
|---|---|---|---|
| Quadrant | BADHDUFLAG | Total packets | Discarded packets |
| A | 0 | 15 | 0 |
| B | 0 | 15 | 0 |
| C | 0 | 15 | 0 |
| D | 0 | 15 | 0 |
| Quadrant | Total seconds | Saturated seconds | Saturation percentage |
|---|---|---|---|
| A | 7400 | 32 | 0.432432% |
| B | 7401 | 50 | 0.675584% |
| C | 7401 | 83 | 1.121470% |
| D | 7401 | 304 | 4.107553% |
Noise dominated data is calculated using 1-second bins in cleaned event files. If a bin has >2000 counts, and if more than 50% of those come from <1% of pixels, then it is considered to be noise-dominated and hence unusable.
| Quadrant | # 1 sec bins | Bins with >0 counts | Bins with >2000 counts | High rate bins dominated by noise | Noise dominated (total time) | Noise dominated (detector-on time) | Marked lightcurve |
|---|---|---|---|---|---|---|---|
| A | 8945 | 7402 | 2 | 2 | 0.02% | 0.03% | 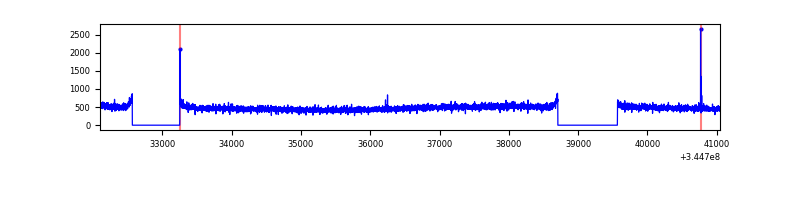 |
| B | 8946 | 7402 | 0 | 0 | 0.00% | 0.00% | 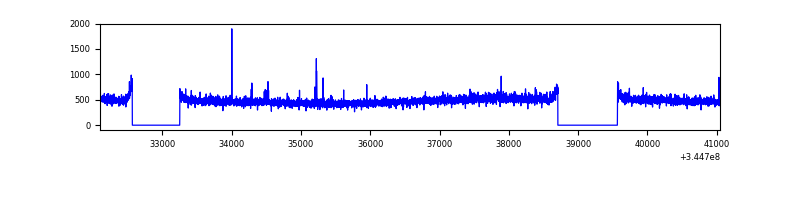 |
| C | 8946 | 7402 | 0 | 0 | 0.00% | 0.00% | 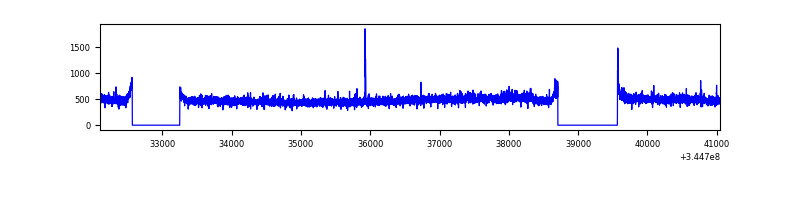 |
| D | 8946 | 7401 | 248 | 248 | 2.77% | 3.35% | 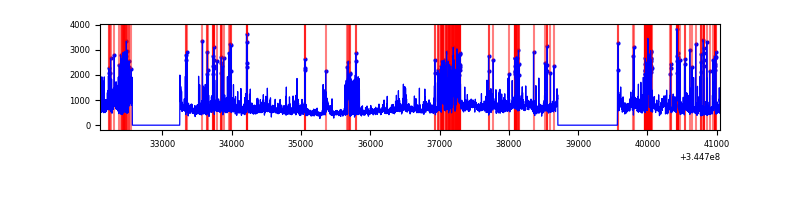 |
Top three noisy pixels from each quadrant. If the there are fewer than three noisy pixels in the level2.evt file, extra rows are filled as -1
| Pixel properties | Quadrant properties | ||||||
|---|---|---|---|---|---|---|---|
| Quadrant | DetID | PixID | Counts | Sigma | Mean | Median | Sigma |
| A | 13 | 254 | 11364 | 57.66 | 902 | 882 | 181.8 |
| A | 3 | 137 | 9042 | 44.88 | 902 | 882 | 181.8 |
| A | 0 | 13 | 8121 | 39.82 | 902 | 882 | 181.8 |
| B | 10 | 245 | 32558 | 183.55 | 896 | 874 | 172.6 |
| B | 12 | 111 | 21829 | 121.4 | 896 | 874 | 172.6 |
| B | 11 | 111 | 20077 | 111.25 | 896 | 874 | 172.6 |
| C | 14 | 238 | 138836 | 679.37 | 863 | 867 | 203.1 |
| C | 3 | 233 | 73365 | 356.98 | 863 | 867 | 203.1 |
| C | 13 | 61 | 5940 | 24.98 | 863 | 867 | 203.1 |
| D | 8 | 195 | 1334887 | 6501.49 | 860 | 836 | 205.2 |
| D | 1 | 52 | 1053149 | 5128.44 | 860 | 836 | 205.2 |
| D | 7 | 80 | 313541 | 1523.97 | 860 | 836 | 205.2 |
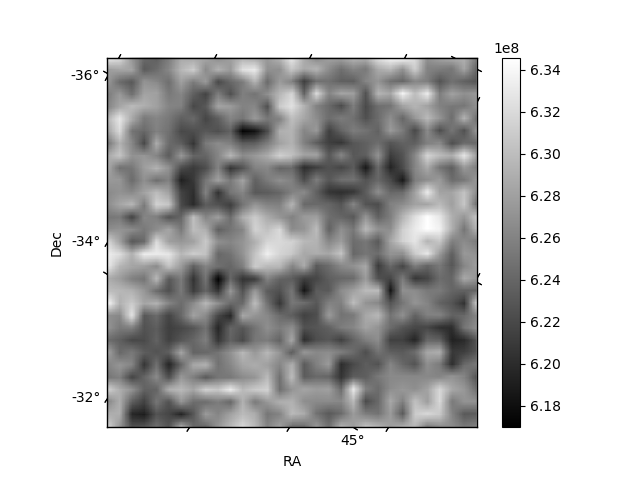
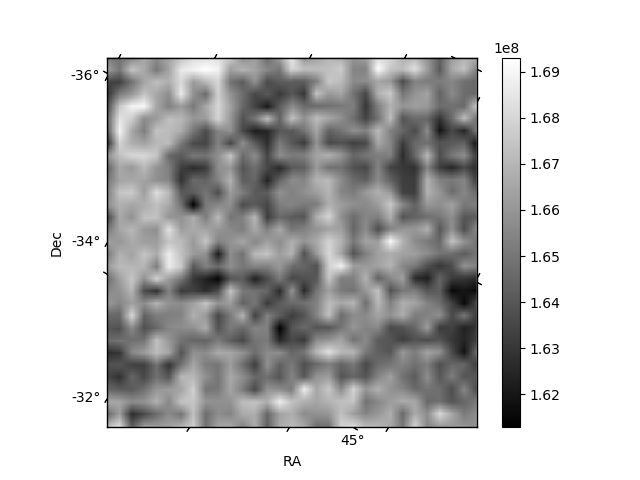
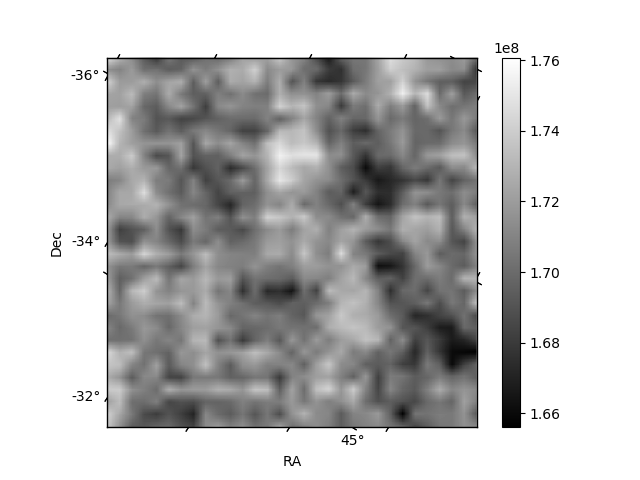
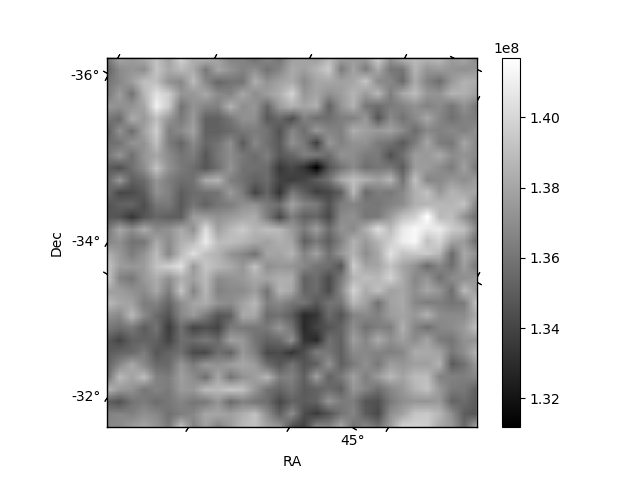
Histogram calculated using DETX and DETY for each event in the final _common_clean file
| Quadrant A | 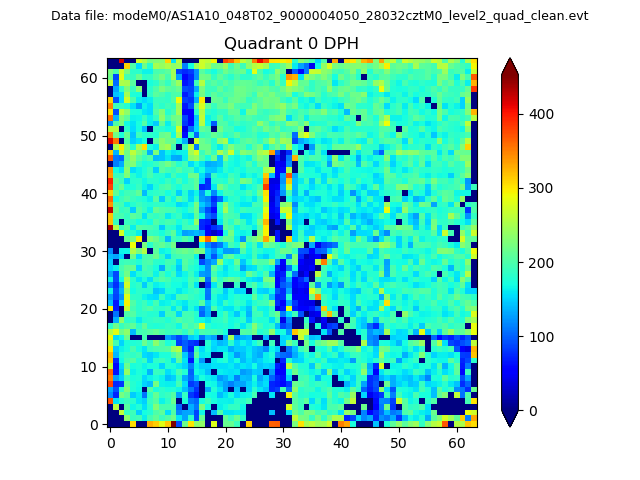 |
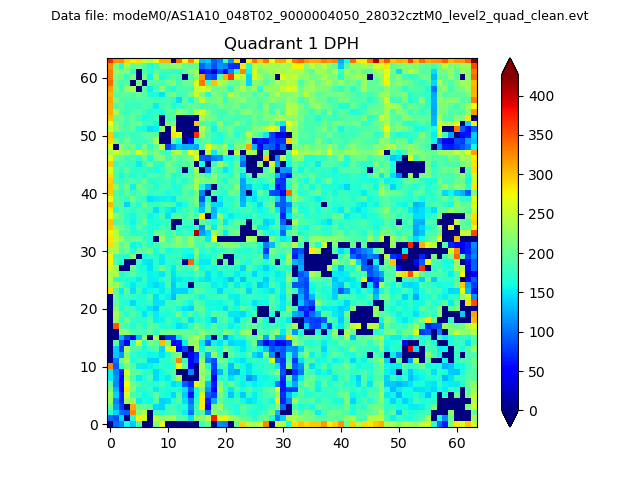 |
Quadrant B |
|---|---|---|---|
| Quadrant D |  |
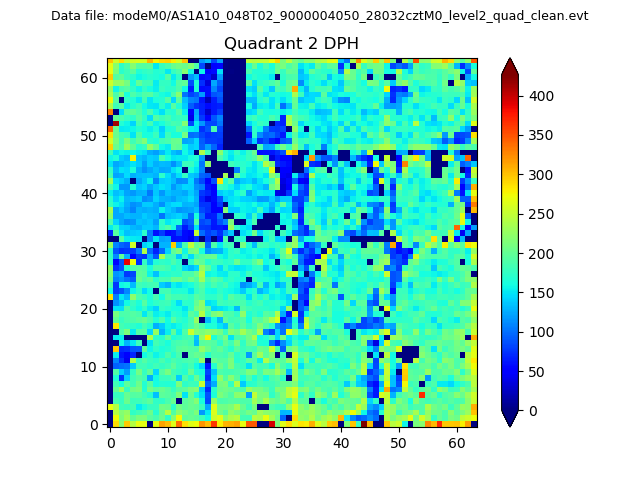 |
Quadrant C |
| Plot type | Count rate plots | Images |
|---|---|---|
| Comparison with Poisson distribution Blue bars denote a histogram of data divided into 1 sec bins. Red curve is a Poisson curve with rate = median count rate of data. |
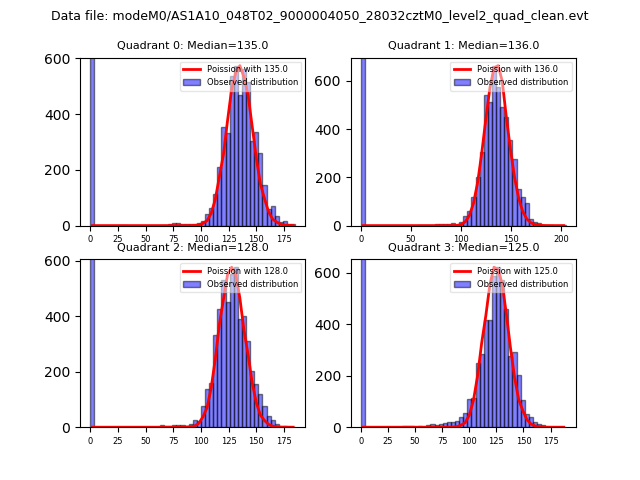 |
 |
| Quadrant-wise count rates Data is divided into 100 sec bins |
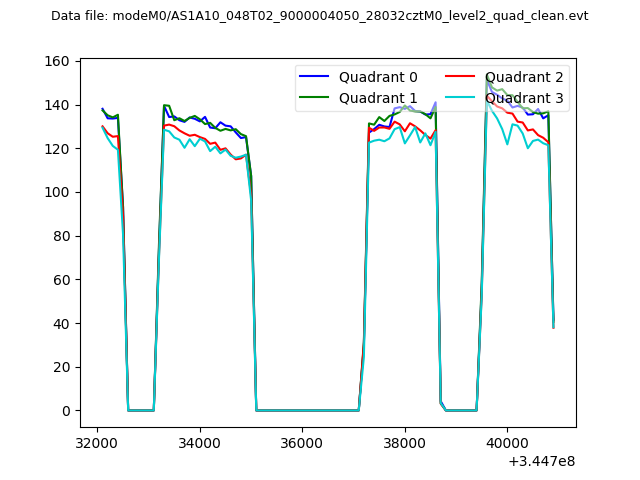 |
|
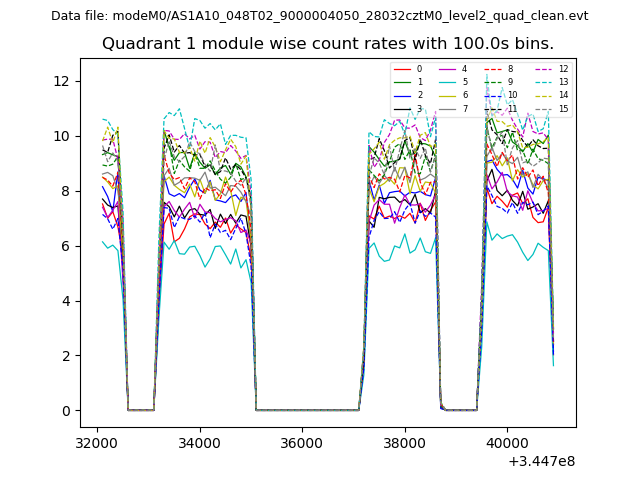
| Module-wise count rates for Quadrant A Data is divided into 100 sec bins |
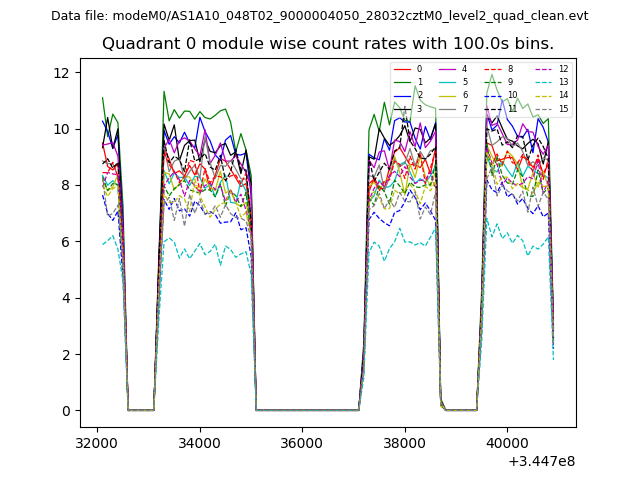 |
 |
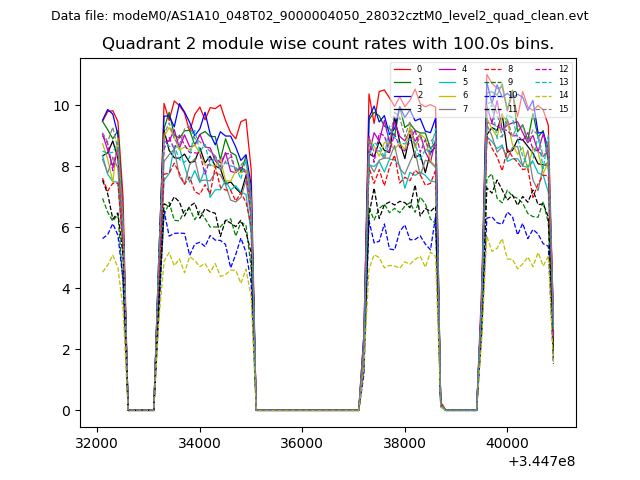
| Module-wise count rates for Quadrant B Data is divided into 100 sec bins |
 |
 |
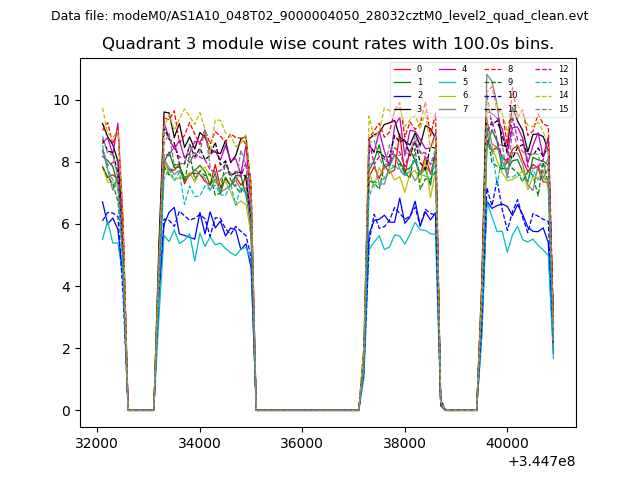
| Module-wise count rates for Quadrant C Data is divided into 100 sec bins |
 |
 |
| Module-wise count rates for Quadrant D Data is divided into 100 sec bins |
 |
 |
| Parameter | Plot |
|---|---|
| CZT HV Monitor | 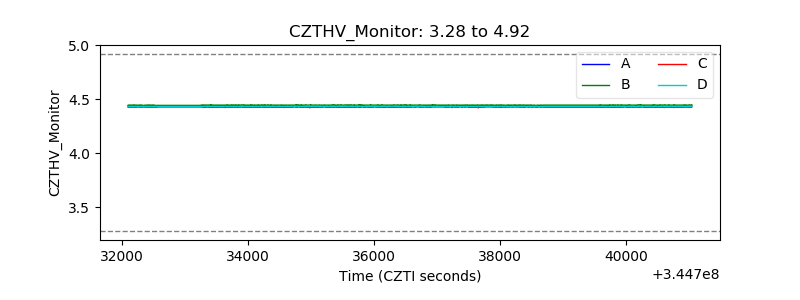 |
| D_VDD | 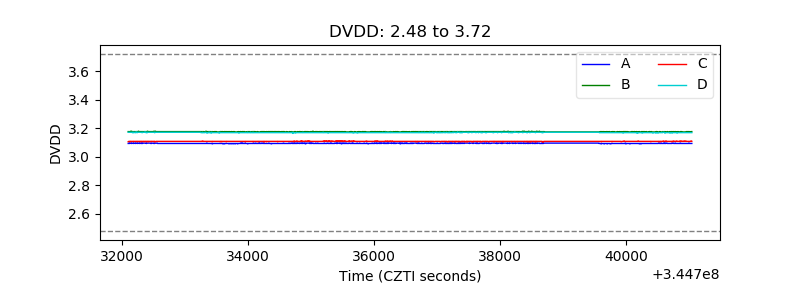 |
| Temperature 1 | 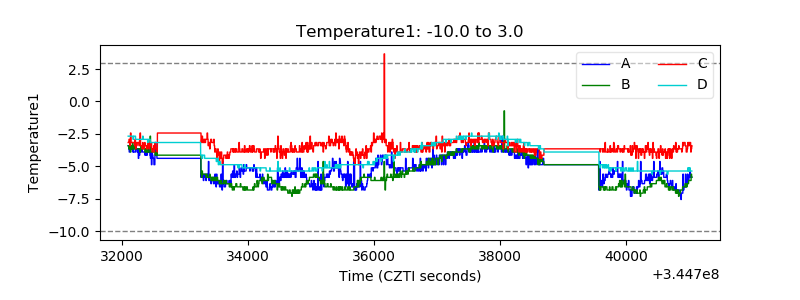 |
| Veto HV Monitor |  |
| Veto LLD | 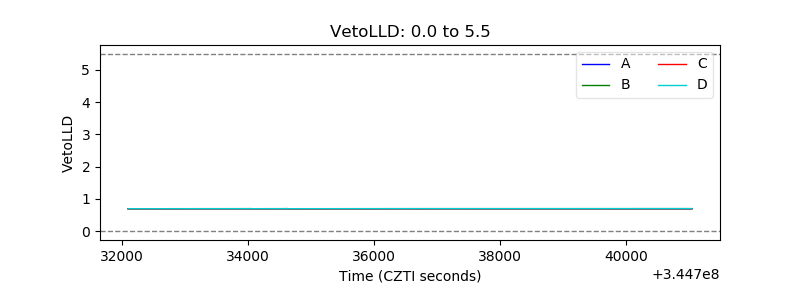 |
| Alpha Counter | 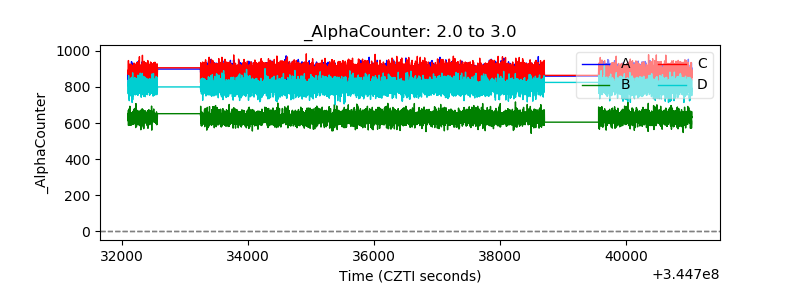 |
| _CPM_Rate |  |
| CZT Counter | 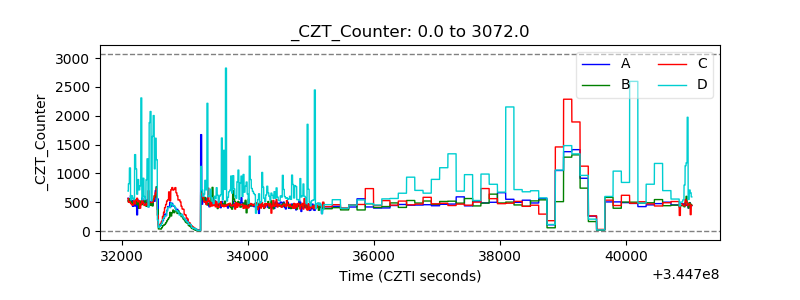 |
| +2.5 Volts monitor | 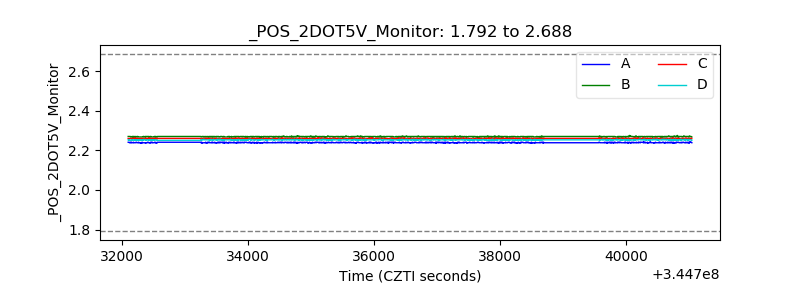 |
| +5 Volts monitor |  |
| _ROLL_ROT | 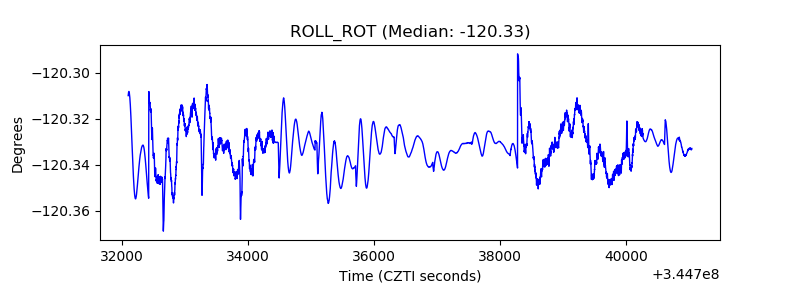 |
| _Roll_DEC | 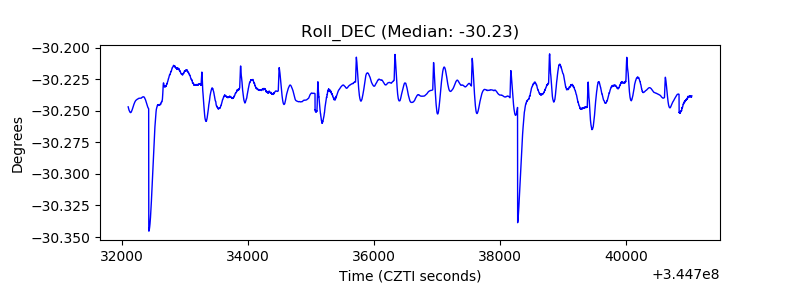 |
| _Roll_RA | 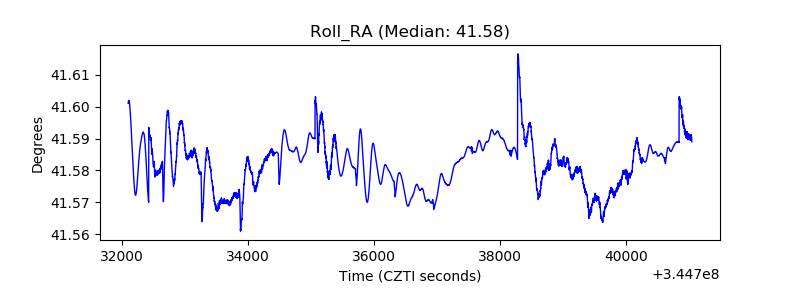 |
| Veto Counter | 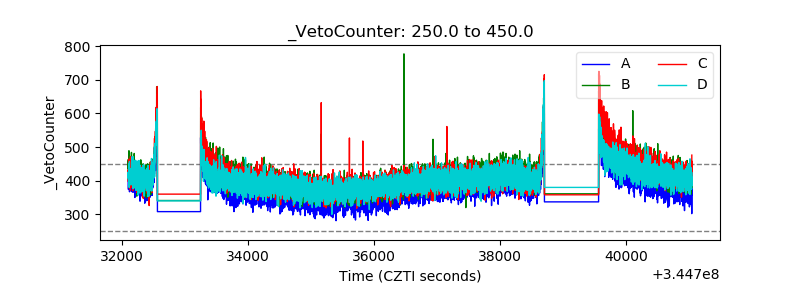 |