| Param | Original file | Final file |
|---|---|---|
| Filename | modeM0/AS1A10_048T02_9000004050_28033cztM0_level2.evt | modeM0/AS1A10_048T02_9000004050_28033cztM0_level2_quad_clean.evt |
| Size (bytes) | 523,828,800 | 82,664,640 |
| Size | 499.6 MB | 78.8 MB |
| Events in quadrant A | 3,050,180 | 532,452 |
| Events in quadrant B | 3,285,374 | 539,019 |
| Events in quadrant C | 3,190,252 | 510,369 |
| Events in quadrant D | 5,905,933 | 476,199 |
| Mode M0 | |||
|---|---|---|---|
| Quadrant | BADHDUFLAG | Total packets | Discarded packets |
| A | 0 | 12973 | 0 |
| B | 0 | 13687 | 0 |
| C | 0 | 13278 | 0 |
| D | 0 | 21905 | 0 |
| Mode M9 | |||
|---|---|---|---|
| Quadrant | BADHDUFLAG | Total packets | Discarded packets |
| A | 0 | 10 | 0 |
| B | 0 | 10 | 0 |
| C | 0 | 10 | 0 |
| D | 0 | 10 | 0 |
| Quadrant | Total seconds | Saturated seconds | Saturation percentage |
|---|---|---|---|
| A | 6376 | 17 | 0.266625% |
| B | 6377 | 29 | 0.454759% |
| C | 6376 | 45 | 0.705772% |
| D | 6376 | 651 | 10.210163% |
Noise dominated data is calculated using 1-second bins in cleaned event files. If a bin has >2000 counts, and if more than 50% of those come from <1% of pixels, then it is considered to be noise-dominated and hence unusable.
| Quadrant | # 1 sec bins | Bins with >0 counts | Bins with >2000 counts | High rate bins dominated by noise | Noise dominated (total time) | Noise dominated (detector-on time) | Marked lightcurve |
|---|---|---|---|---|---|---|---|
| A | 7401 | 6377 | 1 | 1 | 0.01% | 0.02% | 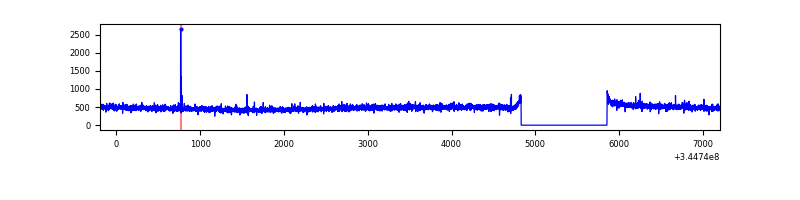 |
| B | 7402 | 6377 | 3 | 3 | 0.04% | 0.05% | 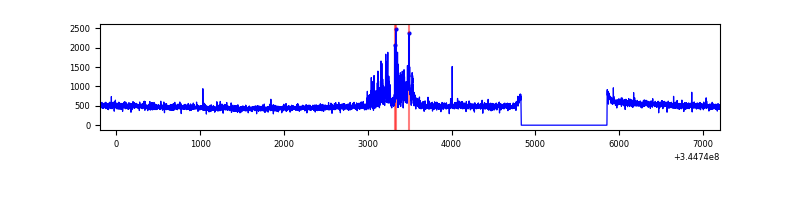 |
| C | 7401 | 6376 | 1 | 1 | 0.01% | 0.02% | 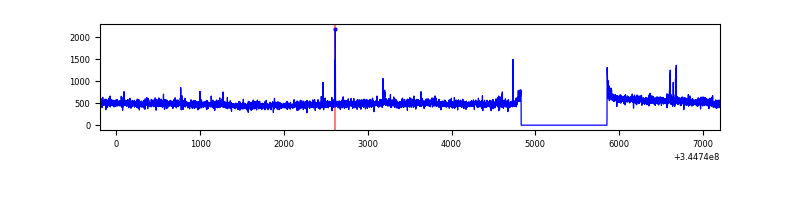 |
| D | 7400 | 6376 | 622 | 622 | 8.41% | 9.76% | 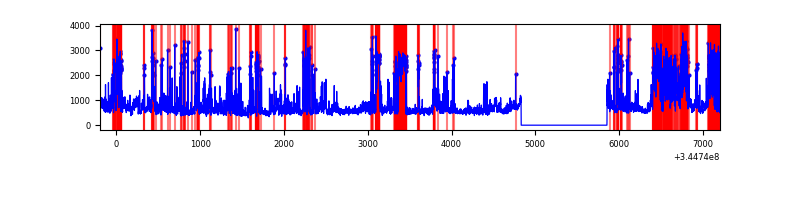 |
Top three noisy pixels from each quadrant. If the there are fewer than three noisy pixels in the level2.evt file, extra rows are filled as -1
| Pixel properties | Quadrant properties | ||||||
|---|---|---|---|---|---|---|---|
| Quadrant | DetID | PixID | Counts | Sigma | Mean | Median | Sigma |
| A | 13 | 254 | 9902 | 57.07 | 788 | 773 | 160.0 |
| A | 3 | 137 | 7398 | 41.42 | 788 | 773 | 160.0 |
| A | 0 | 226 | 6421 | 35.31 | 788 | 773 | 160.0 |
| B | 10 | 245 | 187031 | 1241.04 | 786 | 765 | 150.1 |
| B | 12 | 111 | 18969 | 121.29 | 786 | 765 | 150.1 |
| B | 11 | 111 | 17052 | 108.52 | 786 | 765 | 150.1 |
| C | 14 | 238 | 122018 | 675.04 | 764 | 770 | 179.6 |
| C | 3 | 233 | 90423 | 499.14 | 764 | 770 | 179.6 |
| C | 13 | 61 | 5290 | 25.16 | 764 | 770 | 179.6 |
| D | 1 | 52 | 2121645 | 12205.08 | 737 | 718 | 173.8 |
| D | 8 | 195 | 630755 | 3625.61 | 737 | 718 | 173.8 |
| D | 7 | 80 | 362311 | 2080.82 | 737 | 718 | 173.8 |
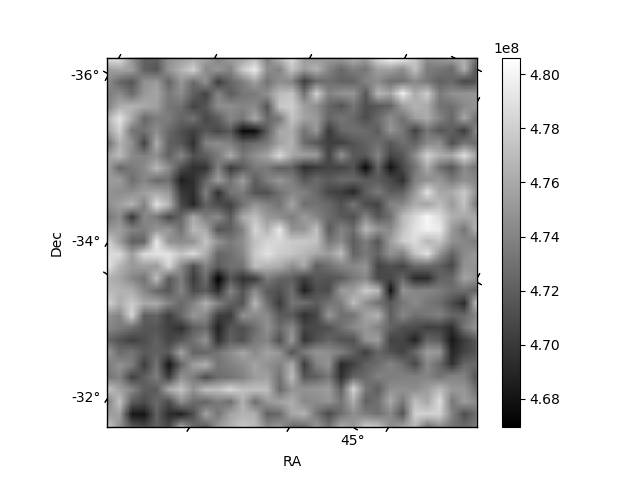
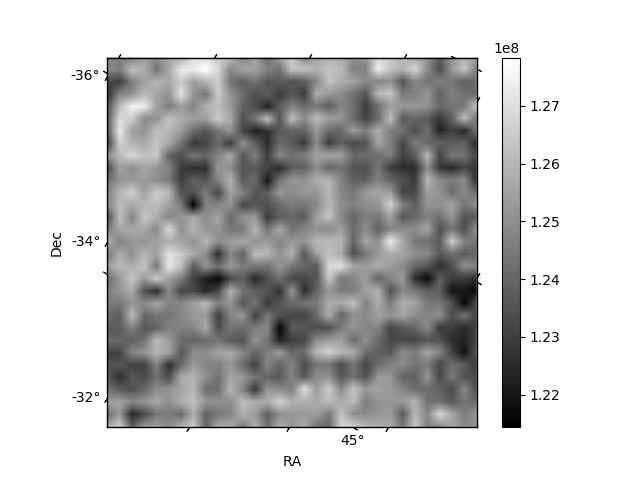
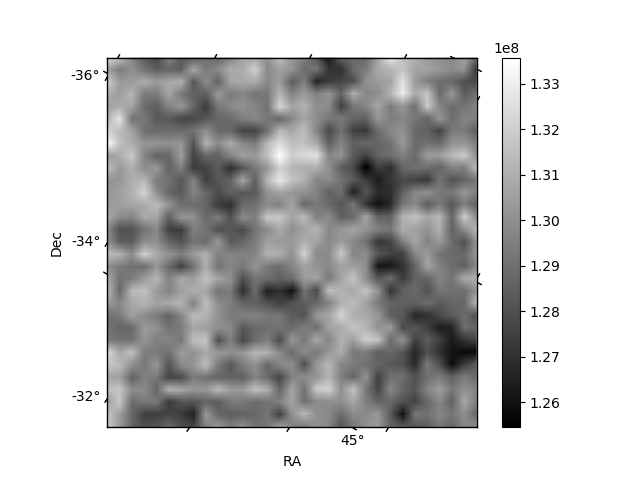
Histogram calculated using DETX and DETY for each event in the final _common_clean file
| Quadrant A | 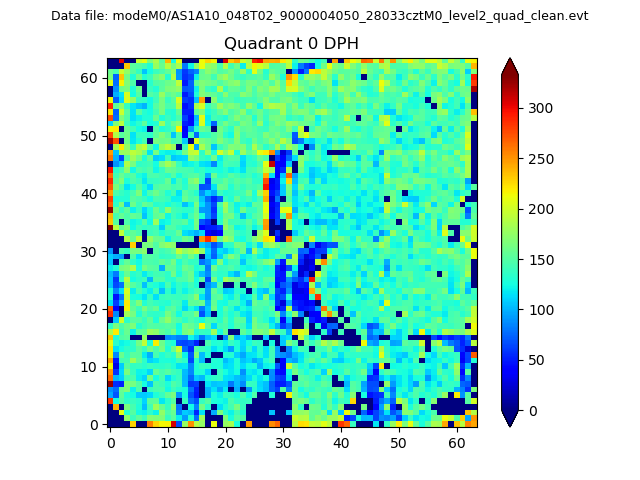 |
 |
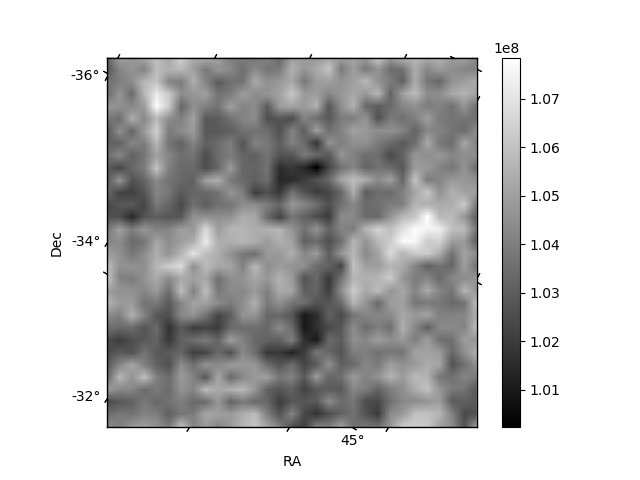
Quadrant B |
|---|---|---|---|
| Quadrant D | 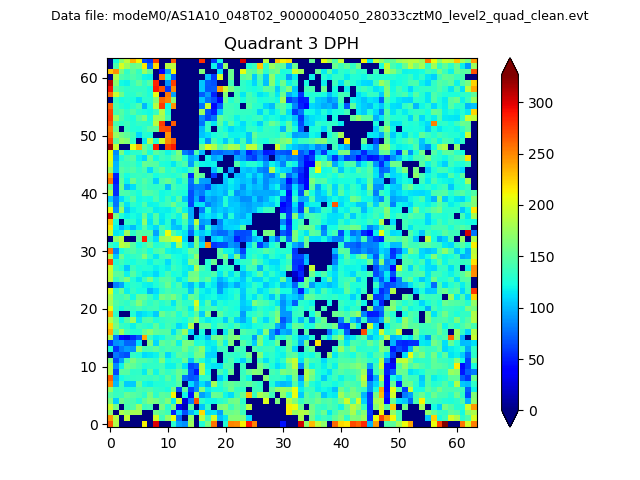 |
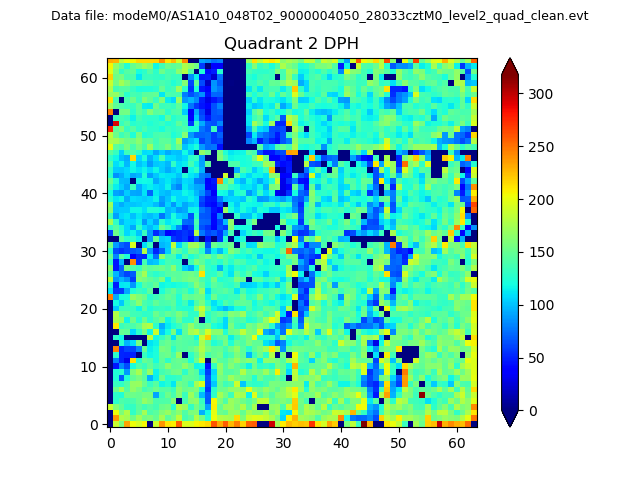 |
Quadrant C |
| Plot type | Count rate plots | Images |
|---|---|---|
| Comparison with Poisson distribution Blue bars denote a histogram of data divided into 1 sec bins. Red curve is a Poisson curve with rate = median count rate of data. |
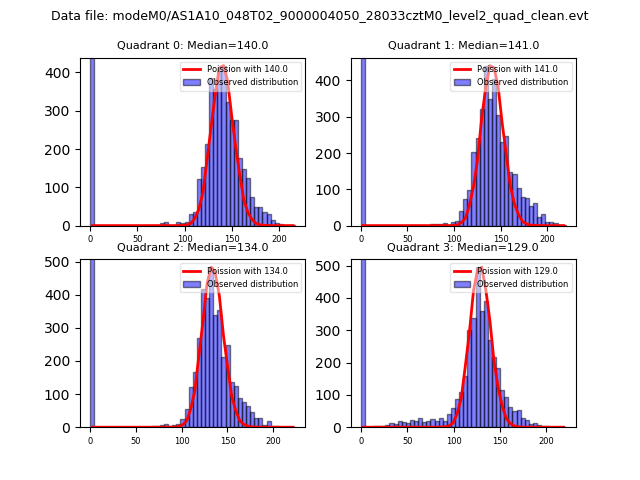 |
 |
| Quadrant-wise count rates Data is divided into 100 sec bins |
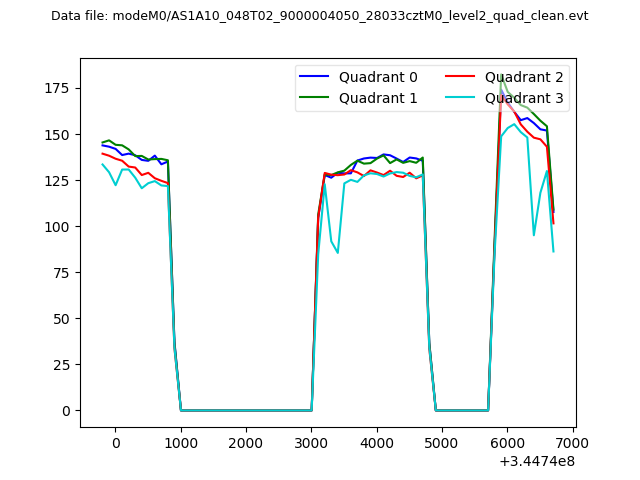 |
|
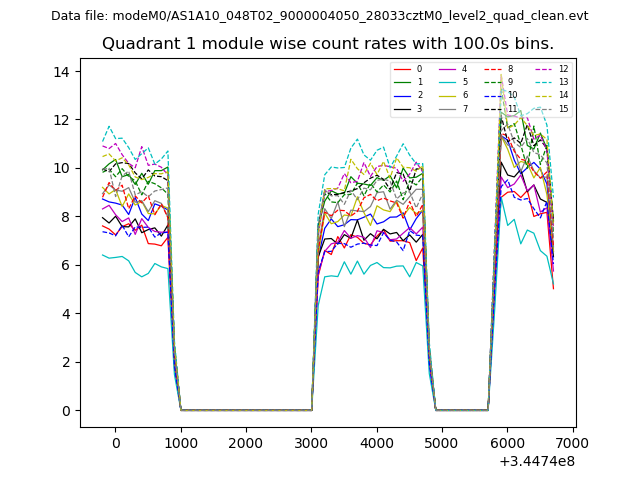
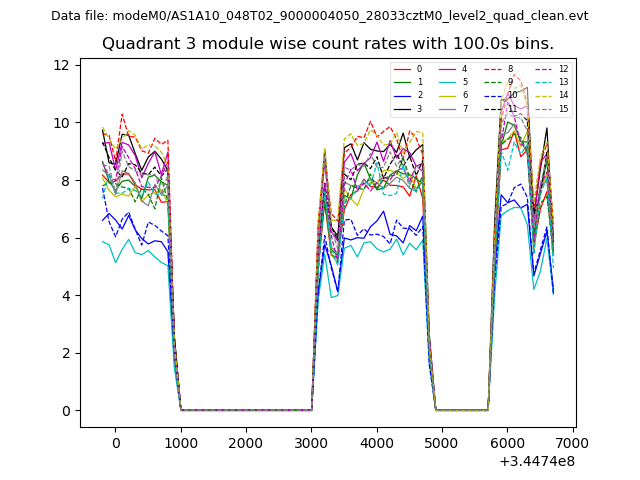
| Module-wise count rates for Quadrant A Data is divided into 100 sec bins |
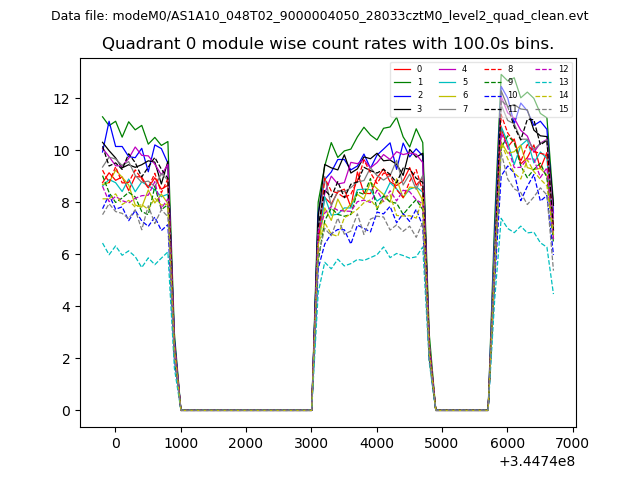 |
 |
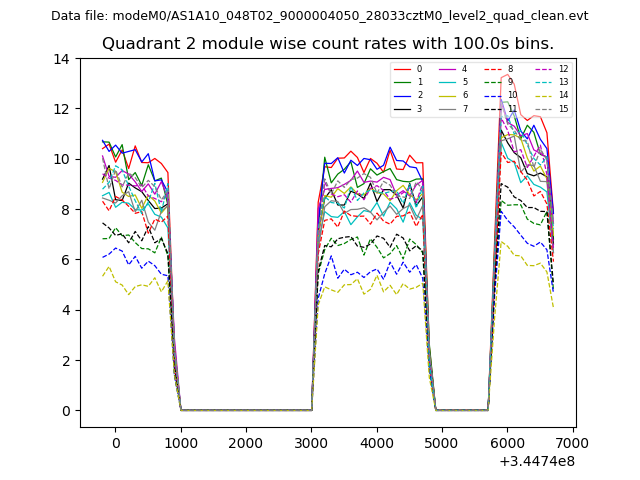
| Module-wise count rates for Quadrant B Data is divided into 100 sec bins |
 |
 |
| Module-wise count rates for Quadrant C Data is divided into 100 sec bins |
 |
 |
| Module-wise count rates for Quadrant D Data is divided into 100 sec bins |
 |
 |
| Parameter | Plot |
|---|---|
| CZT HV Monitor | 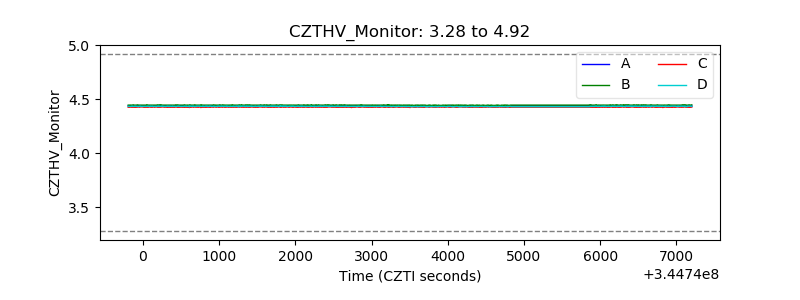 |
| D_VDD | 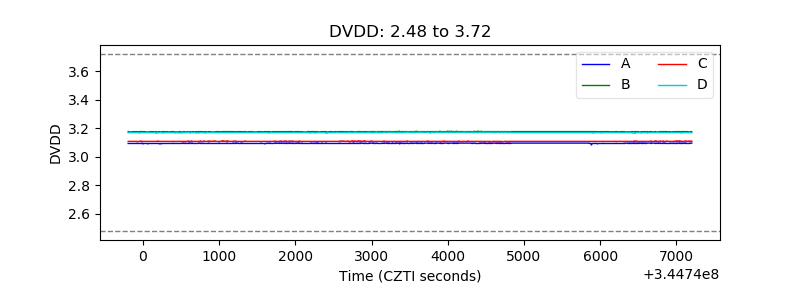 |
| Temperature 1 | 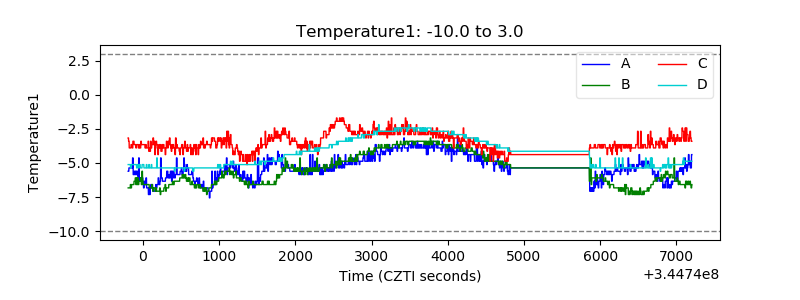 |
| Veto HV Monitor | 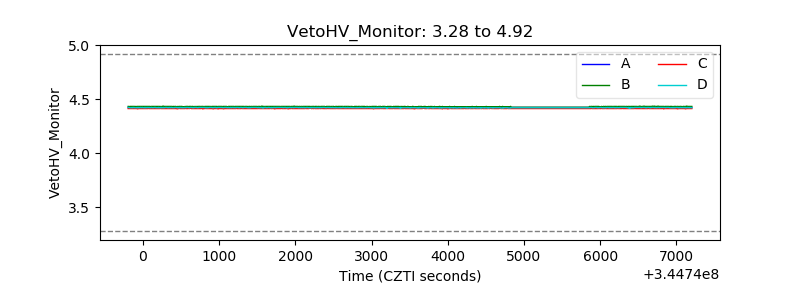 |
| Veto LLD | 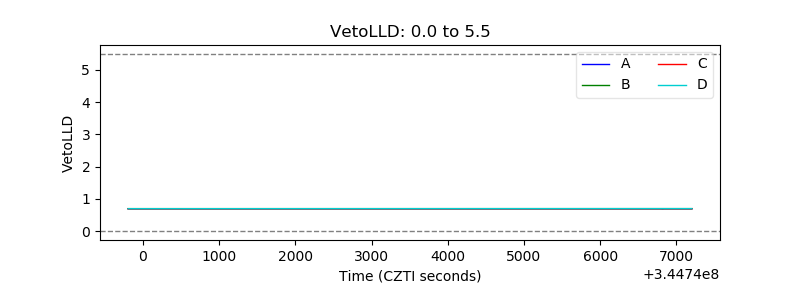 |
| Alpha Counter | 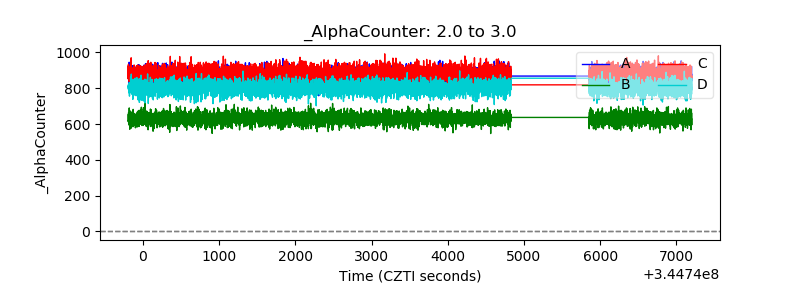 |
| _CPM_Rate |  |
| CZT Counter | 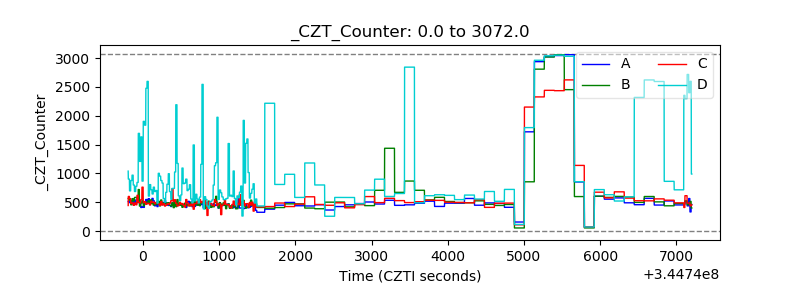 |
| +2.5 Volts monitor |  |
| +5 Volts monitor |  |
| _ROLL_ROT | 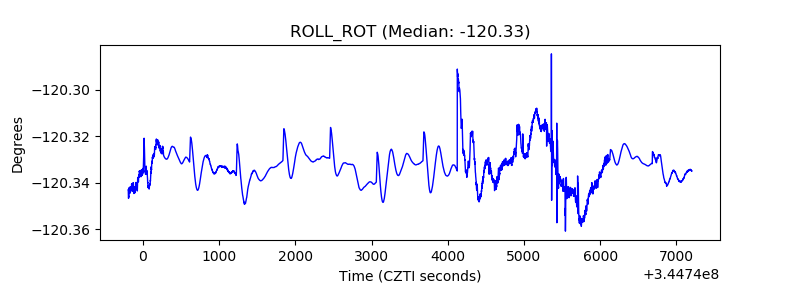 |
| _Roll_DEC | 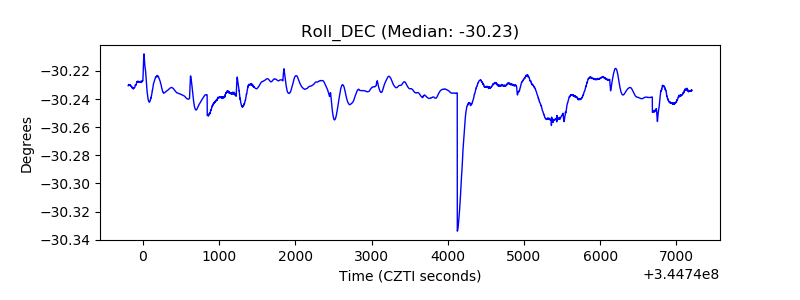 |
| _Roll_RA | 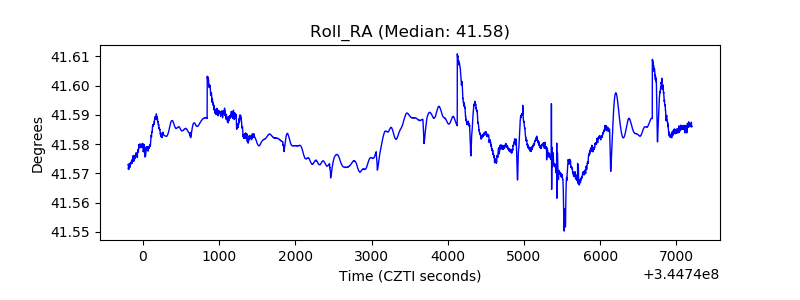 |
| Veto Counter |  |