| Param | Original file | Final file |
|---|---|---|
| Filename | modeM0/AS1A10_048T02_9000004050_28035cztM0_level2.evt | modeM0/AS1A10_048T02_9000004050_28035cztM0_level2_quad_clean.evt |
| Size (bytes) | 567,072,000 | 81,979,200 |
| Size | 540.8 MB | 78.2 MB |
| Events in quadrant A | 3,234,449 | 527,223 |
| Events in quadrant B | 3,348,868 | 534,299 |
| Events in quadrant C | 3,406,043 | 509,019 |
| Events in quadrant D | 6,750,704 | 464,881 |
| Mode M0 | |||
|---|---|---|---|
| Quadrant | BADHDUFLAG | Total packets | Discarded packets |
| A | 0 | 13524 | 0 |
| B | 0 | 13867 | 0 |
| C | 0 | 14098 | 0 |
| D | 0 | 24560 | 0 |
| Mode M9 | |||
|---|---|---|---|
| Quadrant | BADHDUFLAG | Total packets | Discarded packets |
| A | 0 | 21 | 0 |
| B | 0 | 21 | 0 |
| C | 0 | 21 | 0 |
| D | 0 | 21 | 0 |
| Quadrant | Total seconds | Saturated seconds | Saturation percentage |
|---|---|---|---|
| A | 6403 | 48 | 0.749649% |
| B | 6403 | 83 | 1.296267% |
| C | 6403 | 107 | 1.671092% |
| D | 6404 | 905 | 14.131793% |
Noise dominated data is calculated using 1-second bins in cleaned event files. If a bin has >2000 counts, and if more than 50% of those come from <1% of pixels, then it is considered to be noise-dominated and hence unusable.
| Quadrant | # 1 sec bins | Bins with >0 counts | Bins with >2000 counts | High rate bins dominated by noise | Noise dominated (total time) | Noise dominated (detector-on time) | Marked lightcurve |
|---|---|---|---|---|---|---|---|
| A | 8568 | 6404 | 0 | 0 | 0.00% | 0.00% | 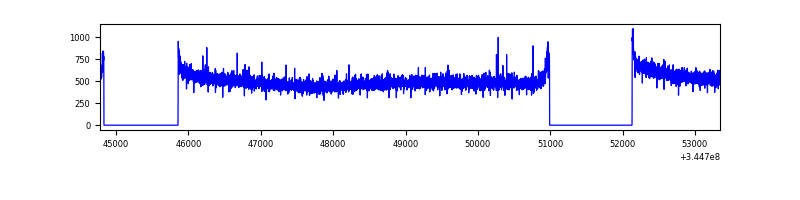 |
| B | 8568 | 6403 | 13 | 13 | 0.15% | 0.20% | 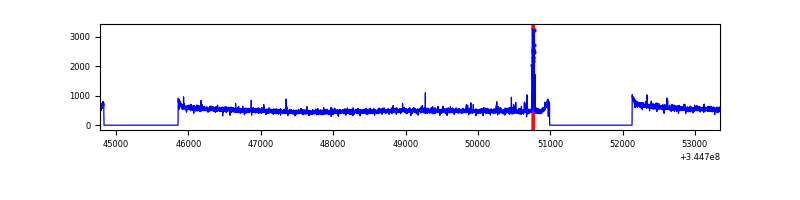 |
| C | 8568 | 6403 | 0 | 0 | 0.00% | 0.00% | 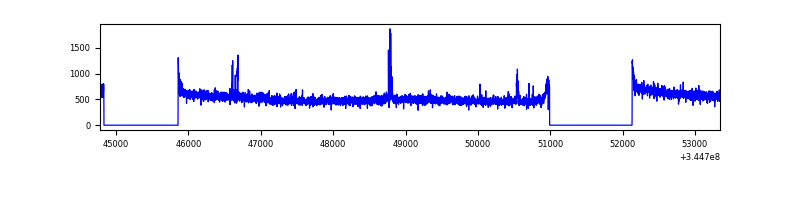 |
| D | 8569 | 6405 | 836 | 836 | 9.76% | 13.05% | 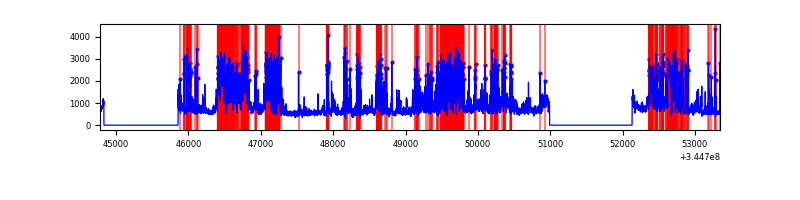 |
Top three noisy pixels from each quadrant. If the there are fewer than three noisy pixels in the level2.evt file, extra rows are filled as -1
| Pixel properties | Quadrant properties | ||||||
|---|---|---|---|---|---|---|---|
| Quadrant | DetID | PixID | Counts | Sigma | Mean | Median | Sigma |
| A | 13 | 254 | 9144 | 50.05 | 837 | 823 | 166.3 |
| A | 3 | 137 | 7748 | 41.65 | 837 | 823 | 166.3 |
| A | 0 | 226 | 6868 | 36.36 | 837 | 823 | 166.3 |
| B | 15 | 222 | 53876 | 334.62 | 836 | 816 | 158.6 |
| B | 12 | 111 | 19449 | 117.51 | 836 | 816 | 158.6 |
| B | 11 | 111 | 17526 | 105.38 | 836 | 816 | 158.6 |
| C | 14 | 238 | 132345 | 697.17 | 818 | 827 | 188.6 |
| C | 3 | 233 | 81248 | 426.31 | 818 | 827 | 188.6 |
| C | 10 | 22 | 7169 | 33.62 | 818 | 827 | 188.6 |
| D | 1 | 52 | 2835724 | 15525.79 | 778 | 759 | 182.6 |
| D | 8 | 195 | 645210 | 3529.36 | 778 | 759 | 182.6 |
| D | 7 | 80 | 332145 | 1814.85 | 778 | 759 | 182.6 |
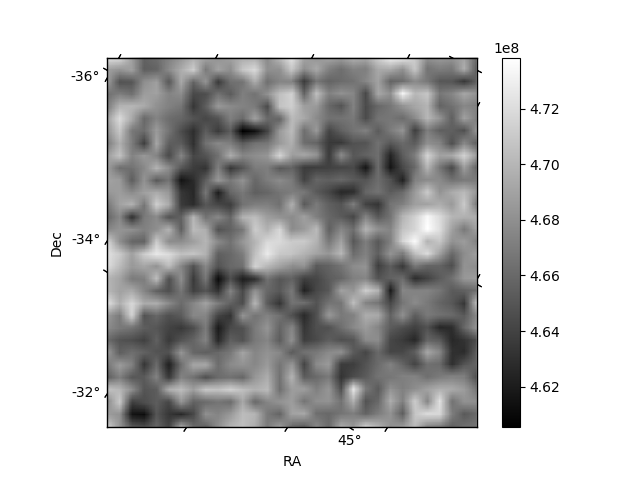
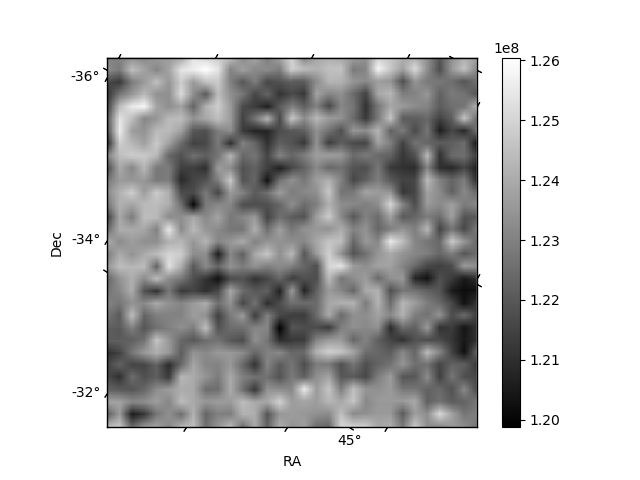
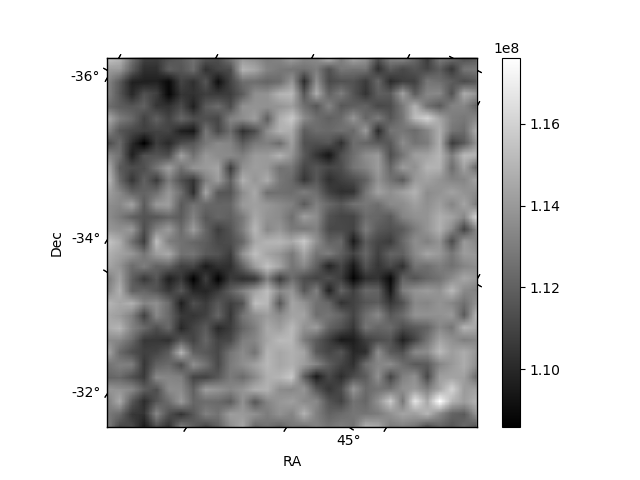
Histogram calculated using DETX and DETY for each event in the final _common_clean file
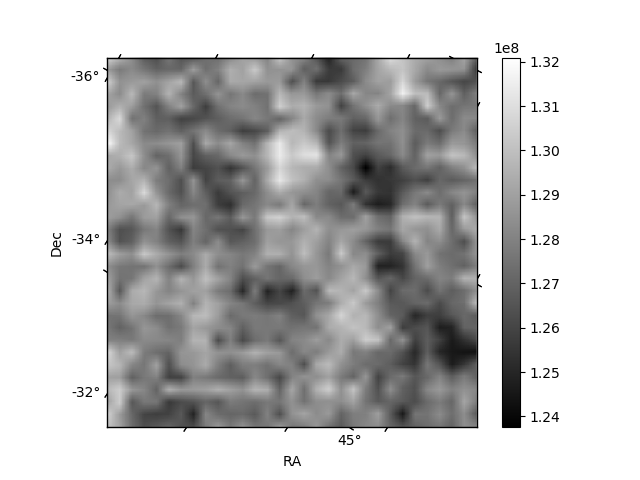
| Quadrant A | 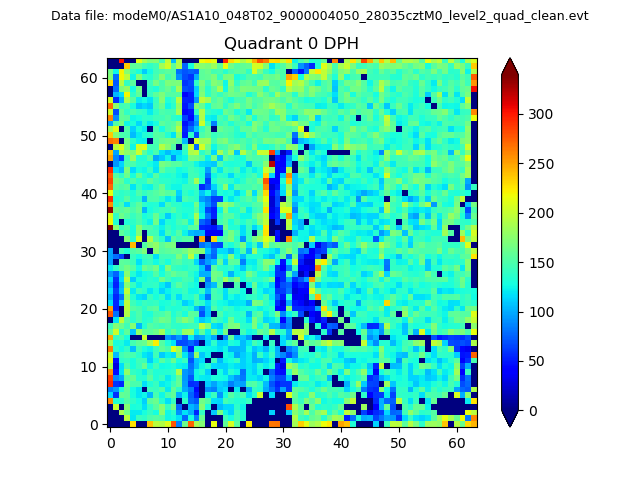 |
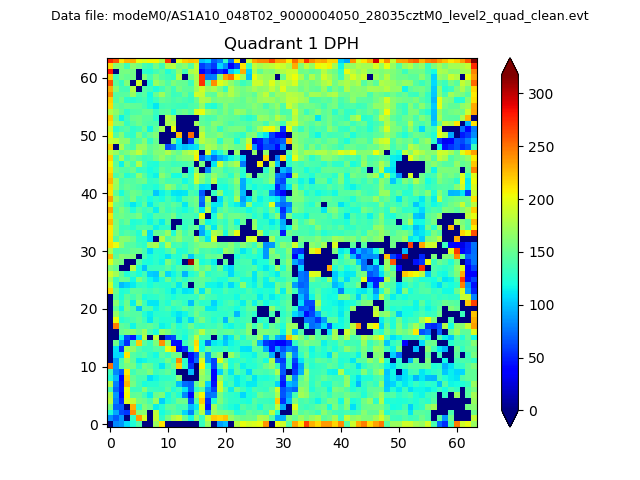 |
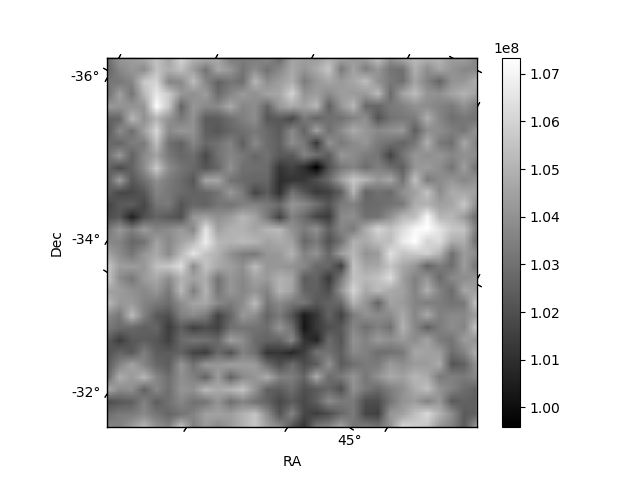
Quadrant B |
|---|---|---|---|
| Quadrant D | 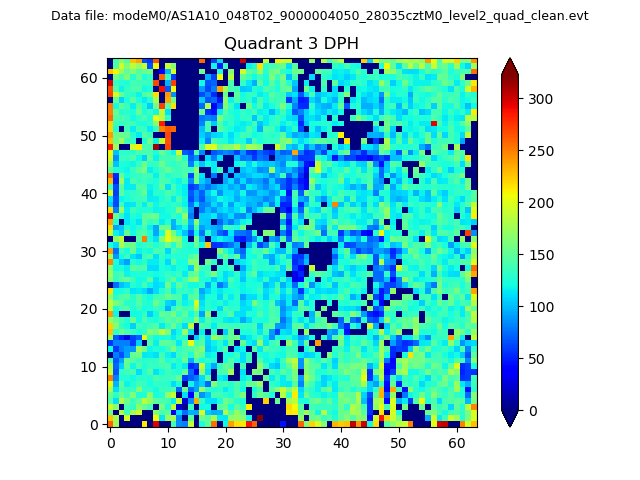 |
 |
Quadrant C |
| Plot type | Count rate plots | Images |
|---|---|---|
| Comparison with Poisson distribution Blue bars denote a histogram of data divided into 1 sec bins. Red curve is a Poisson curve with rate = median count rate of data. |
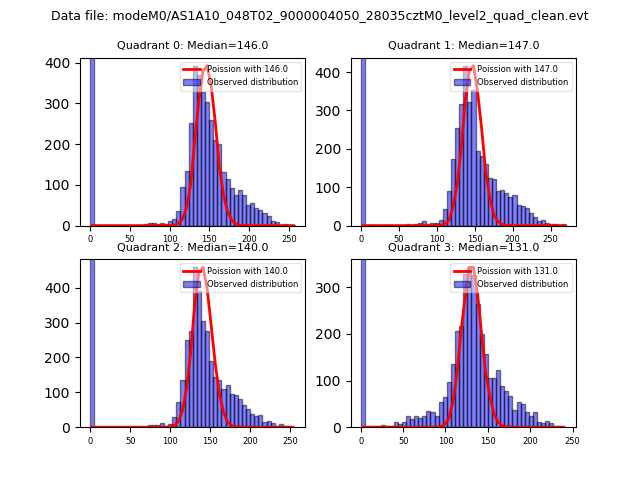 |
 |
| Quadrant-wise count rates Data is divided into 100 sec bins |
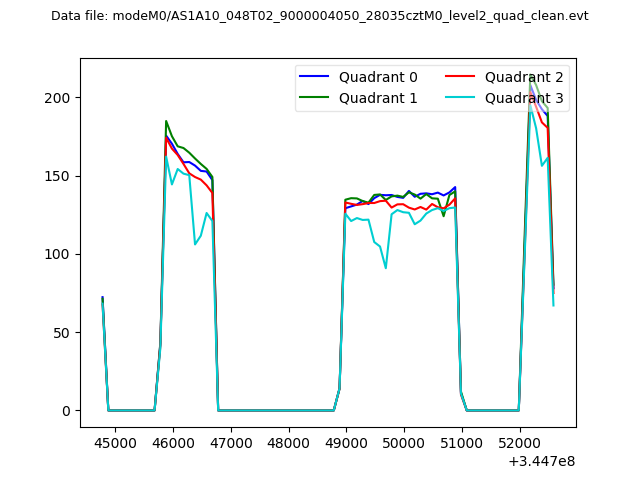 |
|
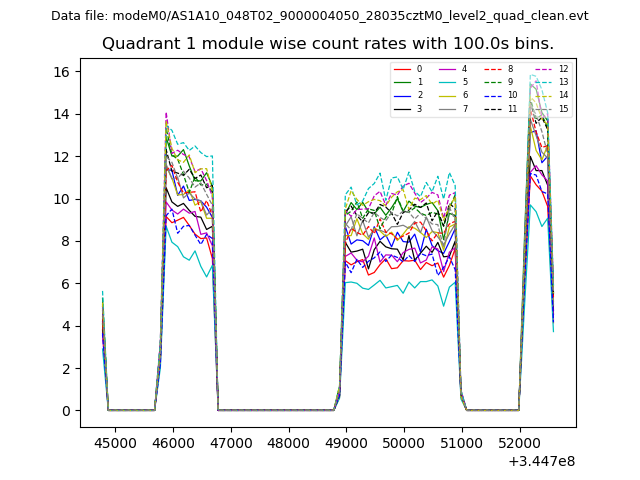
| Module-wise count rates for Quadrant A Data is divided into 100 sec bins |
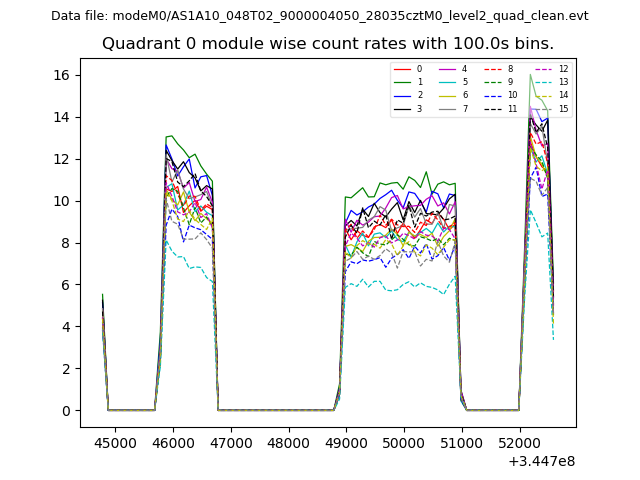 |
 |
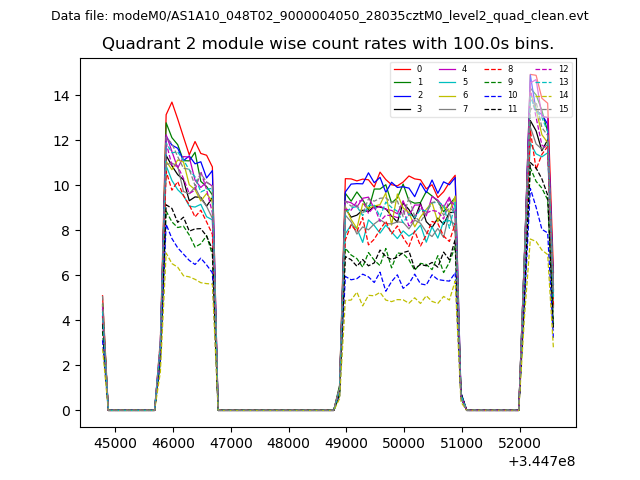
| Module-wise count rates for Quadrant B Data is divided into 100 sec bins |
 |
 |
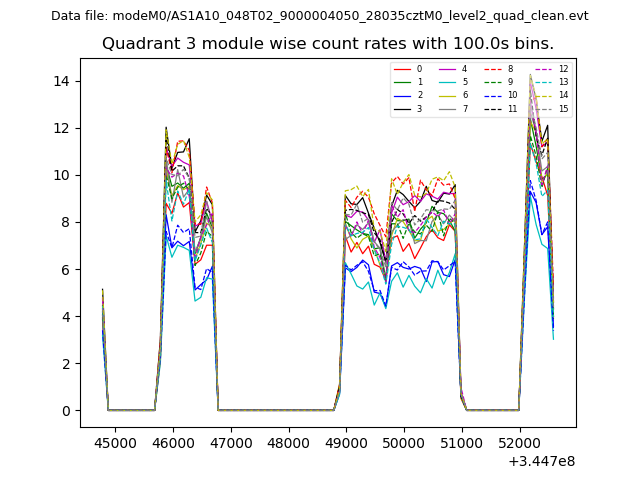
| Module-wise count rates for Quadrant C Data is divided into 100 sec bins |
 |
 |
| Module-wise count rates for Quadrant D Data is divided into 100 sec bins |
 |
 |
| Parameter | Plot |
|---|---|
| CZT HV Monitor | 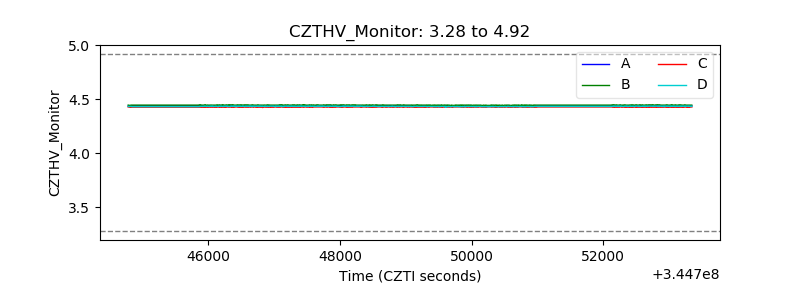 |
| D_VDD | 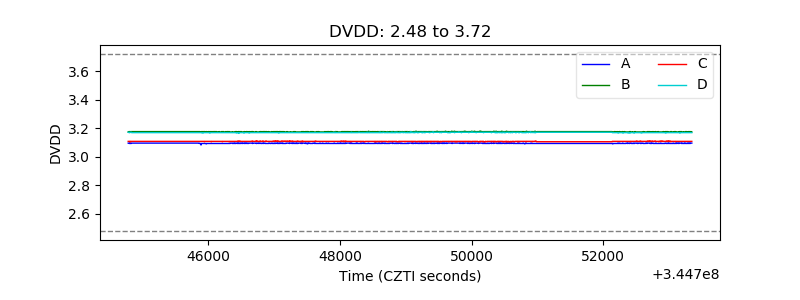 |
| Temperature 1 | 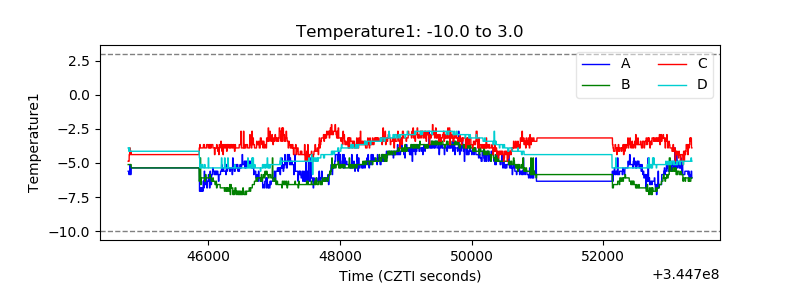 |
| Veto HV Monitor | 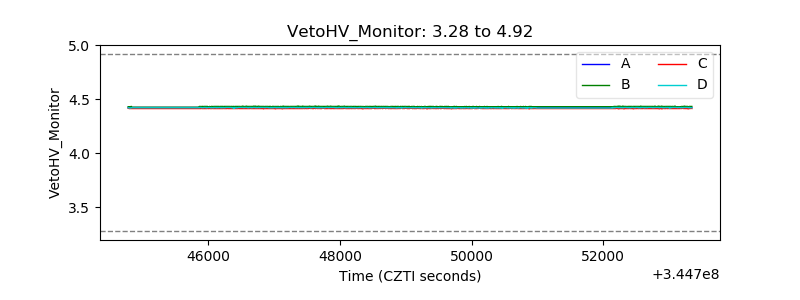 |
| Veto LLD | 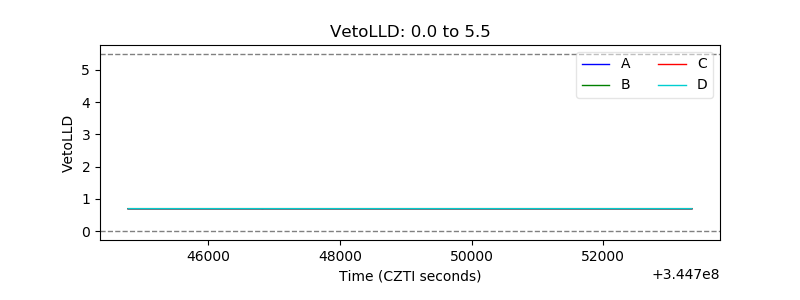 |
| Alpha Counter | 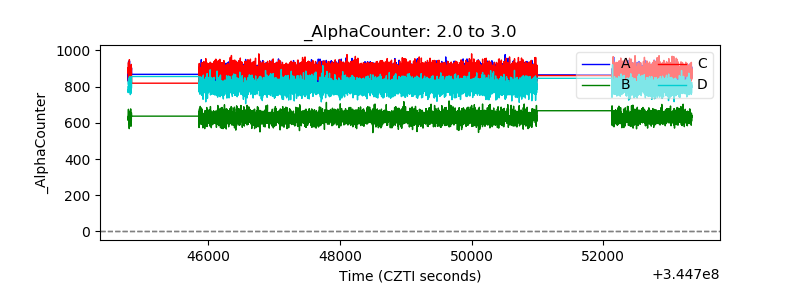 |
| _CPM_Rate | 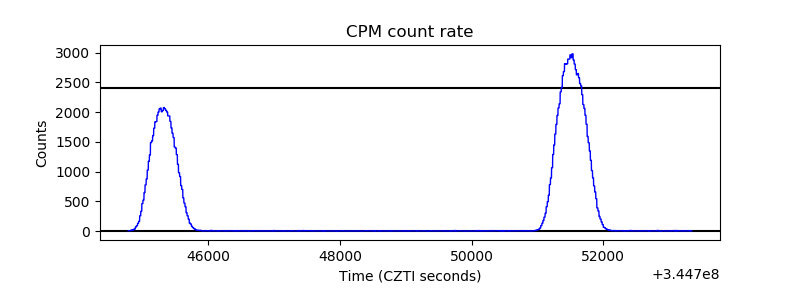 |
| CZT Counter | 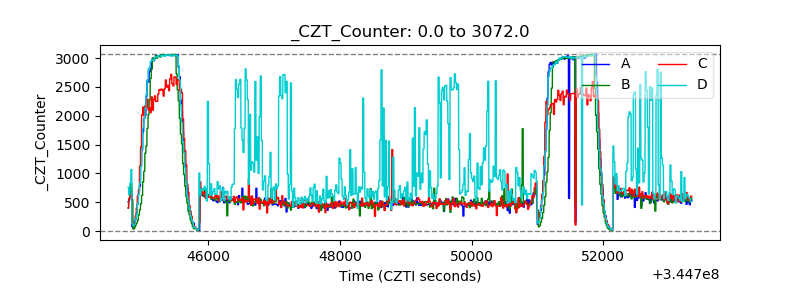 |
| +2.5 Volts monitor | 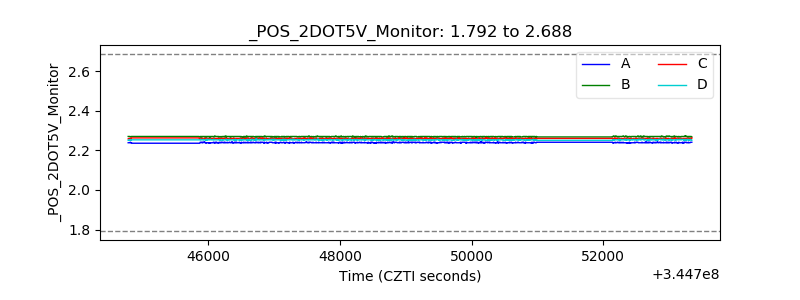 |
| +5 Volts monitor | 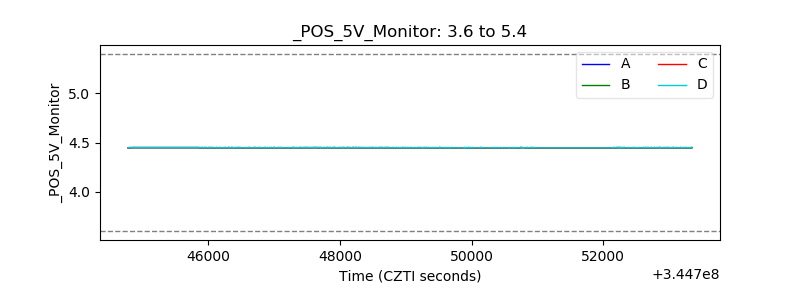 |
| _ROLL_ROT | 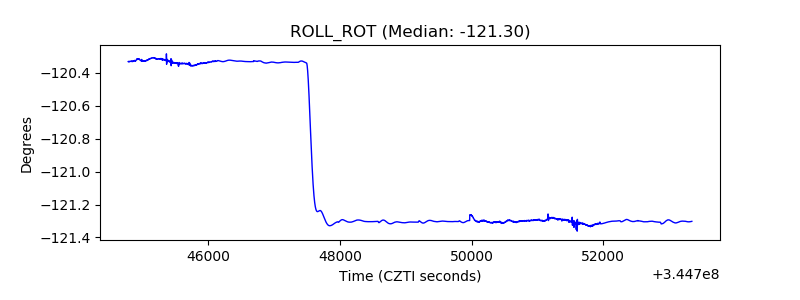 |
| _Roll_DEC | 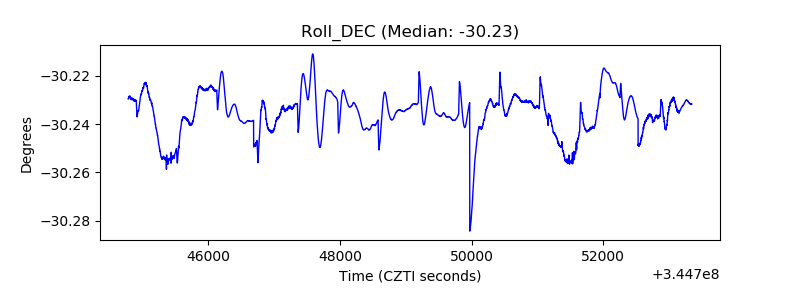 |
| _Roll_RA | 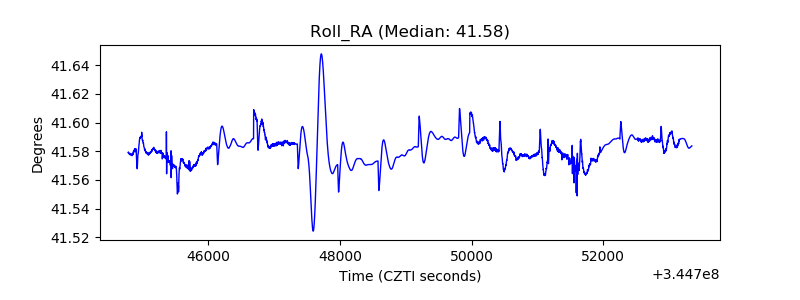 |
| Veto Counter | 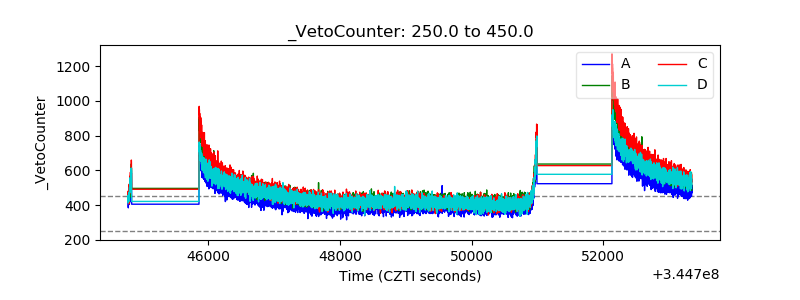 |