| Param | Original file | Final file |
|---|---|---|
| Filename | modeM0/AS1A10_048T02_9000004050_28036cztM0_level2.evt | modeM0/AS1A10_048T02_9000004050_28036cztM0_level2_quad_clean.evt |
| Size (bytes) | 551,073,600 | 71,029,440 |
| Size | 525.5 MB | 67.7 MB |
| Events in quadrant A | 3,365,591 | 442,449 |
| Events in quadrant B | 3,446,440 | 448,931 |
| Events in quadrant C | 3,572,801 | 427,890 |
| Events in quadrant D | 5,881,306 | 395,184 |
| Mode M0 | |||
|---|---|---|---|
| Quadrant | BADHDUFLAG | Total packets | Discarded packets |
| A | 0 | 13820 | 0 |
| B | 0 | 14105 | 0 |
| C | 0 | 14646 | 0 |
| D | 0 | 22020 | 0 |
| Mode M9 | |||
|---|---|---|---|
| Quadrant | BADHDUFLAG | Total packets | Discarded packets |
| A | 0 | 12 | 0 |
| B | 0 | 12 | 0 |
| C | 0 | 12 | 0 |
| D | 0 | 12 | 0 |
| Quadrant | Total seconds | Saturated seconds | Saturation percentage |
|---|---|---|---|
| A | 6251 | 74 | 1.183811% |
| B | 6250 | 90 | 1.440000% |
| C | 6251 | 152 | 2.431611% |
| D | 6251 | 591 | 9.454487% |
Noise dominated data is calculated using 1-second bins in cleaned event files. If a bin has >2000 counts, and if more than 50% of those come from <1% of pixels, then it is considered to be noise-dominated and hence unusable.
| Quadrant | # 1 sec bins | Bins with >0 counts | Bins with >2000 counts | High rate bins dominated by noise | Noise dominated (total time) | Noise dominated (detector-on time) | Marked lightcurve |
|---|---|---|---|---|---|---|---|
| A | 7471 | 6251 | 3 | 3 | 0.04% | 0.05% | 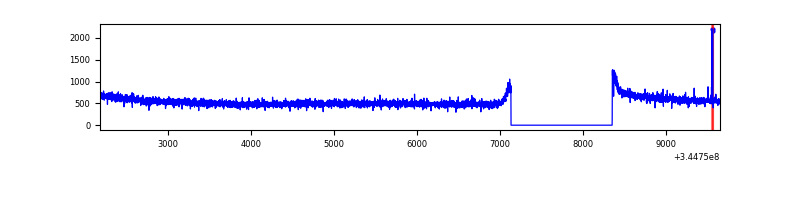 |
| B | 7470 | 6250 | 2 | 2 | 0.03% | 0.03% | 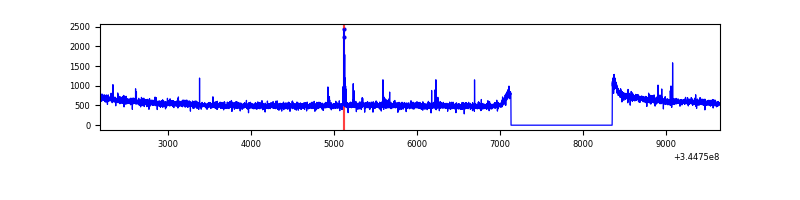 |
| C | 7471 | 6251 | 8 | 8 | 0.11% | 0.13% | 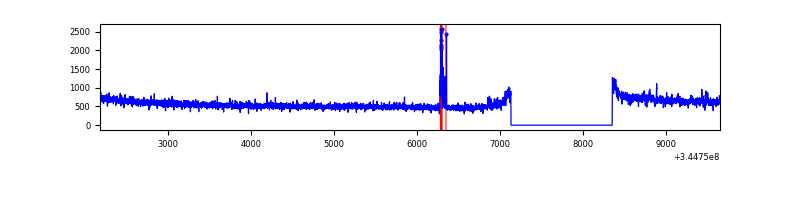 |
| D | 7471 | 6251 | 552 | 552 | 7.39% | 8.83% | 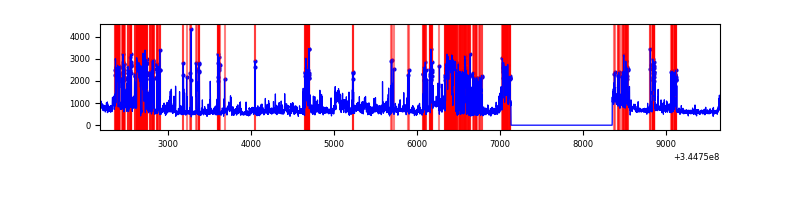 |
Top three noisy pixels from each quadrant. If the there are fewer than three noisy pixels in the level2.evt file, extra rows are filled as -1
| Pixel properties | Quadrant properties | ||||||
|---|---|---|---|---|---|---|---|
| Quadrant | DetID | PixID | Counts | Sigma | Mean | Median | Sigma |
| A | 7 | 16 | 11036 | 59.25 | 869 | 855 | 171.8 |
| A | 13 | 254 | 9895 | 52.61 | 869 | 855 | 171.8 |
| A | 3 | 137 | 7626 | 39.4 | 869 | 855 | 171.8 |
| B | 12 | 111 | 19419 | 114.53 | 872 | 852 | 162.1 |
| B | 11 | 111 | 17565 | 103.09 | 872 | 852 | 162.1 |
| B | 14 | 111 | 17185 | 100.75 | 872 | 852 | 162.1 |
| C | 14 | 238 | 139681 | 707.19 | 850 | 859 | 196.3 |
| C | 3 | 233 | 80402 | 405.21 | 850 | 859 | 196.3 |
| C | 10 | 22 | 42608 | 212.68 | 850 | 859 | 196.3 |
| D | 1 | 52 | 1787323 | 9181.3 | 821 | 802 | 194.6 |
| D | 8 | 195 | 973629 | 4999.56 | 821 | 802 | 194.6 |
| D | 2 | 234 | 20565 | 101.57 | 821 | 802 | 194.6 |
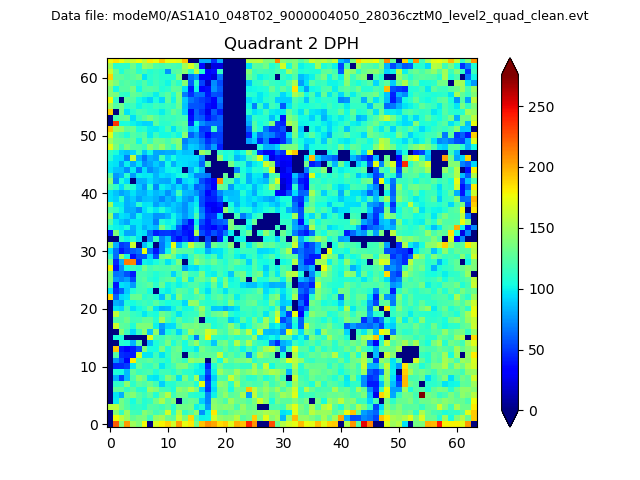
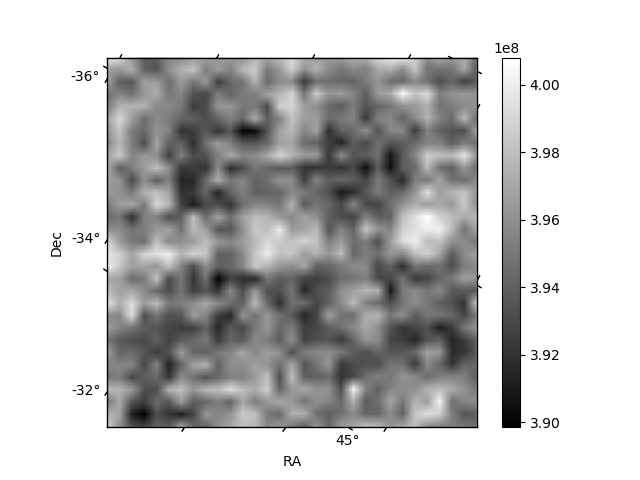
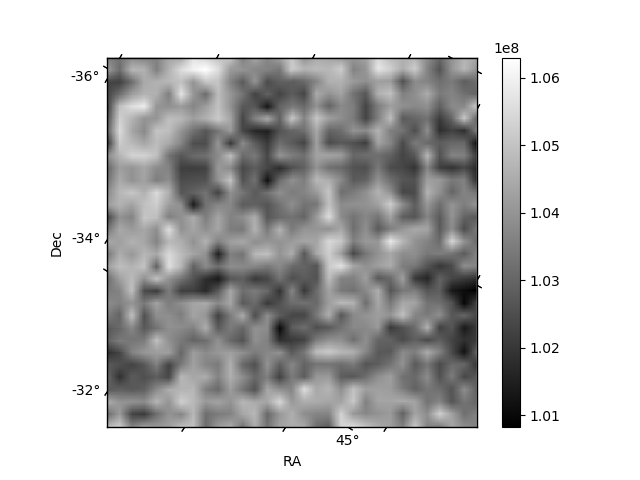
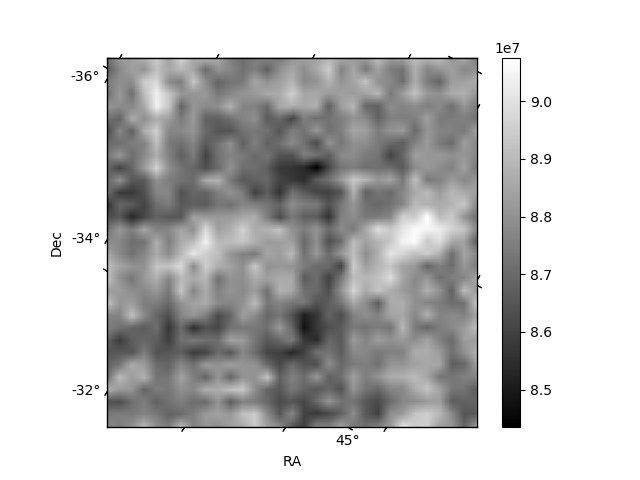
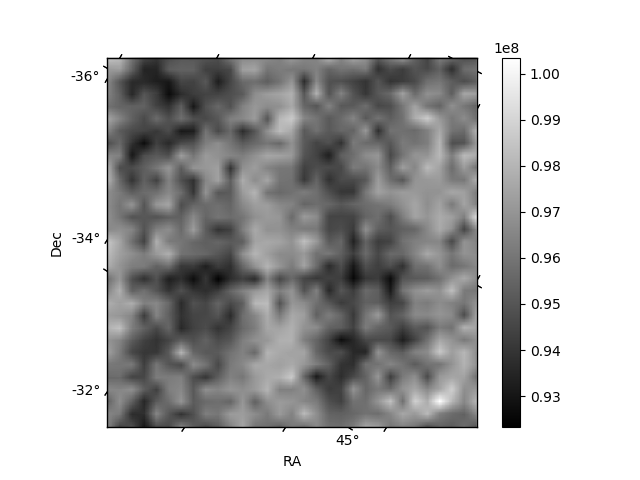
Histogram calculated using DETX and DETY for each event in the final _common_clean file
| Quadrant A | 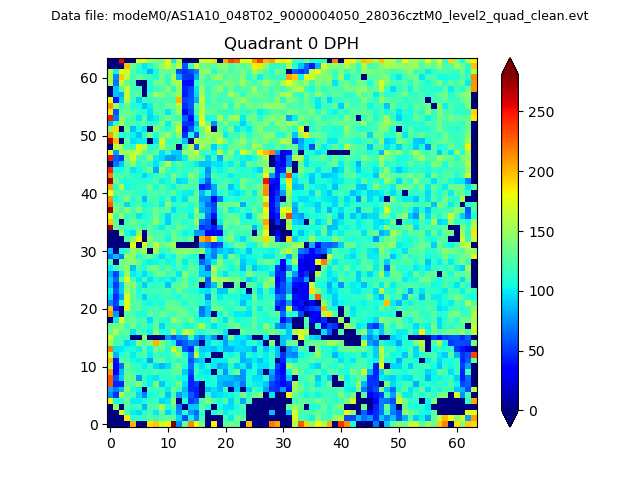 |
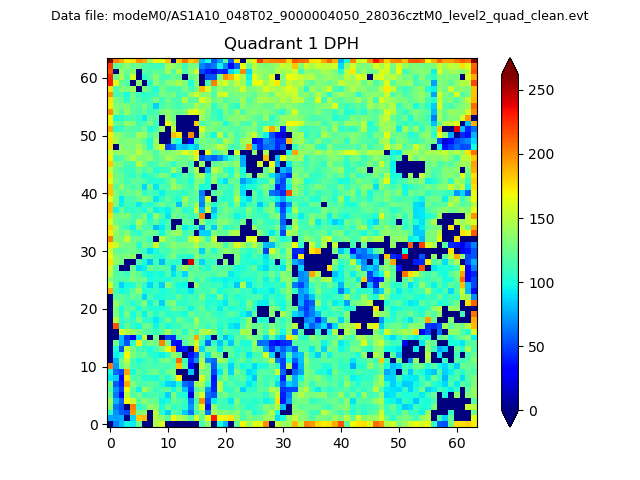 |
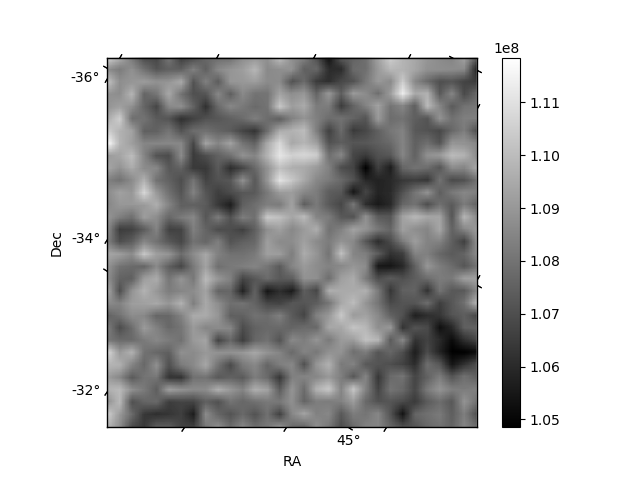
Quadrant B |
|---|---|---|---|
| Quadrant D | 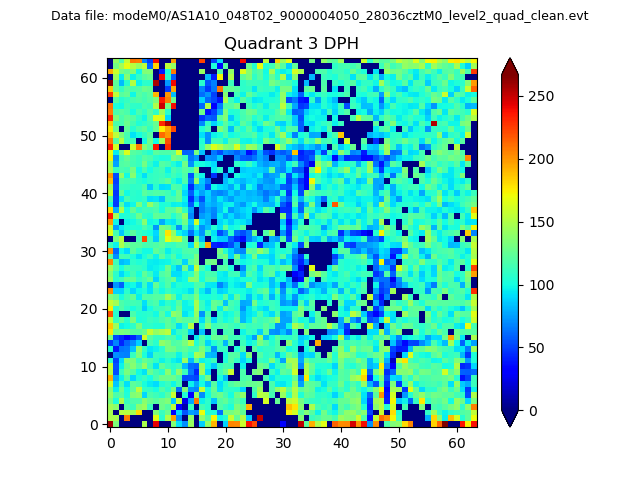 |
 |
Quadrant C |
| Plot type | Count rate plots | Images |
|---|---|---|
| Comparison with Poisson distribution Blue bars denote a histogram of data divided into 1 sec bins. Red curve is a Poisson curve with rate = median count rate of data. |
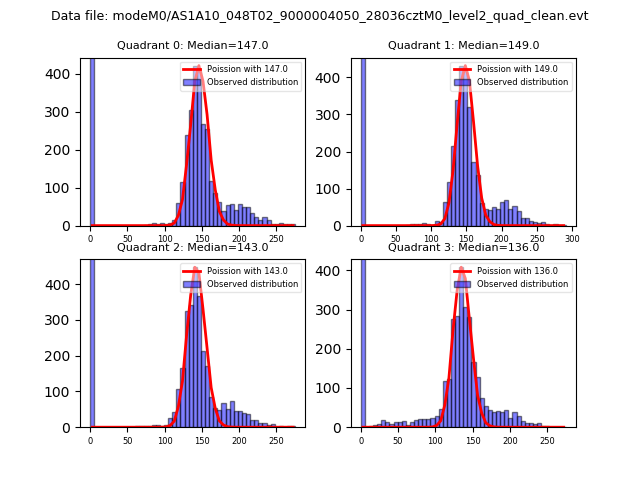 |
 |
| Quadrant-wise count rates Data is divided into 100 sec bins |
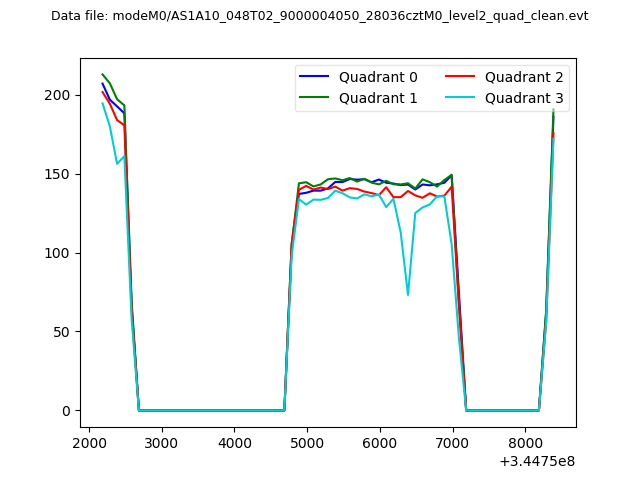 |
|
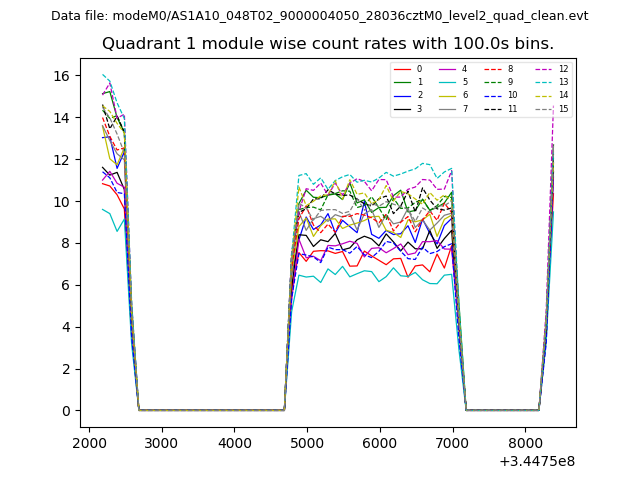
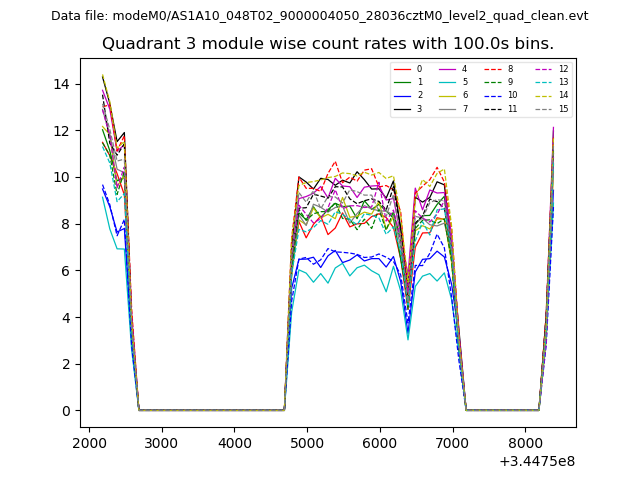
| Module-wise count rates for Quadrant A Data is divided into 100 sec bins |
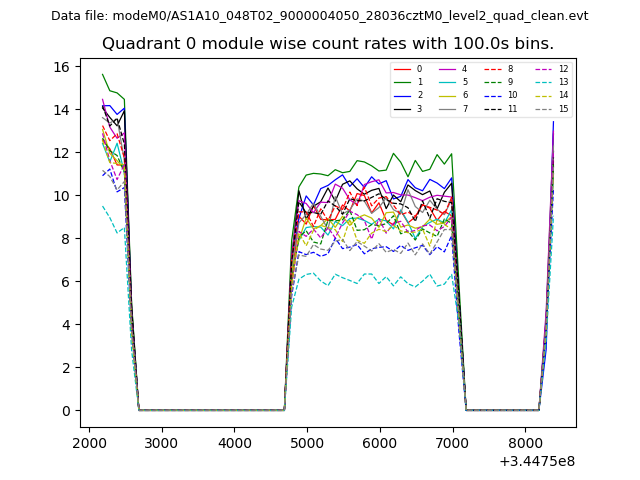 |
 |
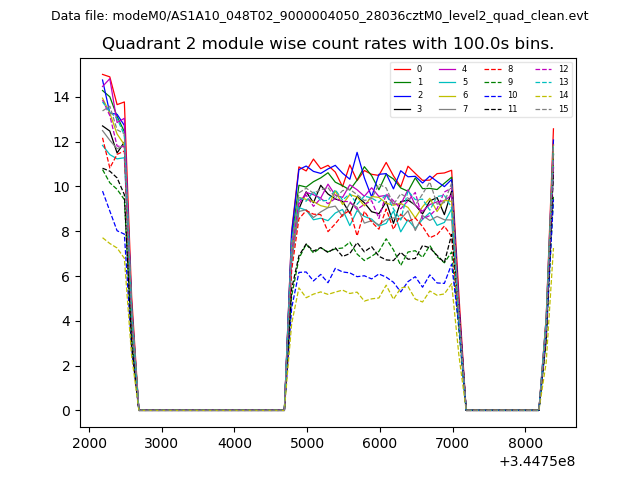
| Module-wise count rates for Quadrant B Data is divided into 100 sec bins |
 |
 |
| Module-wise count rates for Quadrant C Data is divided into 100 sec bins |
 |
 |
| Module-wise count rates for Quadrant D Data is divided into 100 sec bins |
 |
 |
| Parameter | Plot |
|---|---|
| CZT HV Monitor | 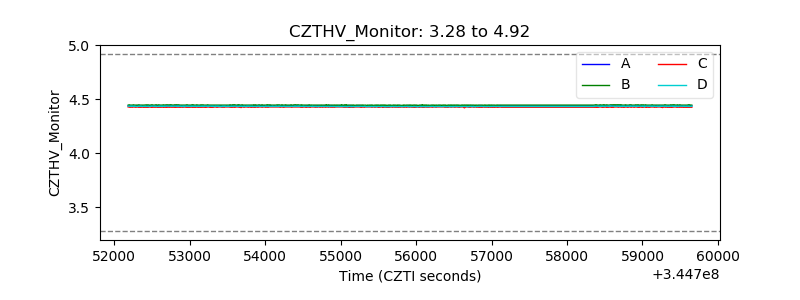 |
| D_VDD |  |
| Temperature 1 | 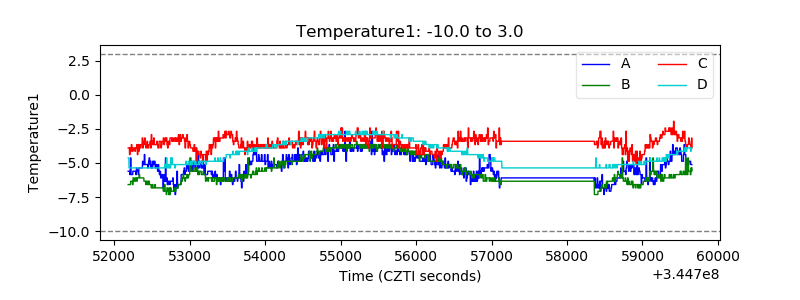 |
| Veto HV Monitor | 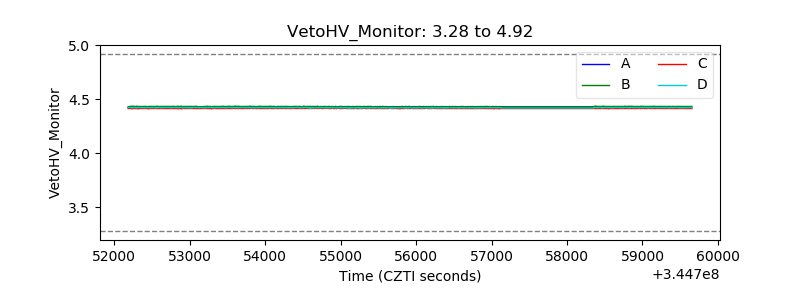 |
| Veto LLD | 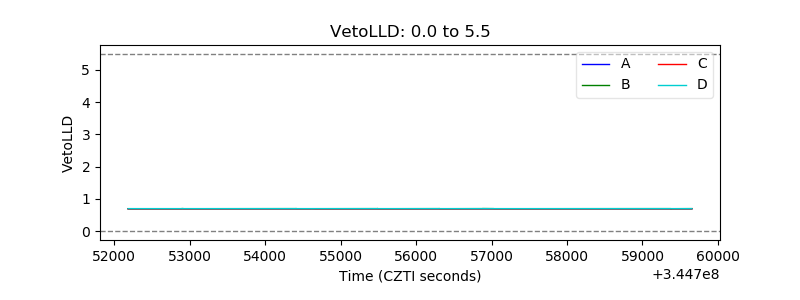 |
| Alpha Counter | 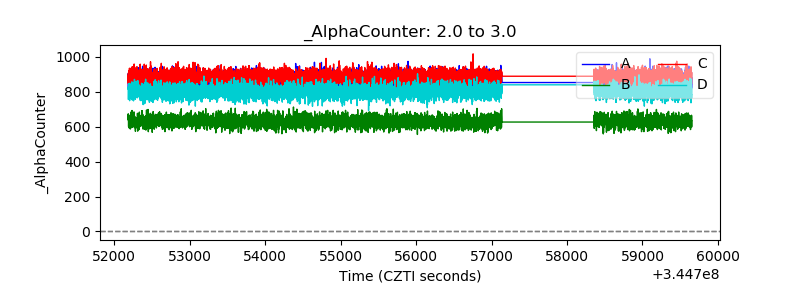 |
| _CPM_Rate | 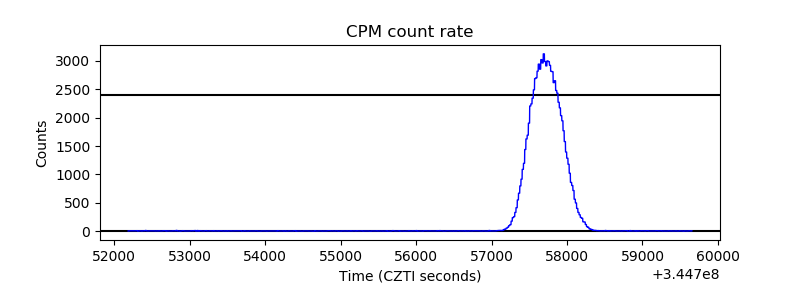 |
| CZT Counter | 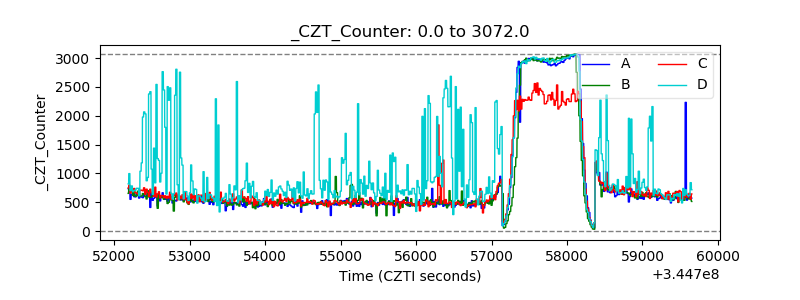 |
| +2.5 Volts monitor |  |
| +5 Volts monitor |  |
| _ROLL_ROT | 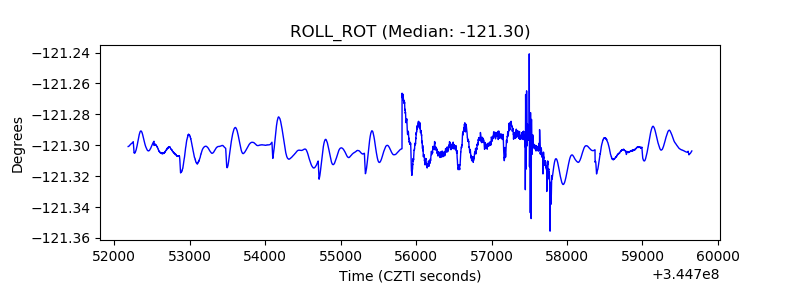 |
| _Roll_DEC | 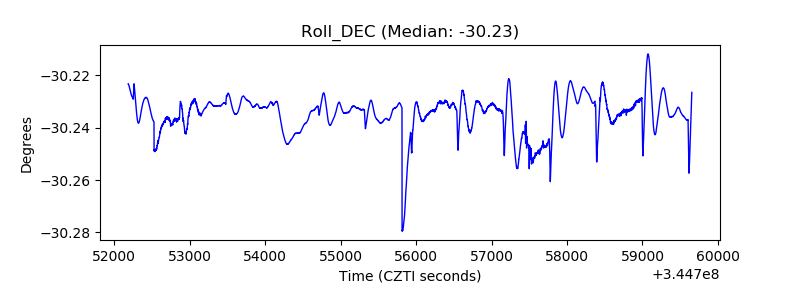 |
| _Roll_RA | 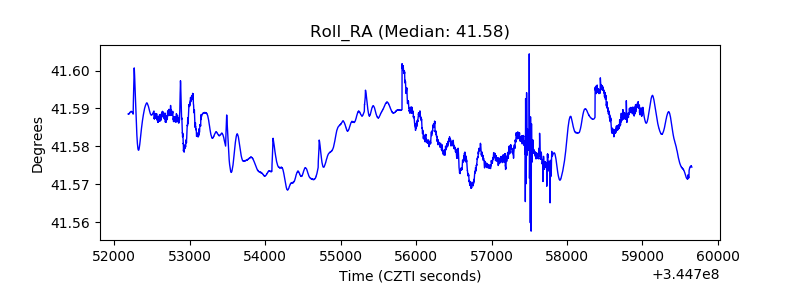 |
| Veto Counter | 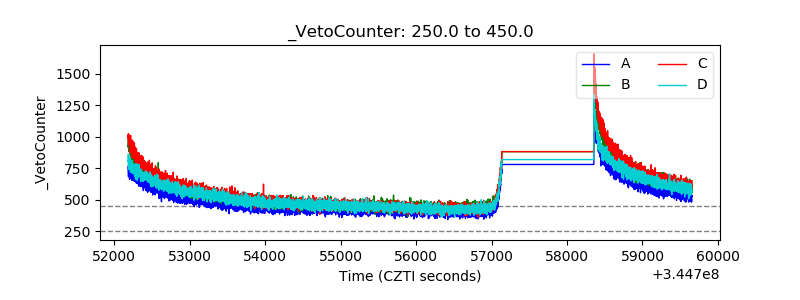 |