| Param | Original file | Final file |
|---|---|---|
| Filename | modeM0/AS1A10_048T02_9000004050_28037cztM0_level2.evt | modeM0/AS1A10_048T02_9000004050_28037cztM0_level2_quad_clean.evt |
| Size (bytes) | 575,573,760 | 69,526,080 |
| Size | 548.9 MB | 66.3 MB |
| Events in quadrant A | 3,554,247 | 426,137 |
| Events in quadrant B | 3,591,139 | 432,921 |
| Events in quadrant C | 3,746,501 | 413,425 |
| Events in quadrant D | 6,116,221 | 396,102 |
| Mode M0 | |||
|---|---|---|---|
| Quadrant | BADHDUFLAG | Total packets | Discarded packets |
| A | 0 | 14393 | 0 |
| B | 0 | 14606 | 0 |
| C | 0 | 15363 | 0 |
| D | 0 | 22744 | 0 |
| Mode M9 | |||
|---|---|---|---|
| Quadrant | BADHDUFLAG | Total packets | Discarded packets |
| A | 0 | 13 | 0 |
| B | 0 | 14 | 0 |
| C | 0 | 14 | 0 |
| D | 0 | 14 | 0 |
| Quadrant | Total seconds | Saturated seconds | Saturation percentage |
|---|---|---|---|
| A | 6249 | 107 | 1.712274% |
| B | 6249 | 121 | 1.936310% |
| C | 6249 | 194 | 3.104497% |
| D | 6249 | 629 | 10.065610% |
Noise dominated data is calculated using 1-second bins in cleaned event files. If a bin has >2000 counts, and if more than 50% of those come from <1% of pixels, then it is considered to be noise-dominated and hence unusable.
| Quadrant | # 1 sec bins | Bins with >0 counts | Bins with >2000 counts | High rate bins dominated by noise | Noise dominated (total time) | Noise dominated (detector-on time) | Marked lightcurve |
|---|---|---|---|---|---|---|---|
| A | 7574 | 6249 | 3 | 3 | 0.04% | 0.05% | 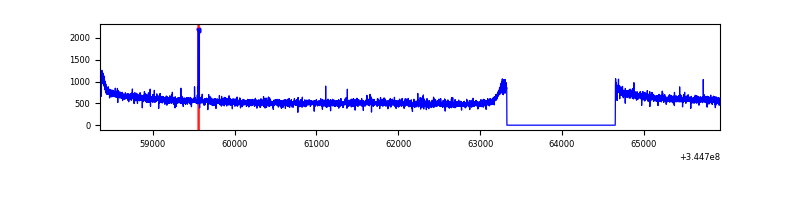 |
| B | 7574 | 6249 | 1 | 1 | 0.01% | 0.02% | 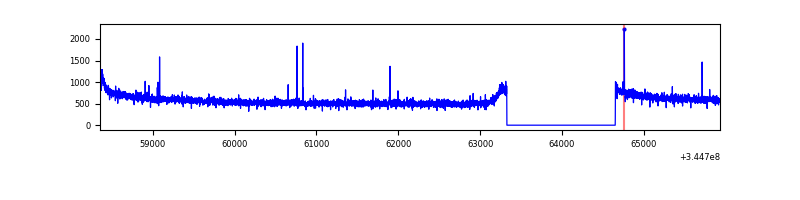 |
| C | 7574 | 6249 | 1 | 1 | 0.01% | 0.02% | 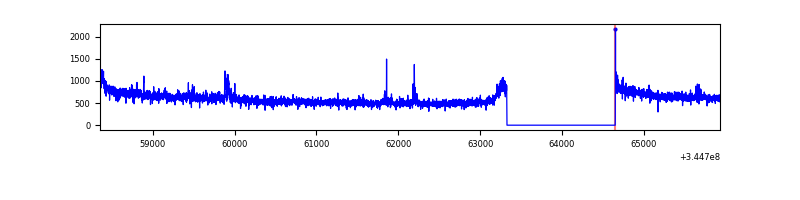 |
| D | 7574 | 6249 | 528 | 528 | 6.97% | 8.45% | 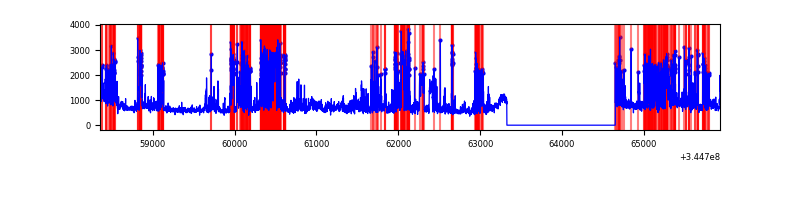 |
Top three noisy pixels from each quadrant. If the there are fewer than three noisy pixels in the level2.evt file, extra rows are filled as -1
| Pixel properties | Quadrant properties | ||||||
|---|---|---|---|---|---|---|---|
| Quadrant | DetID | PixID | Counts | Sigma | Mean | Median | Sigma |
| A | 0 | 13 | 15634 | 82.43 | 916 | 902 | 178.7 |
| A | 7 | 16 | 11053 | 56.79 | 916 | 902 | 178.7 |
| A | 13 | 254 | 9784 | 49.69 | 916 | 902 | 178.7 |
| B | 12 | 111 | 20171 | 113.68 | 915 | 896 | 169.6 |
| B | 11 | 111 | 17943 | 100.54 | 915 | 896 | 169.6 |
| B | 14 | 111 | 17736 | 99.32 | 915 | 896 | 169.6 |
| C | 14 | 238 | 146637 | 716.27 | 888 | 898 | 203.5 |
| C | 3 | 233 | 134369 | 655.98 | 888 | 898 | 203.5 |
| C | 10 | 22 | 8727 | 38.48 | 888 | 898 | 203.5 |
| D | 1 | 52 | 1819991 | 8948.32 | 870 | 851 | 203.3 |
| D | 8 | 195 | 1011872 | 4973.2 | 870 | 851 | 203.3 |
| D | 2 | 234 | 20709 | 97.68 | 870 | 851 | 203.3 |
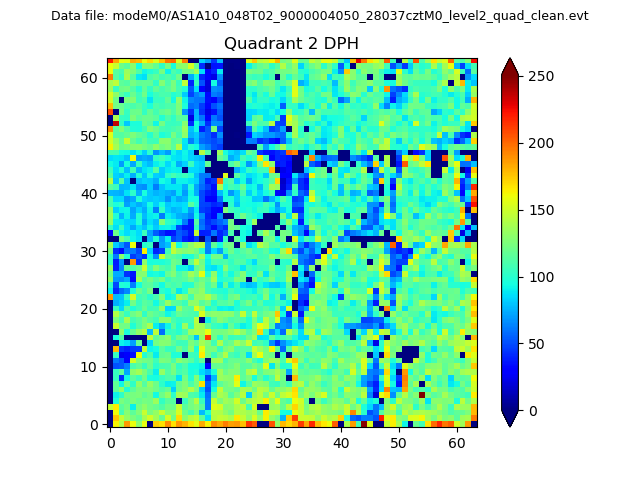
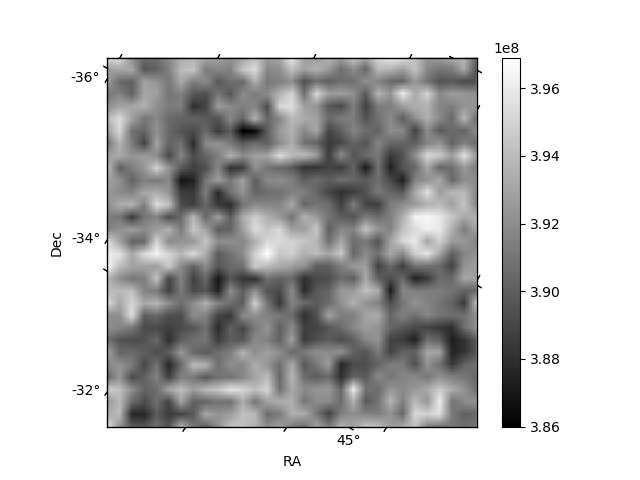
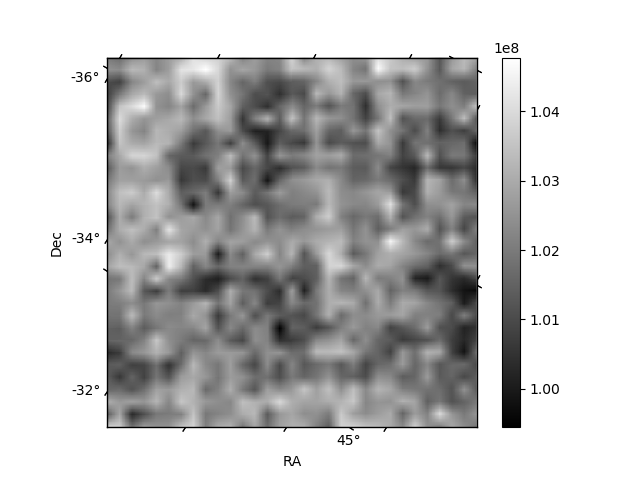
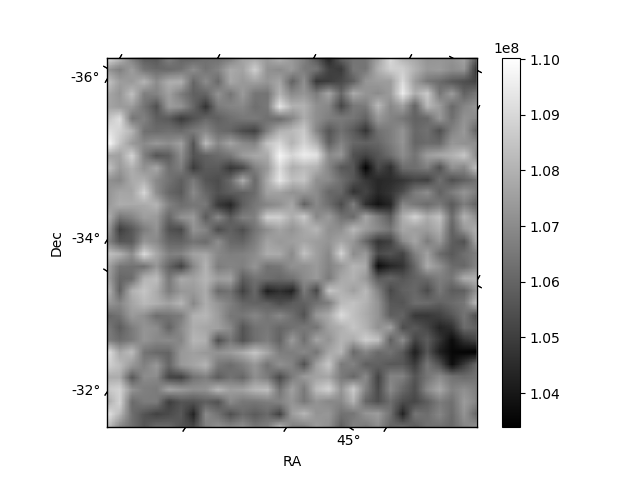
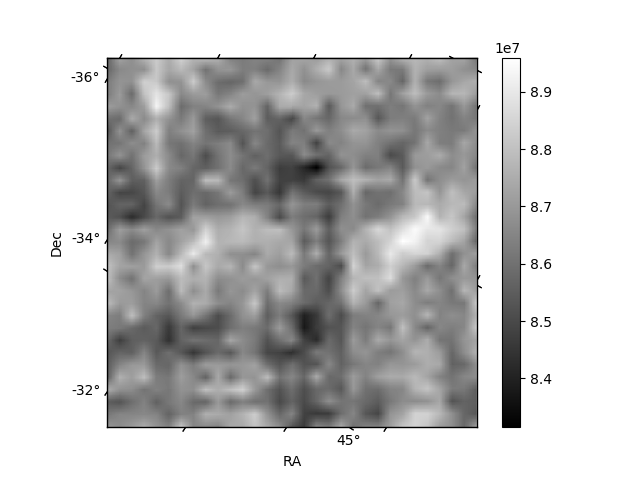
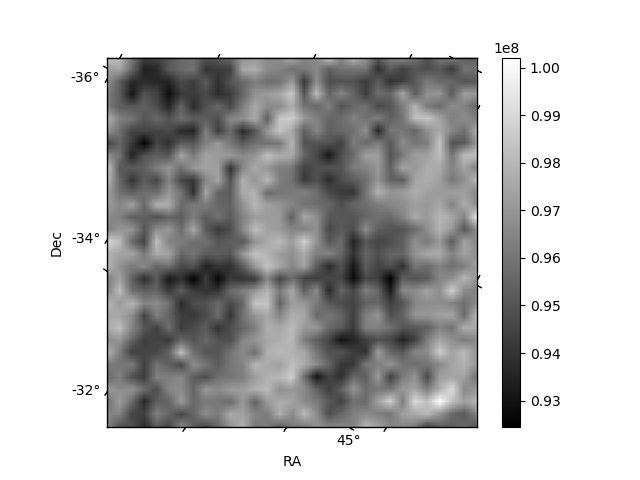
Histogram calculated using DETX and DETY for each event in the final _common_clean file
| Quadrant A | 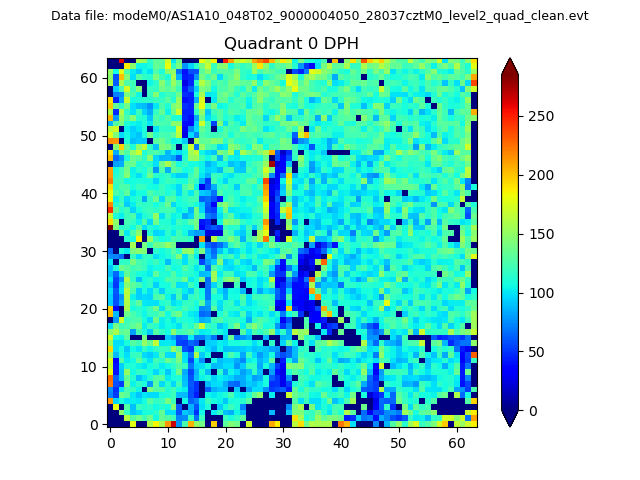 |
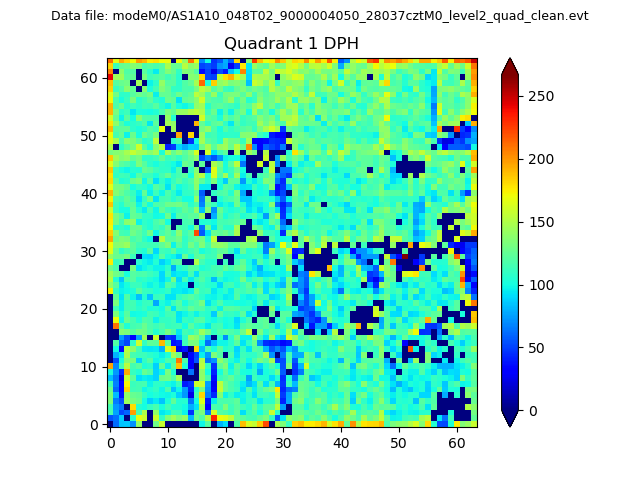 |
Quadrant B |
|---|---|---|---|
| Quadrant D | 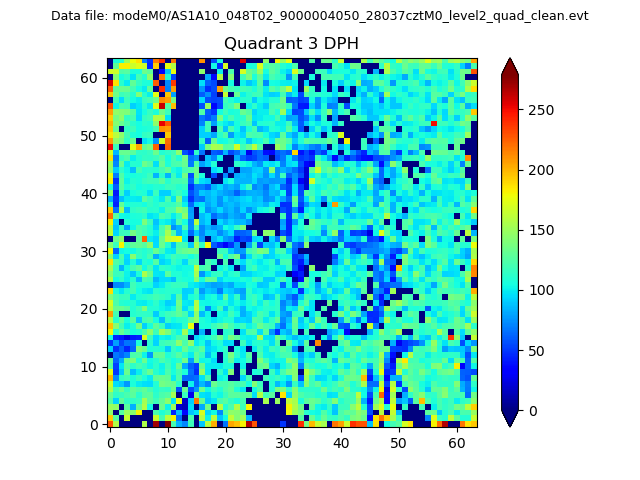 |
 |
Quadrant C |
| Plot type | Count rate plots | Images |
|---|---|---|
| Comparison with Poisson distribution Blue bars denote a histogram of data divided into 1 sec bins. Red curve is a Poisson curve with rate = median count rate of data. |
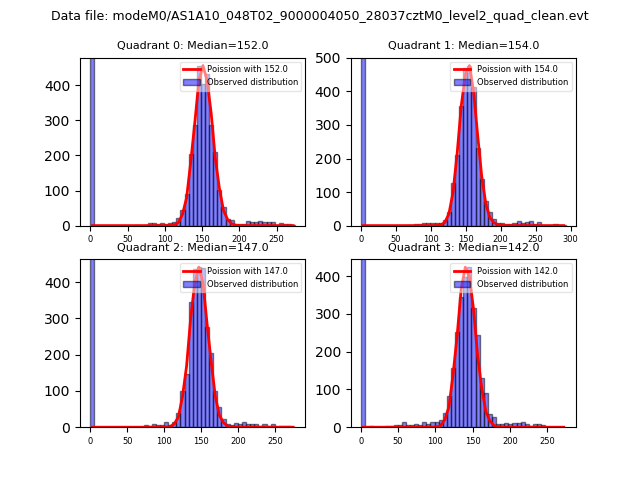 |
 |
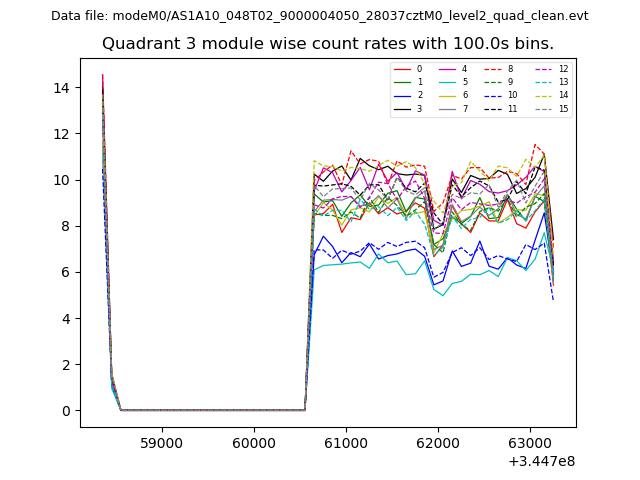
| Quadrant-wise count rates Data is divided into 100 sec bins |
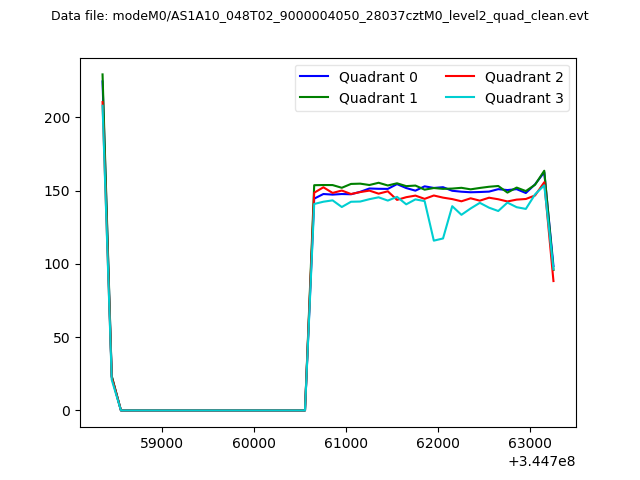 |
|
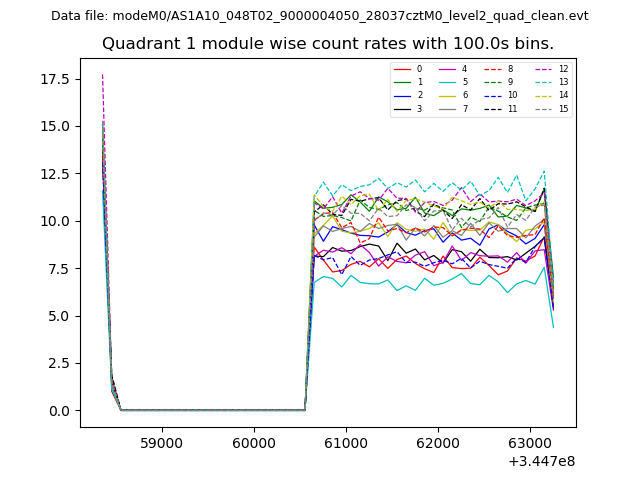
| Module-wise count rates for Quadrant A Data is divided into 100 sec bins |
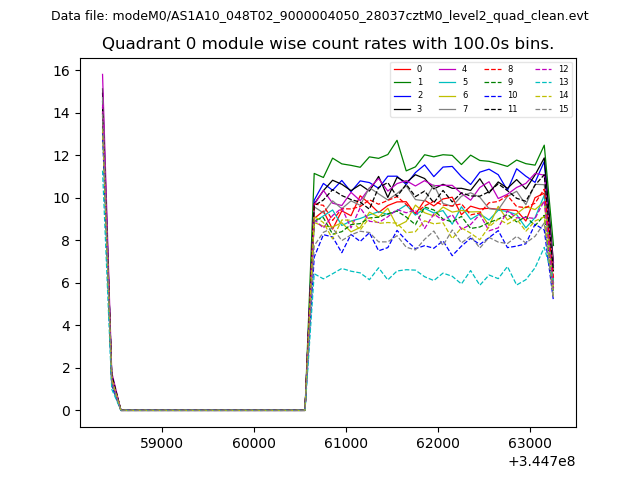 |
 |
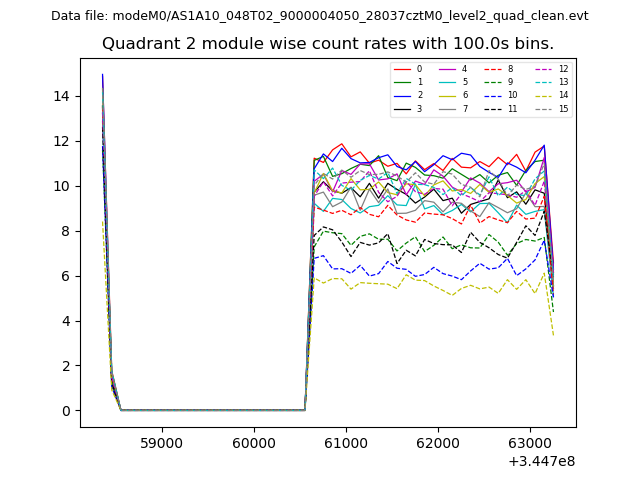
| Module-wise count rates for Quadrant B Data is divided into 100 sec bins |
 |
 |
| Module-wise count rates for Quadrant C Data is divided into 100 sec bins |
 |
 |
| Module-wise count rates for Quadrant D Data is divided into 100 sec bins |
 |
 |
| Parameter | Plot |
|---|---|
| CZT HV Monitor | 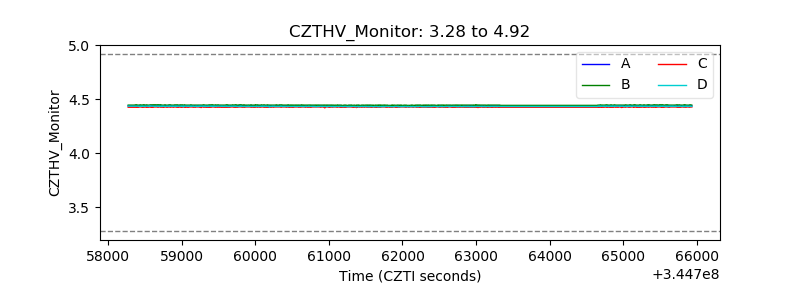 |
| D_VDD | 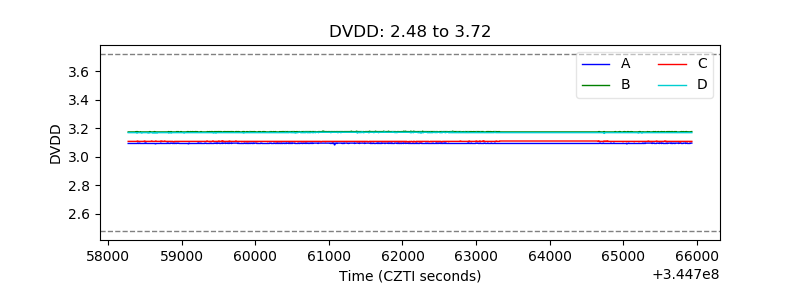 |
| Temperature 1 | 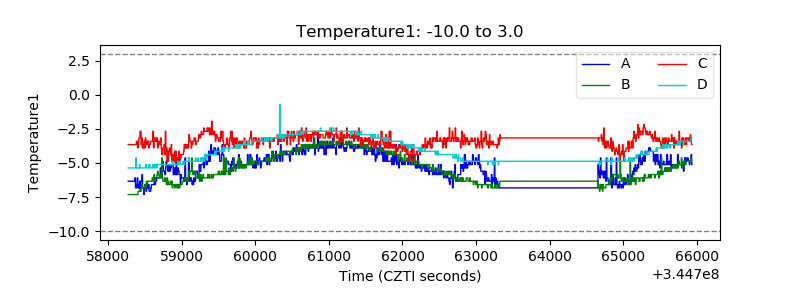 |
| Veto HV Monitor | 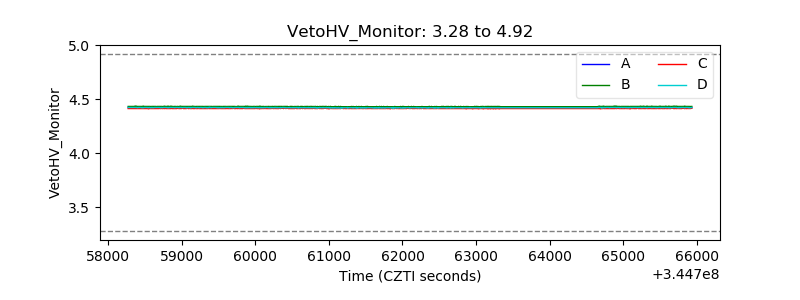 |
| Veto LLD | 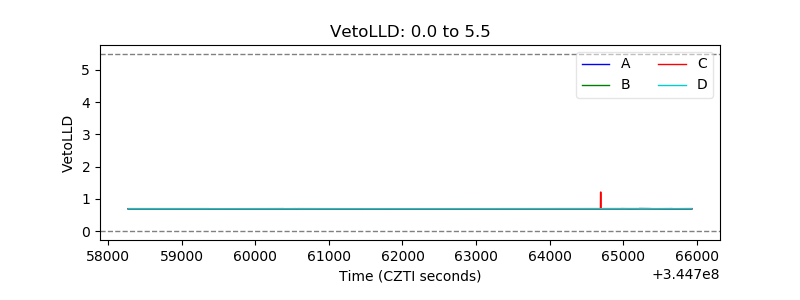 |
| Alpha Counter | 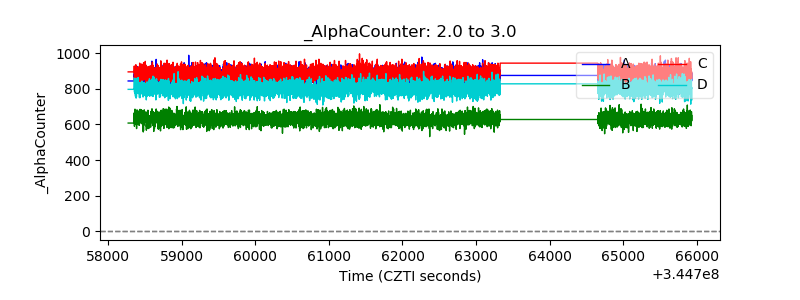 |
| _CPM_Rate | 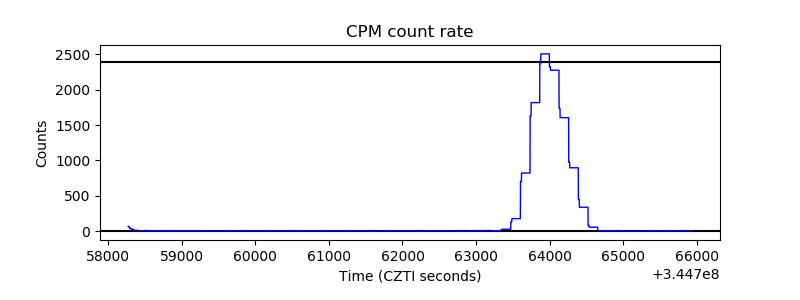 |
| CZT Counter | 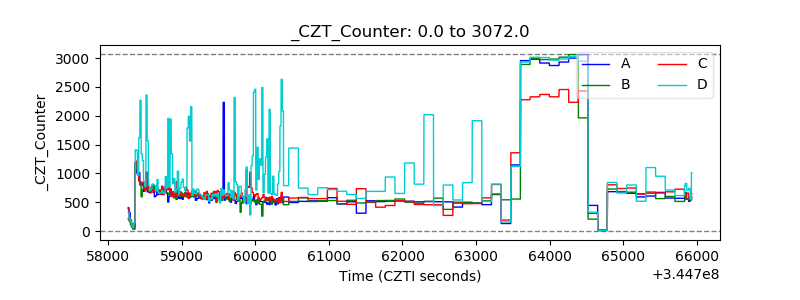 |
| +2.5 Volts monitor |  |
| +5 Volts monitor |  |
| _ROLL_ROT | 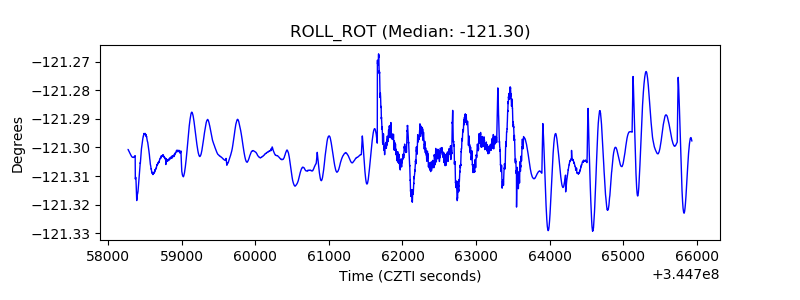 |
| _Roll_DEC | 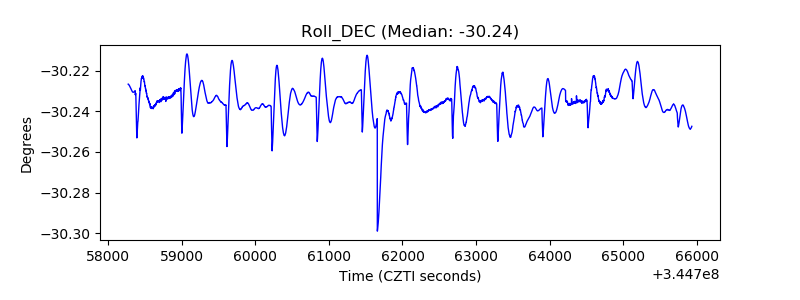 |
| _Roll_RA | 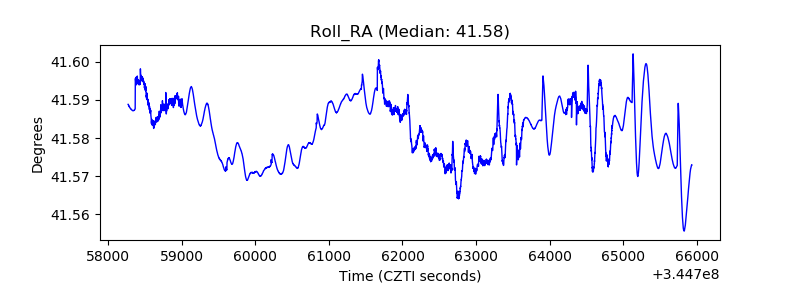 |
| Veto Counter | 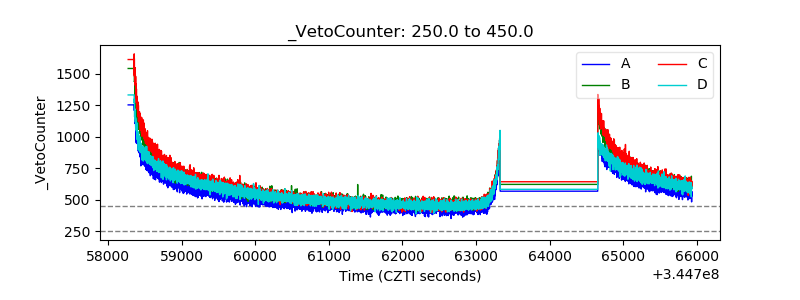 |