| Param | Original file | Final file |
|---|---|---|
| Filename | modeM0/AS1A10_048T02_9000004050_28038cztM0_level2.evt | modeM0/AS1A10_048T02_9000004050_28038cztM0_level2_quad_clean.evt |
| Size (bytes) | 554,273,280 | 74,695,680 |
| Size | 528.6 MB | 71.2 MB |
| Events in quadrant A | 3,541,274 | 470,208 |
| Events in quadrant B | 3,553,101 | 475,257 |
| Events in quadrant C | 3,674,259 | 450,959 |
| Events in quadrant D | 5,597,939 | 432,529 |
| Mode M0 | |||
|---|---|---|---|
| Quadrant | BADHDUFLAG | Total packets | Discarded packets |
| A | 0 | 14432 | 0 |
| B | 0 | 14550 | 0 |
| C | 0 | 15064 | 0 |
| D | 0 | 21166 | 0 |
| Mode M9 | |||
|---|---|---|---|
| Quadrant | BADHDUFLAG | Total packets | Discarded packets |
| A | 0 | 19 | 0 |
| B | 0 | 20 | 0 |
| C | 0 | 20 | 0 |
| D | 0 | 20 | 0 |
| Quadrant | Total seconds | Saturated seconds | Saturation percentage |
|---|---|---|---|
| A | 6191 | 73 | 1.179131% |
| B | 6191 | 80 | 1.292198% |
| C | 6191 | 150 | 2.422872% |
| D | 6191 | 374 | 6.041027% |
Noise dominated data is calculated using 1-second bins in cleaned event files. If a bin has >2000 counts, and if more than 50% of those come from <1% of pixels, then it is considered to be noise-dominated and hence unusable.
| Quadrant | # 1 sec bins | Bins with >0 counts | Bins with >2000 counts | High rate bins dominated by noise | Noise dominated (total time) | Noise dominated (detector-on time) | Marked lightcurve |
|---|---|---|---|---|---|---|---|
| A | 7551 | 6191 | 2 | 2 | 0.03% | 0.03% | 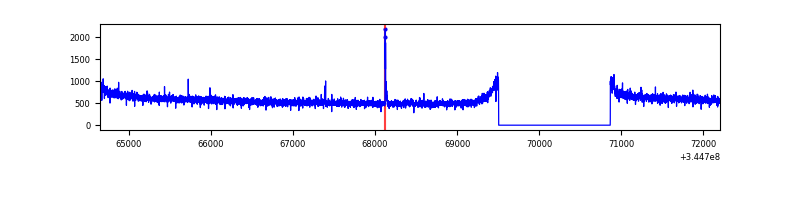 |
| B | 7551 | 6191 | 1 | 1 | 0.01% | 0.02% | 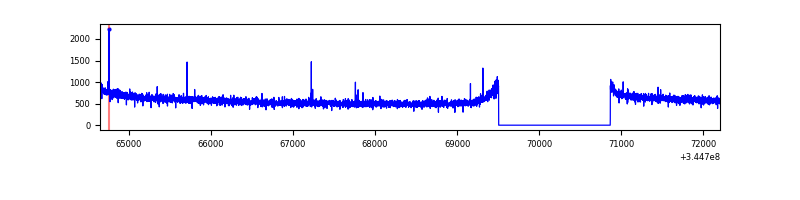 |
| C | 7551 | 6191 | 2 | 2 | 0.03% | 0.03% | 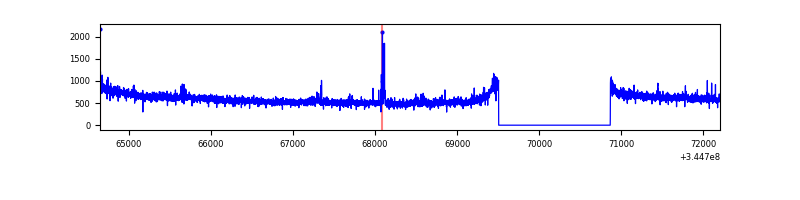 |
| D | 7551 | 6191 | 341 | 341 | 4.52% | 5.51% | 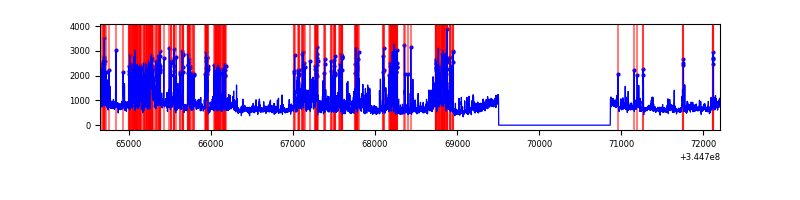 |
Top three noisy pixels from each quadrant. If the there are fewer than three noisy pixels in the level2.evt file, extra rows are filled as -1
| Pixel properties | Quadrant properties | ||||||
|---|---|---|---|---|---|---|---|
| Quadrant | DetID | PixID | Counts | Sigma | Mean | Median | Sigma |
| A | 6 | 16 | 29865 | 163.51 | 909 | 897 | 177.2 |
| A | 13 | 254 | 9958 | 51.14 | 909 | 897 | 177.2 |
| A | 3 | 137 | 7853 | 39.26 | 909 | 897 | 177.2 |
| B | 12 | 111 | 19756 | 113.84 | 904 | 885 | 165.8 |
| B | 11 | 111 | 17875 | 102.49 | 904 | 885 | 165.8 |
| B | 14 | 111 | 17606 | 100.87 | 904 | 885 | 165.8 |
| C | 14 | 238 | 143248 | 712.49 | 874 | 883 | 199.8 |
| C | 3 | 233 | 104579 | 518.97 | 874 | 883 | 199.8 |
| C | 10 | 22 | 23721 | 114.3 | 874 | 883 | 199.8 |
| D | 1 | 52 | 1213451 | 6026.8 | 867 | 852 | 201.2 |
| D | 8 | 195 | 1100543 | 5465.63 | 867 | 852 | 201.2 |
| D | 2 | 234 | 22575 | 107.97 | 867 | 852 | 201.2 |
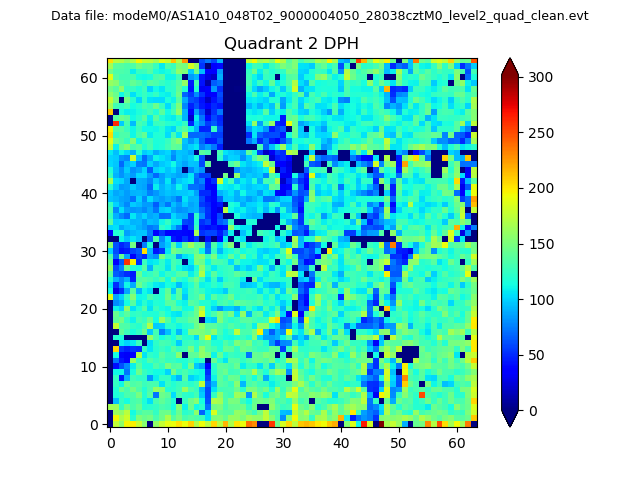
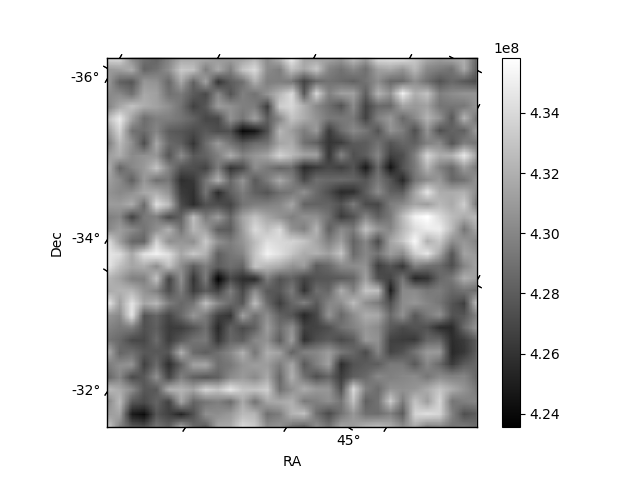
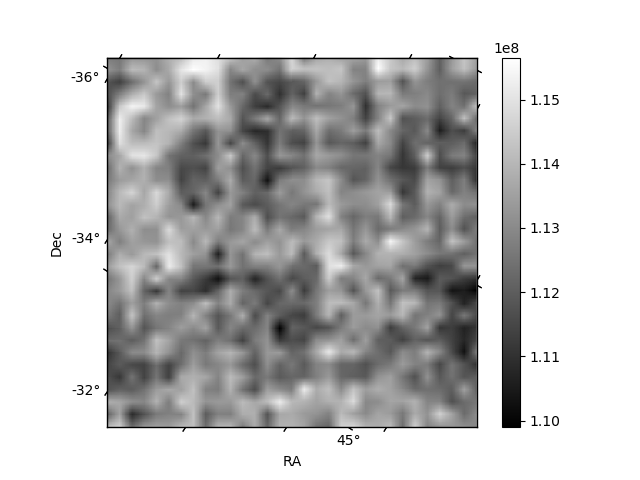
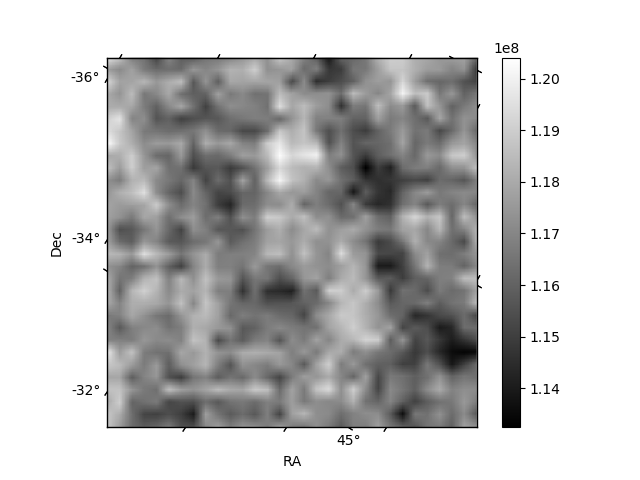
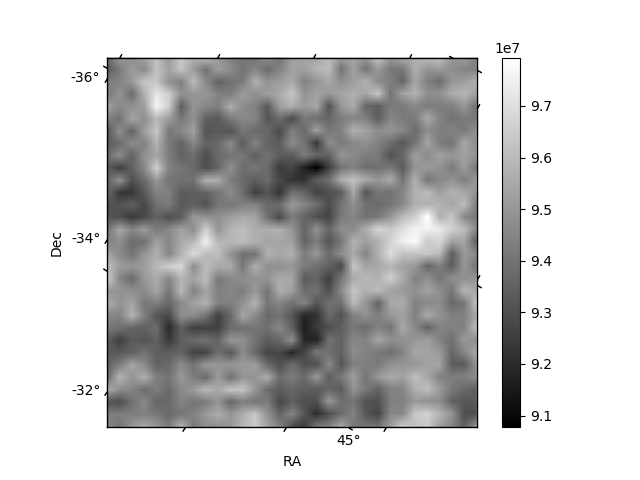
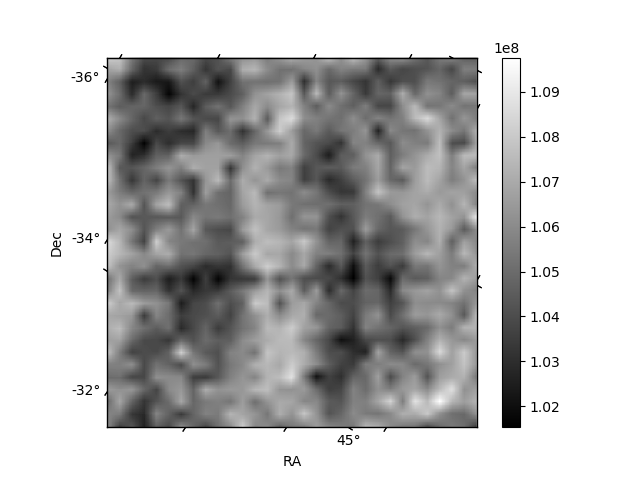
Histogram calculated using DETX and DETY for each event in the final _common_clean file
| Quadrant A | 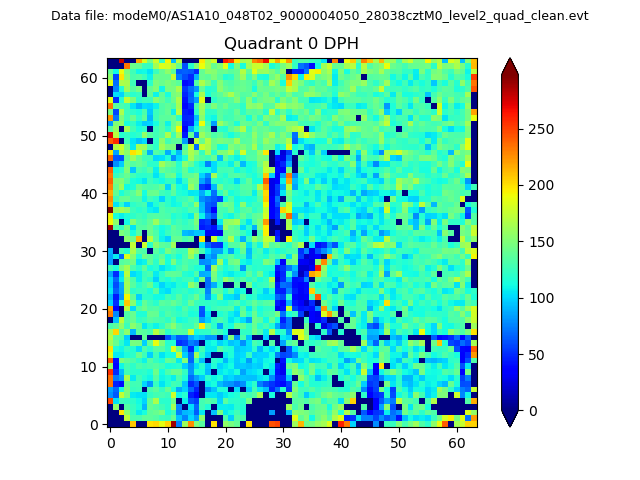 |
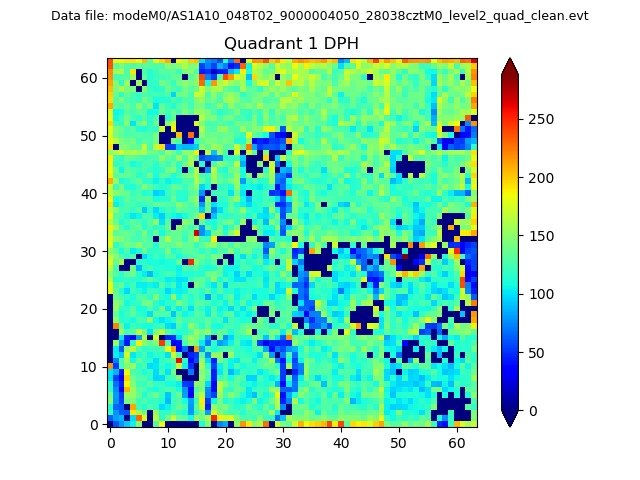 |
Quadrant B |
|---|---|---|---|
| Quadrant D | 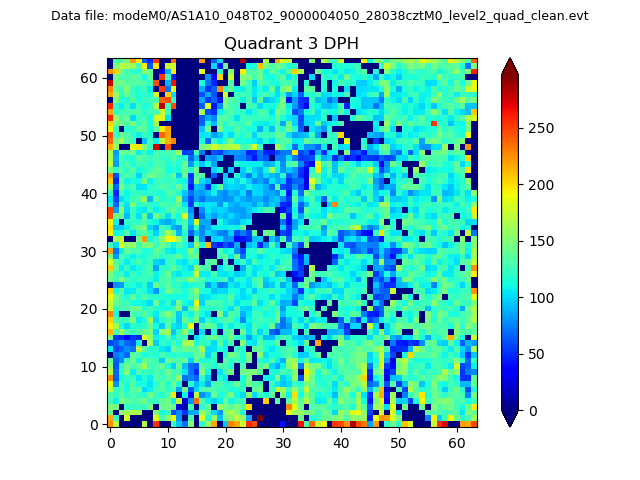 |
 |
Quadrant C |
| Plot type | Count rate plots | Images |
|---|---|---|
| Comparison with Poisson distribution Blue bars denote a histogram of data divided into 1 sec bins. Red curve is a Poisson curve with rate = median count rate of data. |
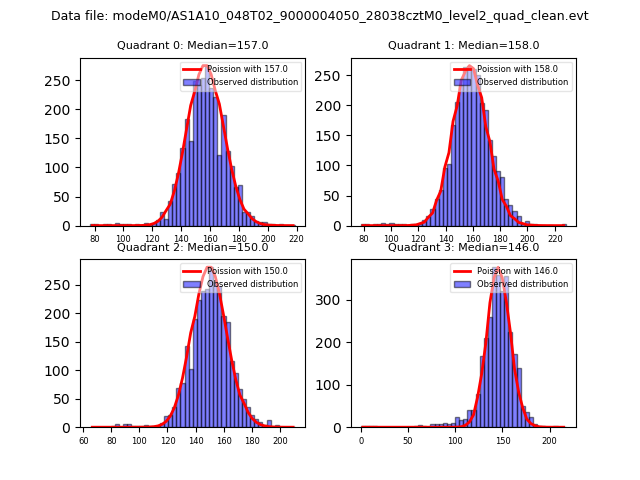 |
 |
| Quadrant-wise count rates Data is divided into 100 sec bins |
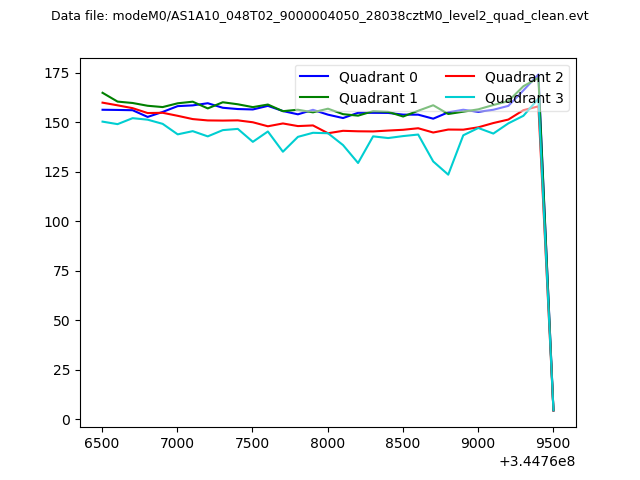 |
|
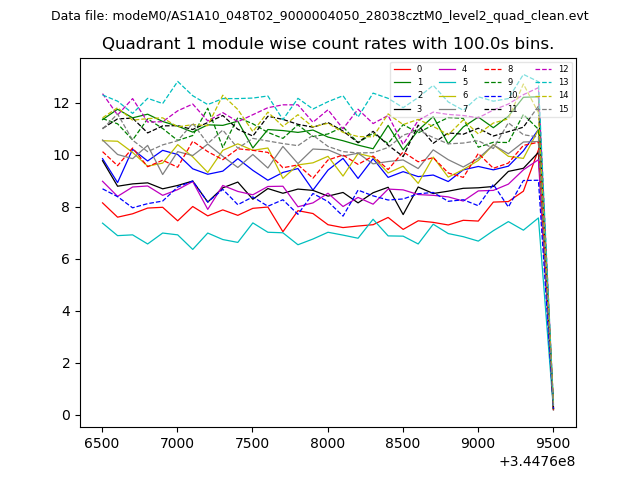
| Module-wise count rates for Quadrant A Data is divided into 100 sec bins |
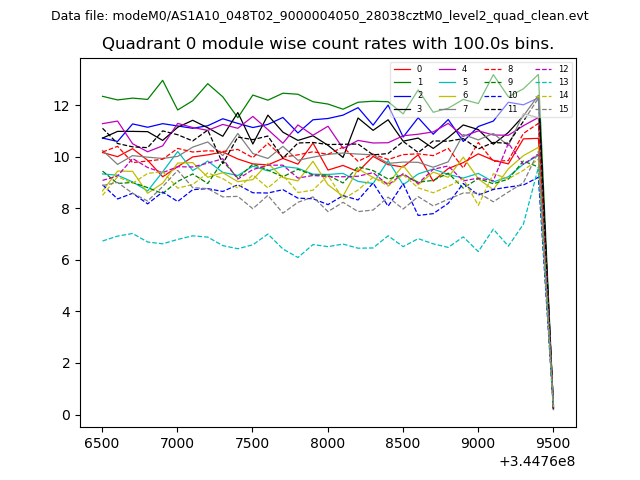 |
 |
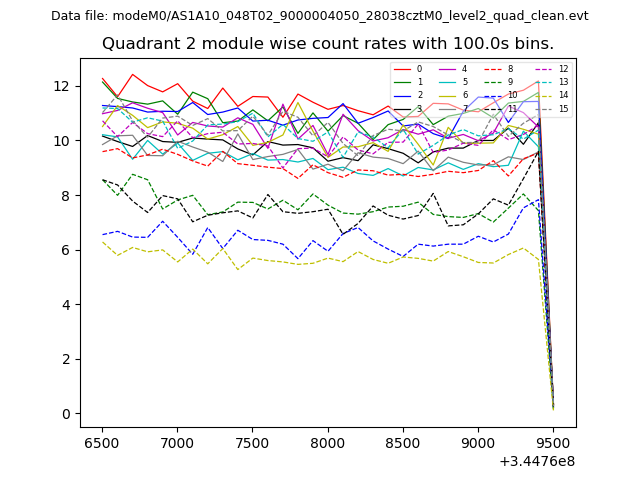
| Module-wise count rates for Quadrant B Data is divided into 100 sec bins |
 |
 |
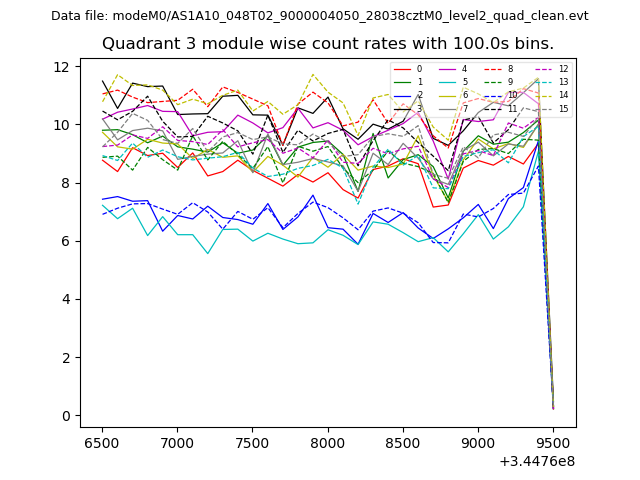
| Module-wise count rates for Quadrant C Data is divided into 100 sec bins |
 |
 |
| Module-wise count rates for Quadrant D Data is divided into 100 sec bins |
 |
 |
| Parameter | Plot |
|---|---|
| CZT HV Monitor | 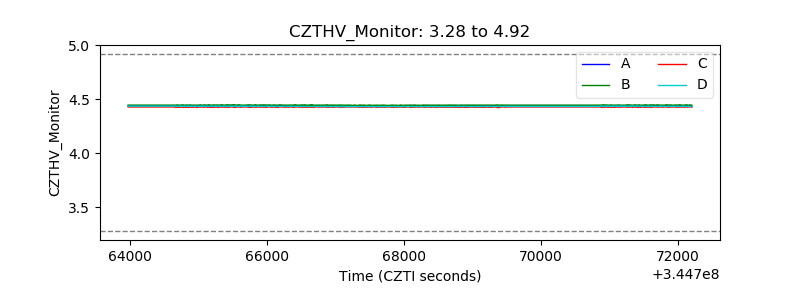 |
| D_VDD | 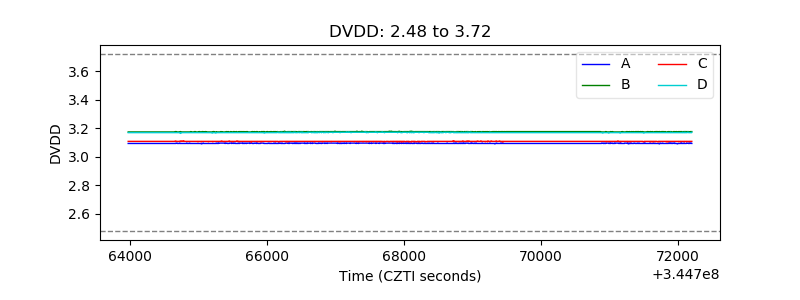 |
| Temperature 1 | 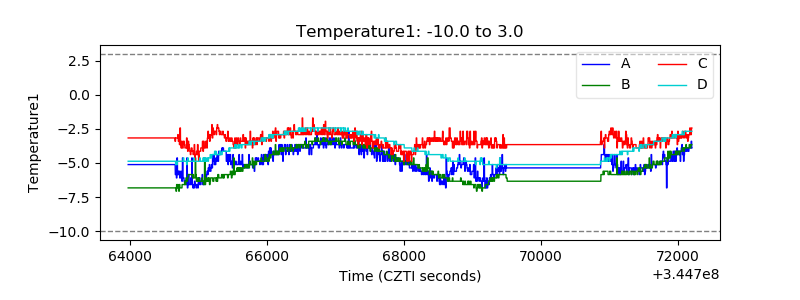 |
| Veto HV Monitor | 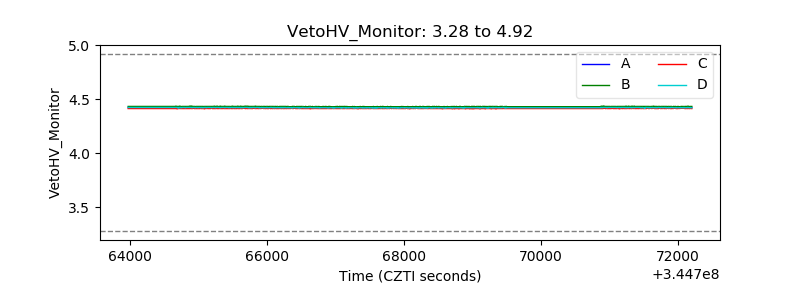 |
| Veto LLD | 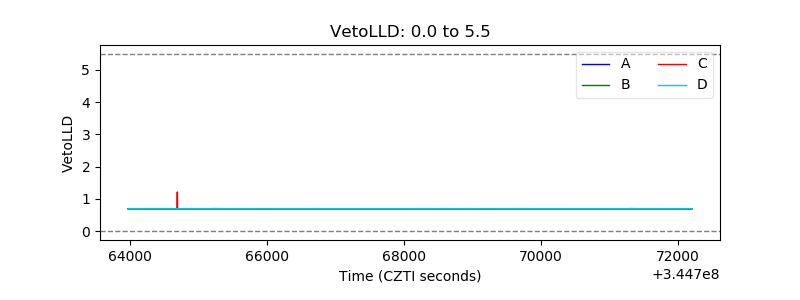 |
| Alpha Counter | 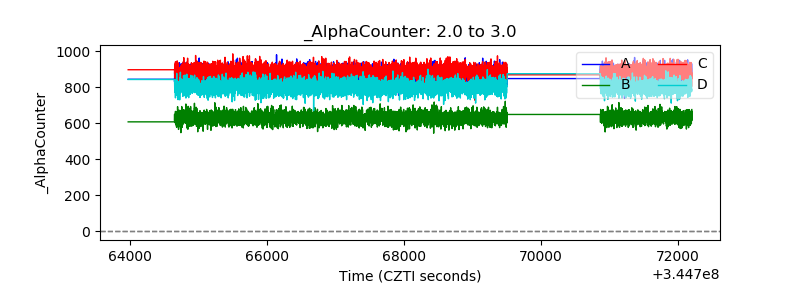 |
| _CPM_Rate | 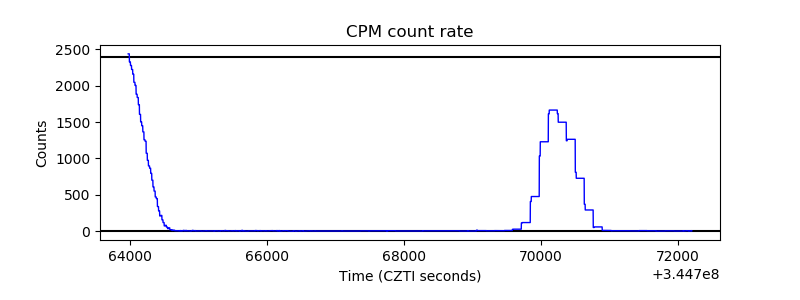 |
| CZT Counter | 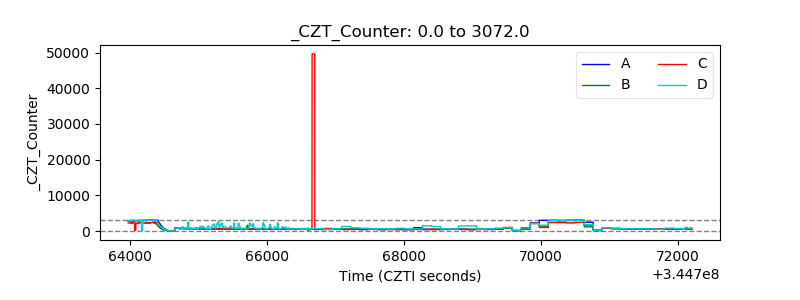 |
| +2.5 Volts monitor |  |
| +5 Volts monitor |  |
| _ROLL_ROT | 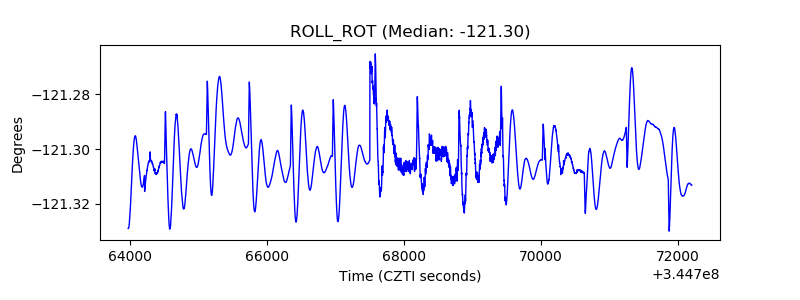 |
| _Roll_DEC |  |
| _Roll_RA | 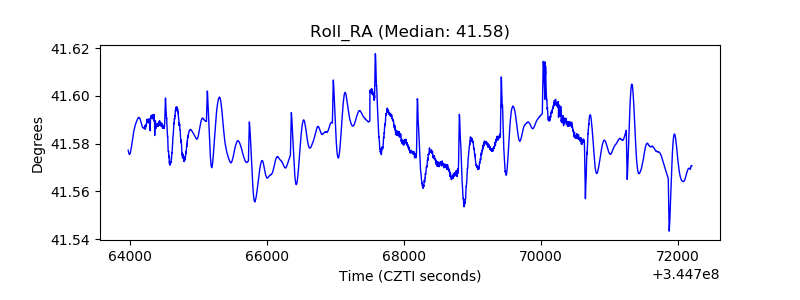 |
| Veto Counter | 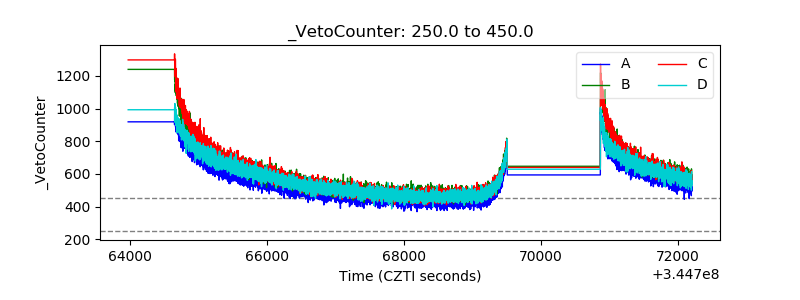 |