| Param | Original file | Final file |
|---|---|---|
| Filename | modeM0/AS1A10_048T02_9000004050_28039cztM0_level2.evt | modeM0/AS1A10_048T02_9000004050_28039cztM0_level2_quad_clean.evt |
| Size (bytes) | 529,326,720 | 89,225,280 |
| Size | 504.8 MB | 85.1 MB |
| Events in quadrant A | 3,496,719 | 580,862 |
| Events in quadrant B | 3,550,314 | 587,500 |
| Events in quadrant C | 3,637,988 | 554,511 |
| Events in quadrant D | 4,918,026 | 538,769 |
| Mode M0 | |||
|---|---|---|---|
| Quadrant | BADHDUFLAG | Total packets | Discarded packets |
| A | 0 | 14266 | 0 |
| B | 0 | 14458 | 0 |
| C | 0 | 15011 | 0 |
| D | 0 | 19227 | 0 |
| Mode M9 | |||
|---|---|---|---|
| Quadrant | BADHDUFLAG | Total packets | Discarded packets |
| A | 0 | 22 | 0 |
| B | 0 | 23 | 0 |
| C | 0 | 23 | 0 |
| D | 0 | 23 | 0 |
| Quadrant | Total seconds | Saturated seconds | Saturation percentage |
|---|---|---|---|
| A | 6311 | 117 | 1.853906% |
| B | 6311 | 132 | 2.091586% |
| C | 6311 | 169 | 2.677864% |
| D | 6311 | 250 | 3.961337% |
Noise dominated data is calculated using 1-second bins in cleaned event files. If a bin has >2000 counts, and if more than 50% of those come from <1% of pixels, then it is considered to be noise-dominated and hence unusable.
| Quadrant | # 1 sec bins | Bins with >0 counts | Bins with >2000 counts | High rate bins dominated by noise | Noise dominated (total time) | Noise dominated (detector-on time) | Marked lightcurve |
|---|---|---|---|---|---|---|---|
| A | 7591 | 6311 | 0 | 0 | 0.00% | 0.00% | 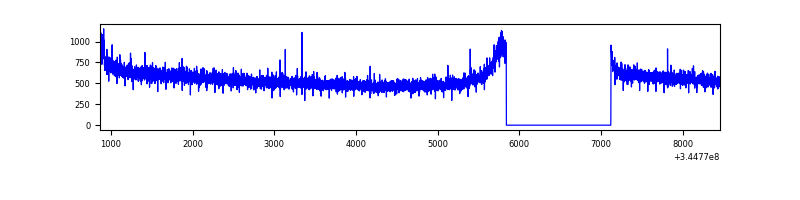 |
| B | 7591 | 6311 | 2 | 2 | 0.03% | 0.03% | 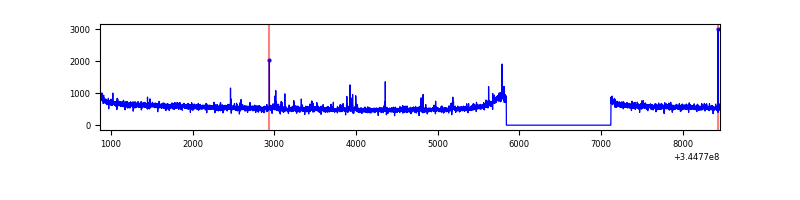 |
| C | 7591 | 6311 | 0 | 0 | 0.00% | 0.00% | 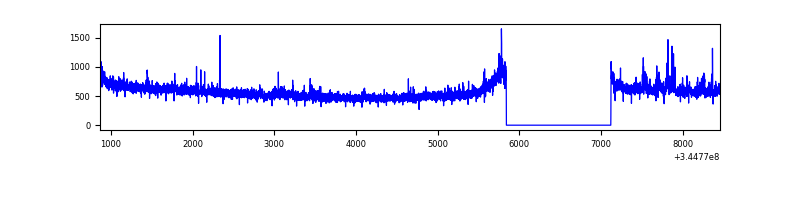 |
| D | 7591 | 6311 | 165 | 165 | 2.17% | 2.61% | 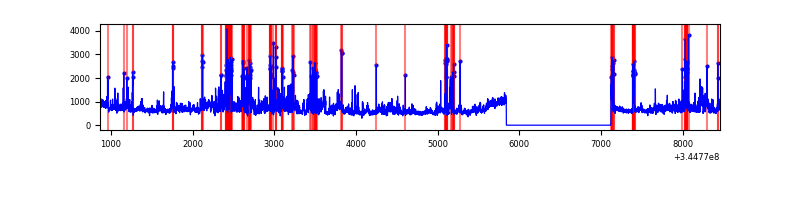 |
Top three noisy pixels from each quadrant. If the there are fewer than three noisy pixels in the level2.evt file, extra rows are filled as -1
| Pixel properties | Quadrant properties | ||||||
|---|---|---|---|---|---|---|---|
| Quadrant | DetID | PixID | Counts | Sigma | Mean | Median | Sigma |
| A | 13 | 254 | 10407 | 53.4 | 903 | 890 | 178.2 |
| A | 6 | 16 | 9495 | 48.29 | 903 | 890 | 178.2 |
| A | 3 | 137 | 8017 | 39.99 | 903 | 890 | 178.2 |
| B | 12 | 111 | 19807 | 113.79 | 893 | 875 | 166.4 |
| B | 11 | 111 | 17936 | 102.54 | 893 | 875 | 166.4 |
| B | 14 | 111 | 17694 | 101.09 | 893 | 875 | 166.4 |
| C | 3 | 233 | 159994 | 811.38 | 856 | 865 | 196.1 |
| C | 14 | 238 | 139470 | 706.73 | 856 | 865 | 196.1 |
| C | 13 | 61 | 5831 | 25.32 | 856 | 865 | 196.1 |
| D | 8 | 195 | 953199 | 4699.62 | 863 | 843 | 202.6 |
| D | 1 | 52 | 590773 | 2911.14 | 863 | 843 | 202.6 |
| D | 7 | 80 | 108860 | 533.03 | 863 | 843 | 202.6 |
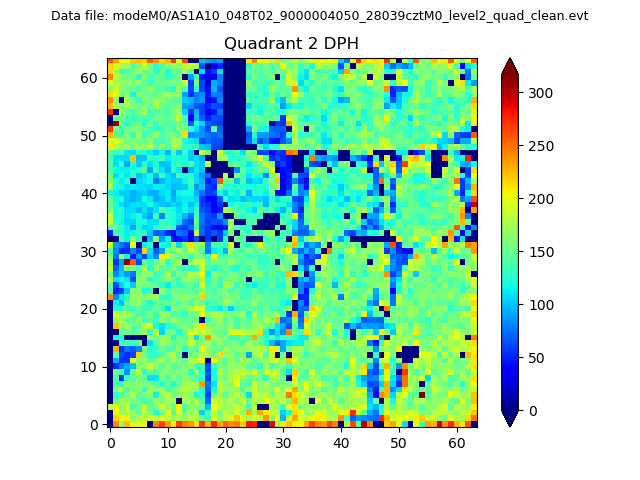
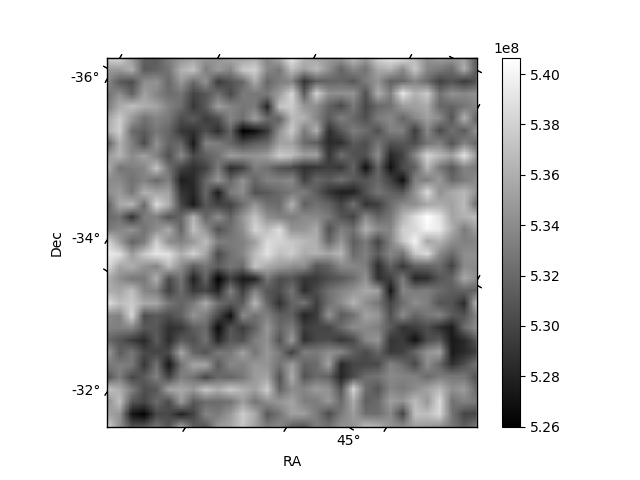
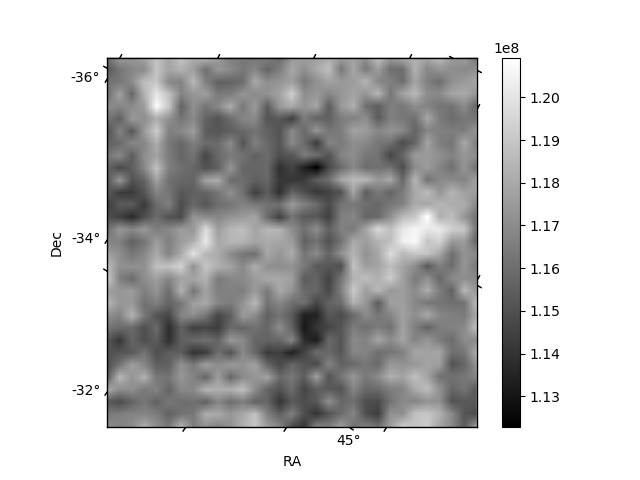
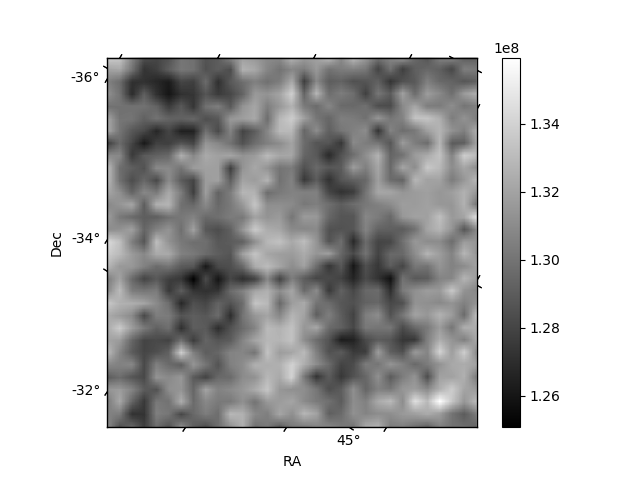
Histogram calculated using DETX and DETY for each event in the final _common_clean file
| Quadrant A | 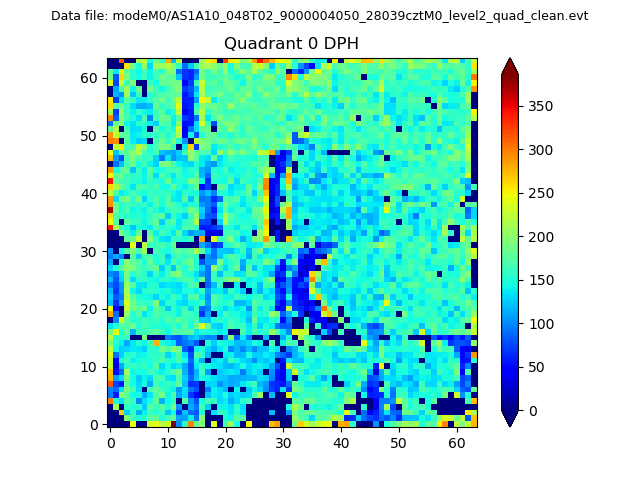 |
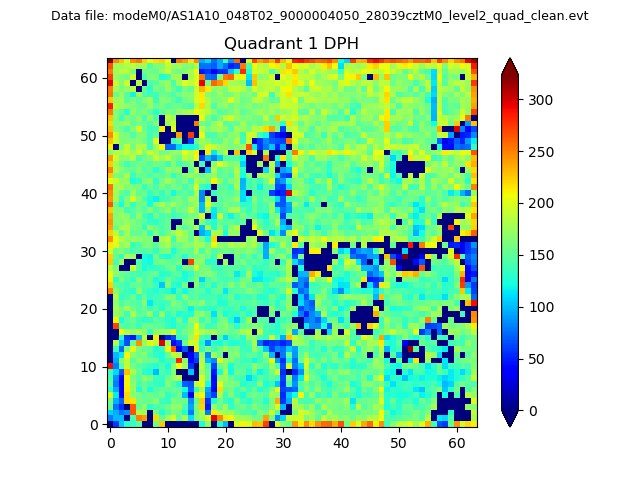 |
Quadrant B |
|---|---|---|---|
| Quadrant D | 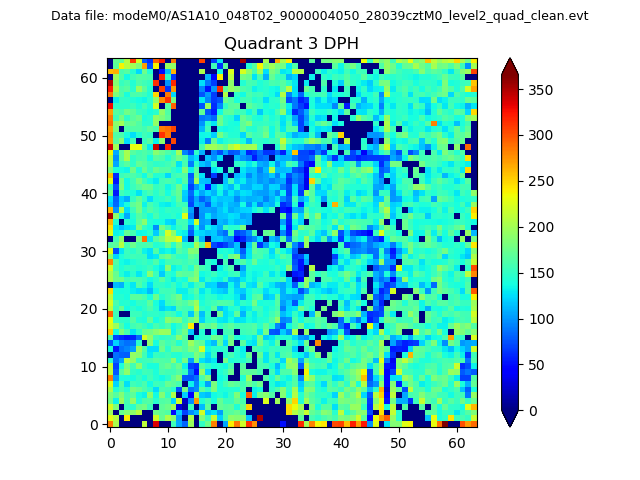 |
 |
Quadrant C |
| Plot type | Count rate plots | Images |
|---|---|---|
| Comparison with Poisson distribution Blue bars denote a histogram of data divided into 1 sec bins. Red curve is a Poisson curve with rate = median count rate of data. |
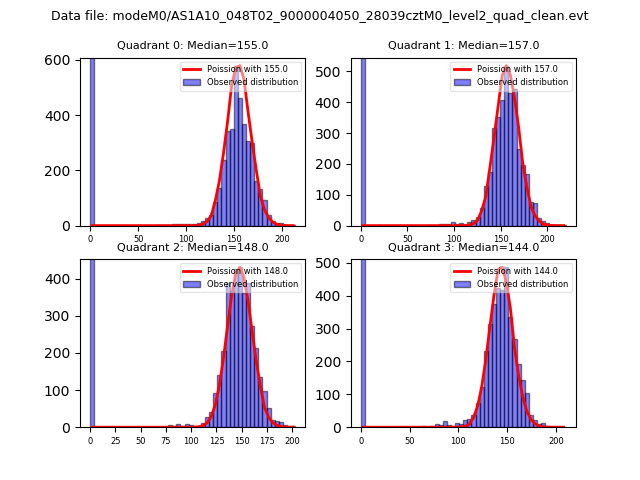 |
 |
| Quadrant-wise count rates Data is divided into 100 sec bins |
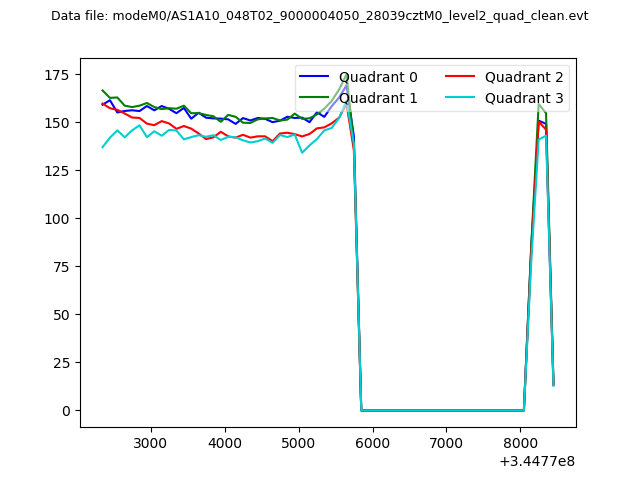 |
|
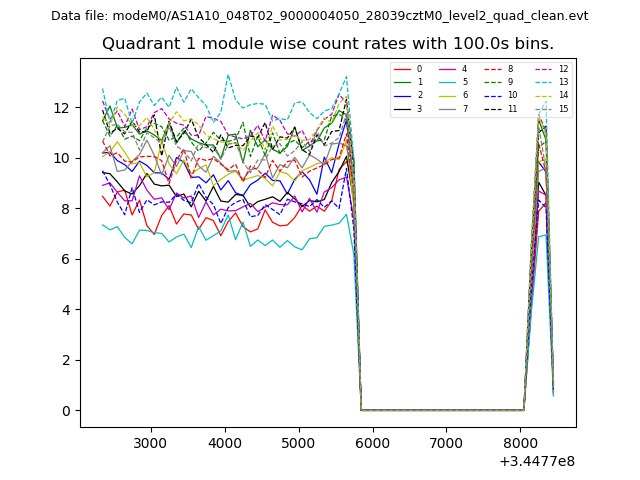
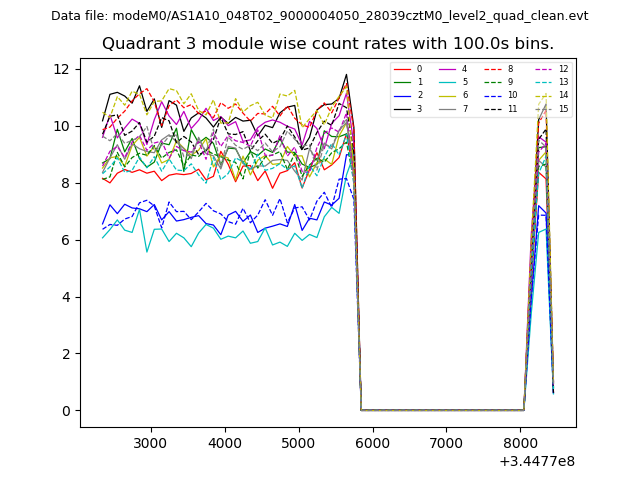
| Module-wise count rates for Quadrant A Data is divided into 100 sec bins |
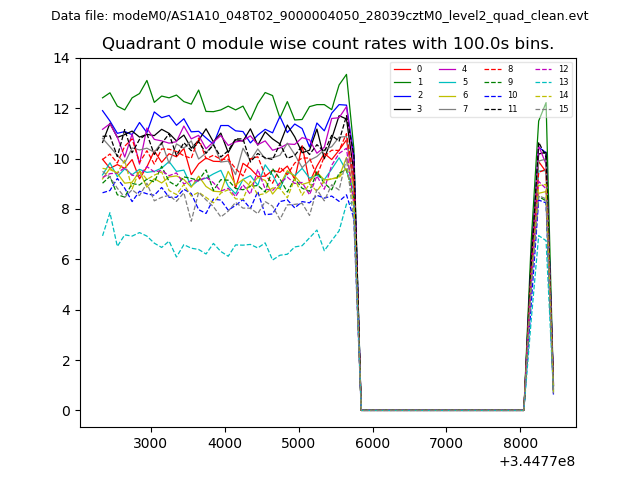 |
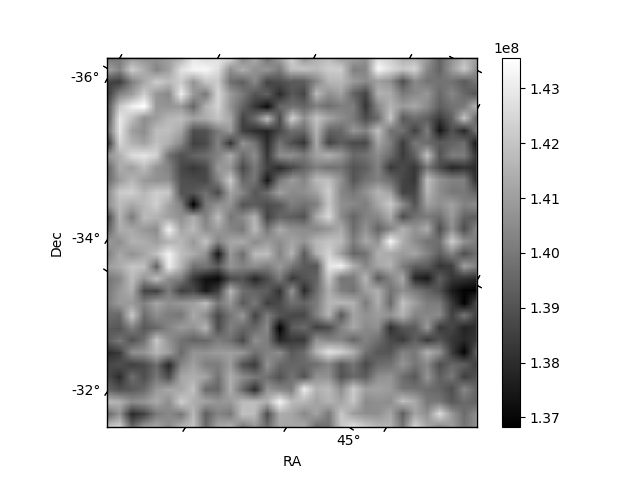 |
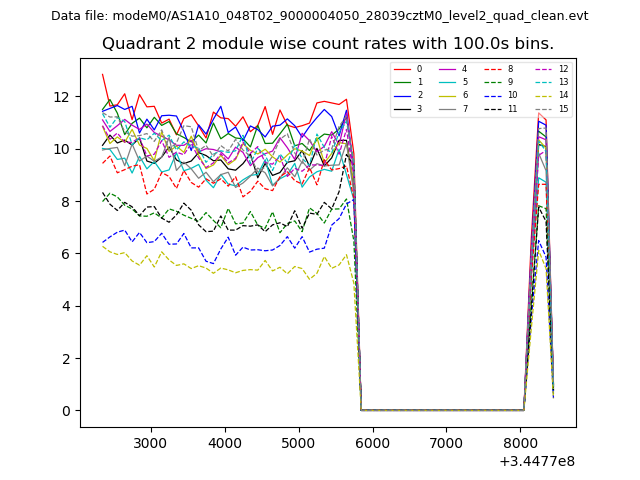
| Module-wise count rates for Quadrant B Data is divided into 100 sec bins |
 |
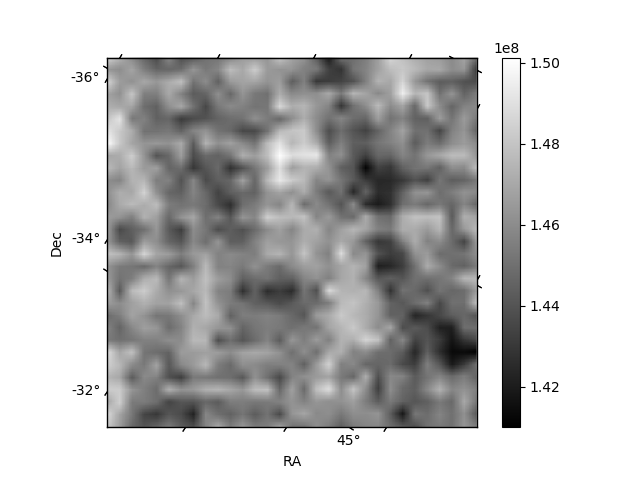 |
| Module-wise count rates for Quadrant C Data is divided into 100 sec bins |
 |
 |
| Module-wise count rates for Quadrant D Data is divided into 100 sec bins |
 |
 |
| Parameter | Plot |
|---|---|
| CZT HV Monitor | 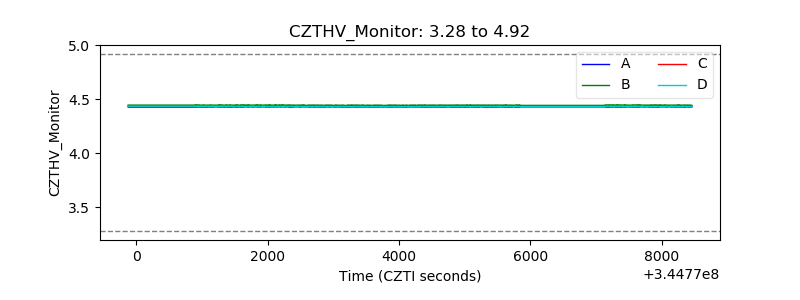 |
| D_VDD | 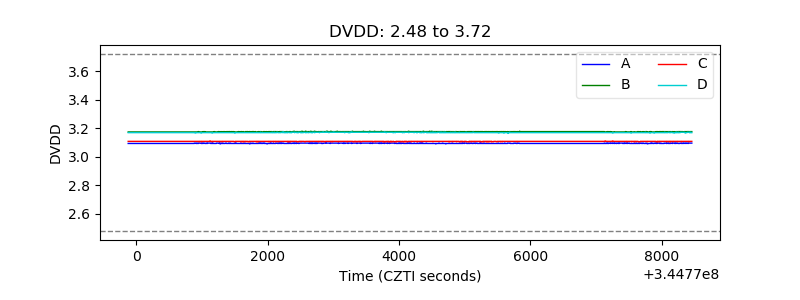 |
| Temperature 1 | 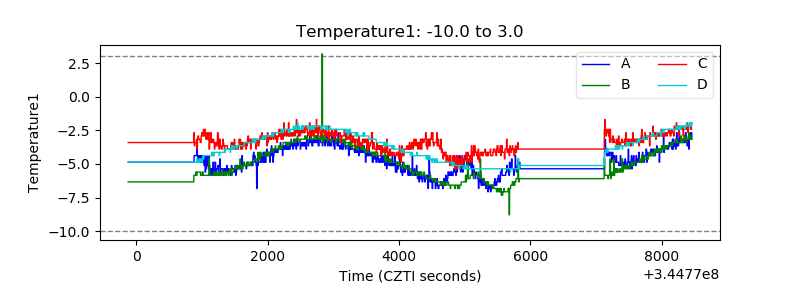 |
| Veto HV Monitor | 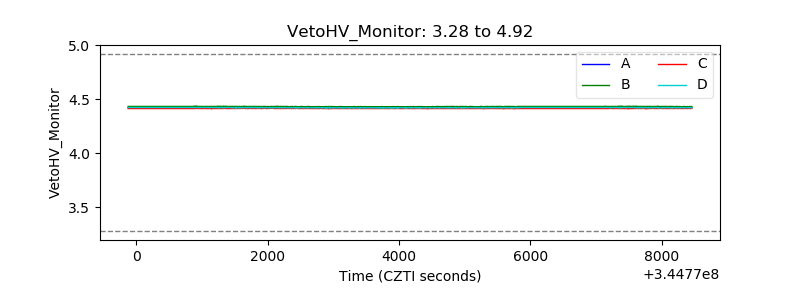 |
| Veto LLD | 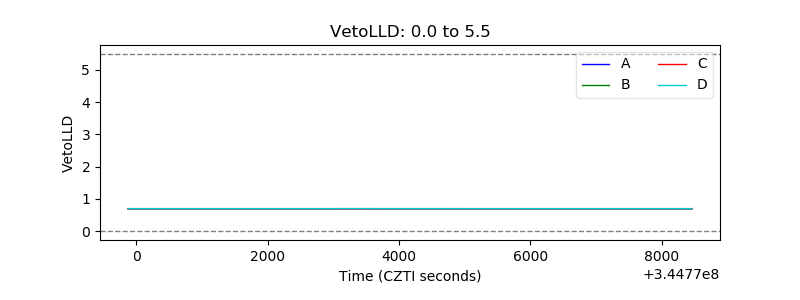 |
| Alpha Counter | 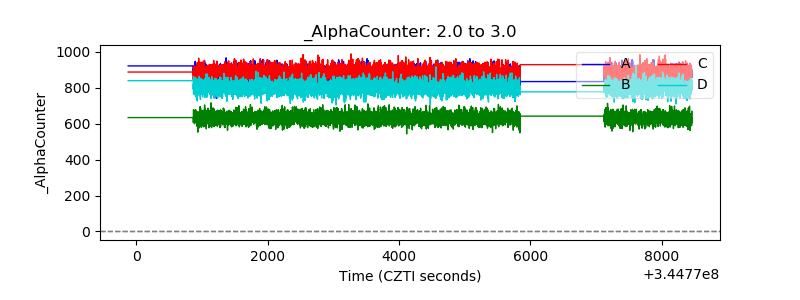 |
| _CPM_Rate | 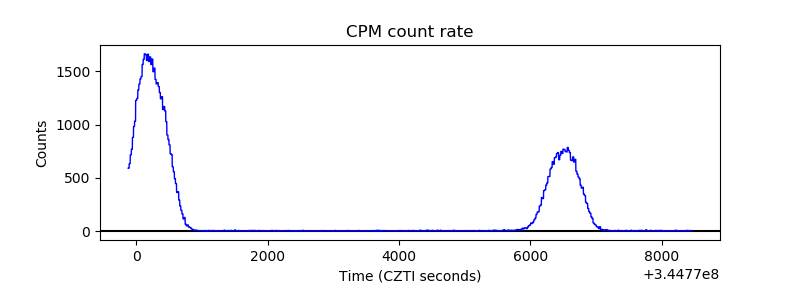 |
| CZT Counter | 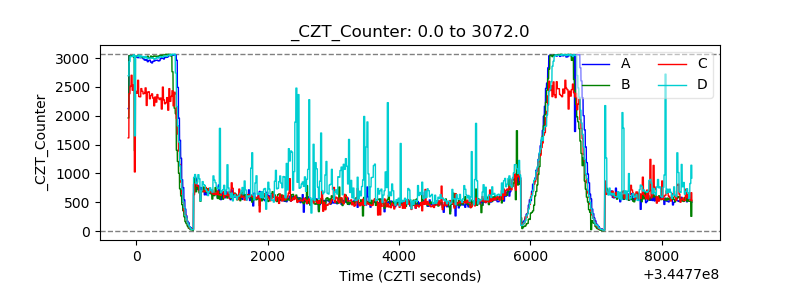 |
| +2.5 Volts monitor |  |
| +5 Volts monitor |  |
| _ROLL_ROT | 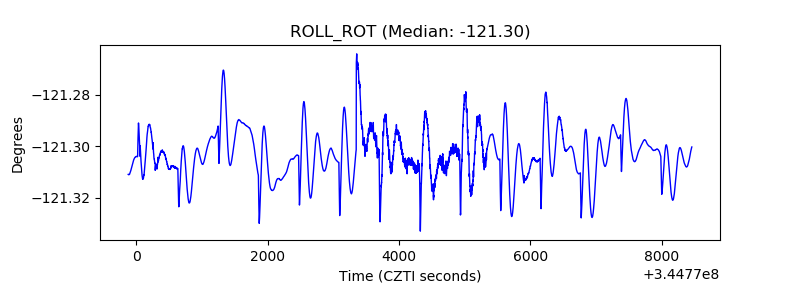 |
| _Roll_DEC |  |
| _Roll_RA | 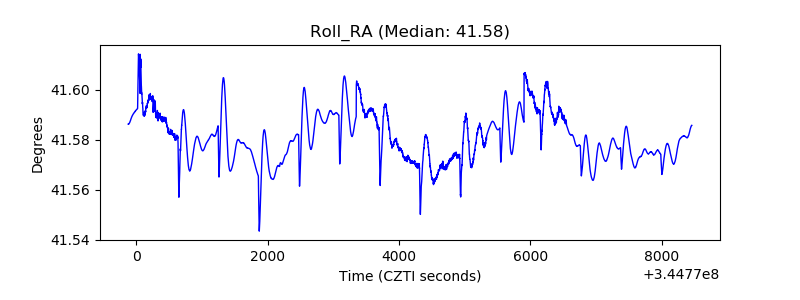 |
| Veto Counter | 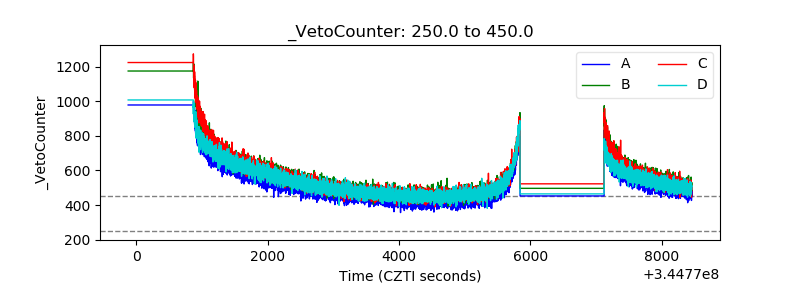 |