| Param | Original file | Final file |
|---|---|---|
| Filename | modeM0/AS1A10_048T02_9000004050_28040cztM0_level2.evt | modeM0/AS1A10_048T02_9000004050_28040cztM0_level2_quad_clean.evt |
| Size (bytes) | 524,047,680 | 96,710,400 |
| Size | 499.8 MB | 92.2 MB |
| Events in quadrant A | 3,407,435 | 637,924 |
| Events in quadrant B | 3,487,890 | 640,065 |
| Events in quadrant C | 3,719,023 | 603,421 |
| Events in quadrant D | 4,810,594 | 588,822 |
| Mode M0 | |||
|---|---|---|---|
| Quadrant | BADHDUFLAG | Total packets | Discarded packets |
| A | 0 | 14007 | 0 |
| B | 0 | 14253 | 0 |
| C | 0 | 15209 | 0 |
| D | 0 | 18899 | 0 |
| Mode M9 | |||
|---|---|---|---|
| Quadrant | BADHDUFLAG | Total packets | Discarded packets |
| A | 0 | 19 | 0 |
| B | 0 | 20 | 0 |
| C | 0 | 20 | 0 |
| D | 0 | 20 | 0 |
| Quadrant | Total seconds | Saturated seconds | Saturation percentage |
|---|---|---|---|
| A | 6575 | 96 | 1.460076% |
| B | 6575 | 105 | 1.596958% |
| C | 6575 | 157 | 2.387833% |
| D | 6574 | 244 | 3.711591% |
Noise dominated data is calculated using 1-second bins in cleaned event files. If a bin has >2000 counts, and if more than 50% of those come from <1% of pixels, then it is considered to be noise-dominated and hence unusable.
| Quadrant | # 1 sec bins | Bins with >0 counts | Bins with >2000 counts | High rate bins dominated by noise | Noise dominated (total time) | Noise dominated (detector-on time) | Marked lightcurve |
|---|---|---|---|---|---|---|---|
| A | 7630 | 6575 | 0 | 0 | 0.00% | 0.00% |  |
| B | 7630 | 6575 | 2 | 2 | 0.03% | 0.03% |  |
| C | 7630 | 6575 | 7 | 7 | 0.09% | 0.11% |  |
| D | 7629 | 6574 | 154 | 154 | 2.02% | 2.34% |  |
Top three noisy pixels from each quadrant. If the there are fewer than three noisy pixels in the level2.evt file, extra rows are filled as -1
| Pixel properties | Quadrant properties | ||||||
|---|---|---|---|---|---|---|---|
| Quadrant | DetID | PixID | Counts | Sigma | Mean | Median | Sigma |
| A | 13 | 254 | 10159 | 52.91 | 882 | 869 | 175.6 |
| A | 3 | 137 | 8220 | 41.86 | 882 | 869 | 175.6 |
| A | 0 | 226 | 7476 | 37.63 | 882 | 869 | 175.6 |
| B | 12 | 111 | 20320 | 119.09 | 871 | 853 | 163.5 |
| B | 11 | 111 | 18342 | 106.99 | 871 | 853 | 163.5 |
| B | 14 | 111 | 17697 | 103.04 | 871 | 853 | 163.5 |
| C | 3 | 233 | 336450 | 1731.28 | 832 | 840 | 193.9 |
| C | 14 | 238 | 136806 | 701.4 | 832 | 840 | 193.9 |
| C | 13 | 61 | 5544 | 24.27 | 832 | 840 | 193.9 |
| D | 8 | 195 | 996702 | 5007.87 | 839 | 819 | 198.9 |
| D | 1 | 52 | 535358 | 2687.97 | 839 | 819 | 198.9 |
| D | 7 | 80 | 63710 | 316.25 | 839 | 819 | 198.9 |
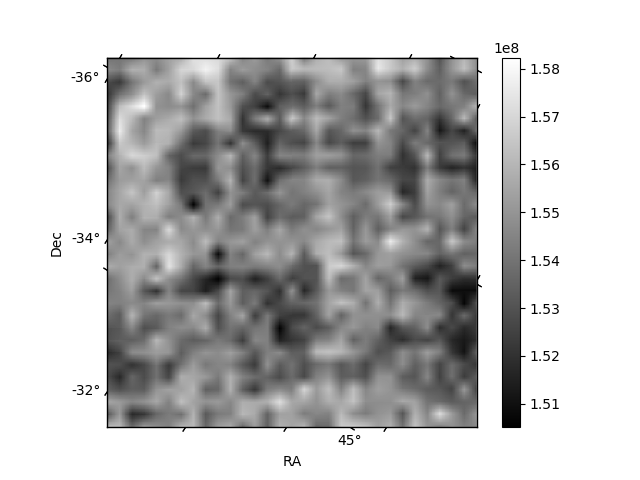
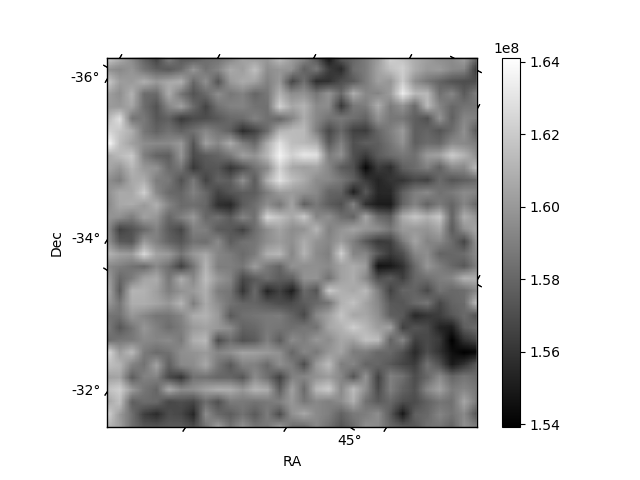
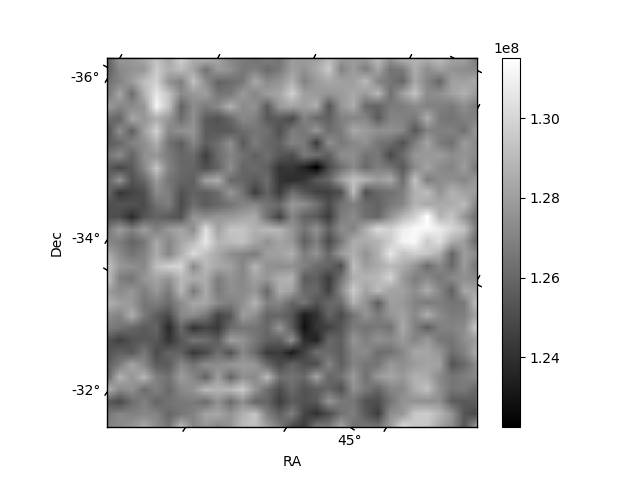
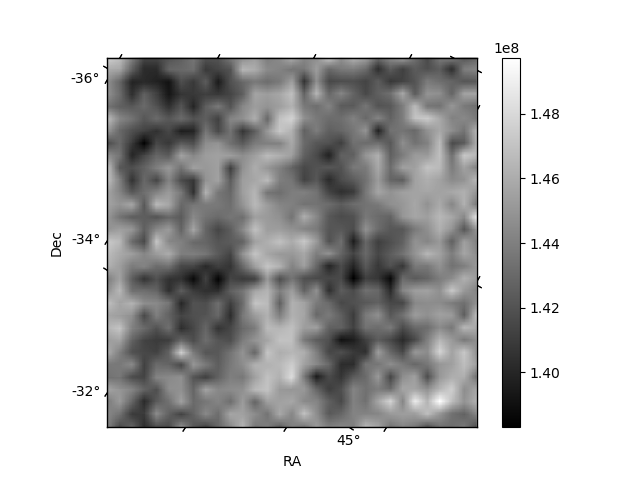
Histogram calculated using DETX and DETY for each event in the final _common_clean file
| Quadrant A | 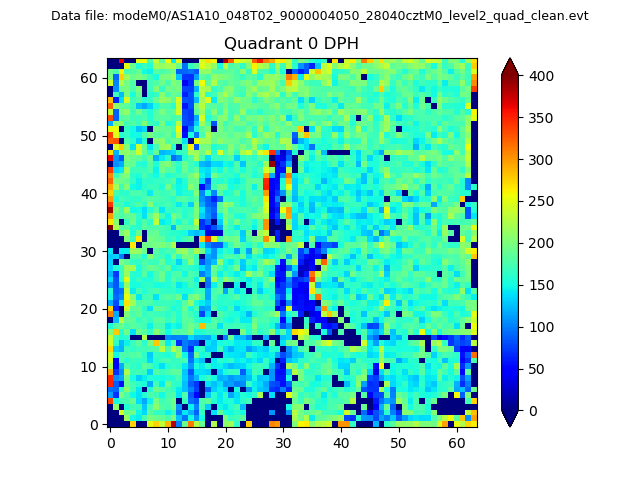 |
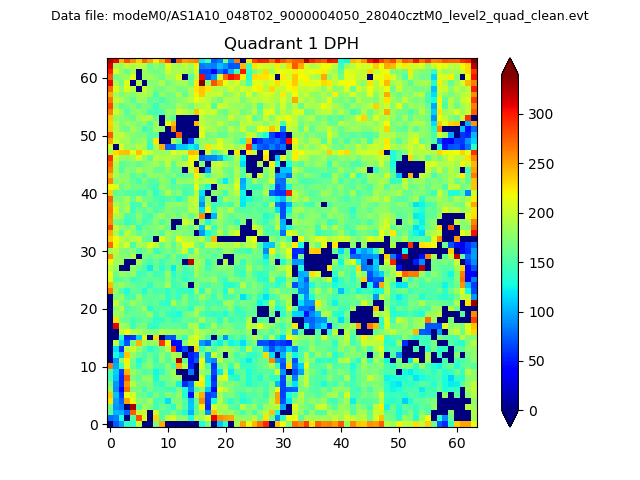 |
Quadrant B |
|---|---|---|---|
| Quadrant D | 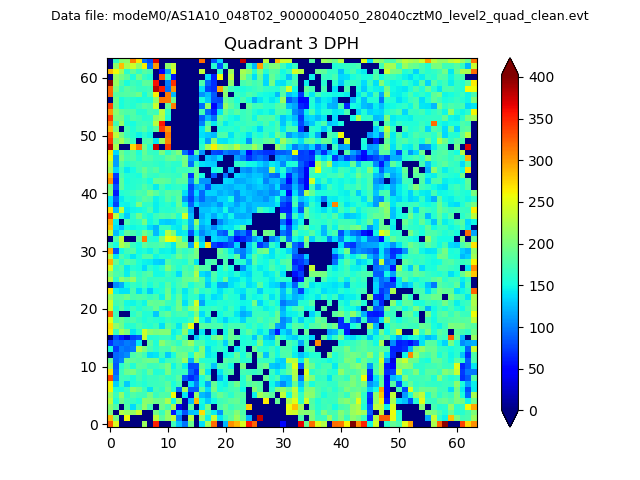 |
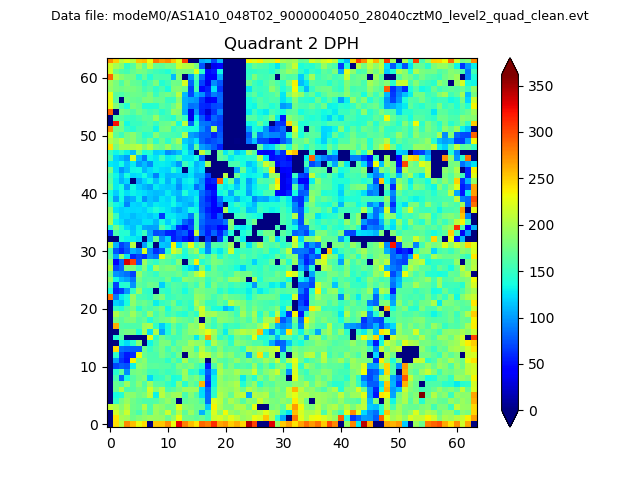 |
Quadrant C |
| Plot type | Count rate plots | Images |
|---|---|---|
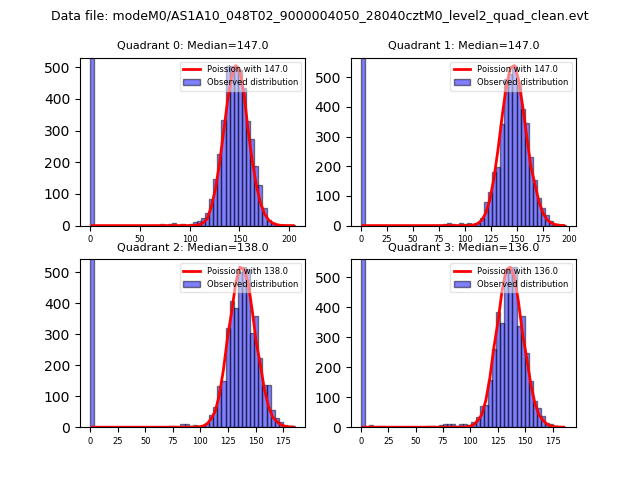
| Comparison with Poisson distribution Blue bars denote a histogram of data divided into 1 sec bins. Red curve is a Poisson curve with rate = median count rate of data. |
 |
 |
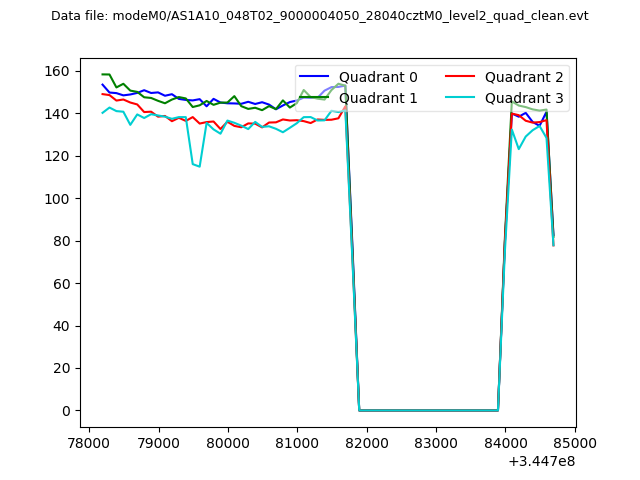
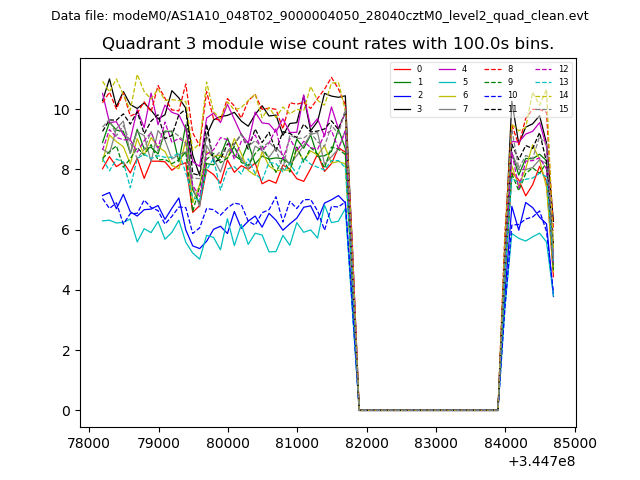
| Quadrant-wise count rates Data is divided into 100 sec bins |
 |
|
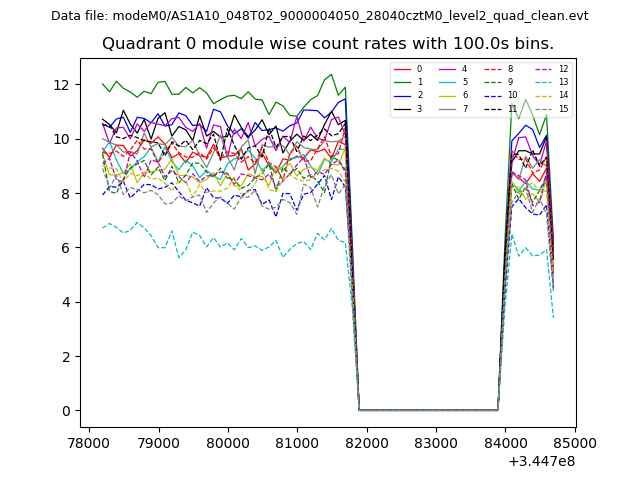
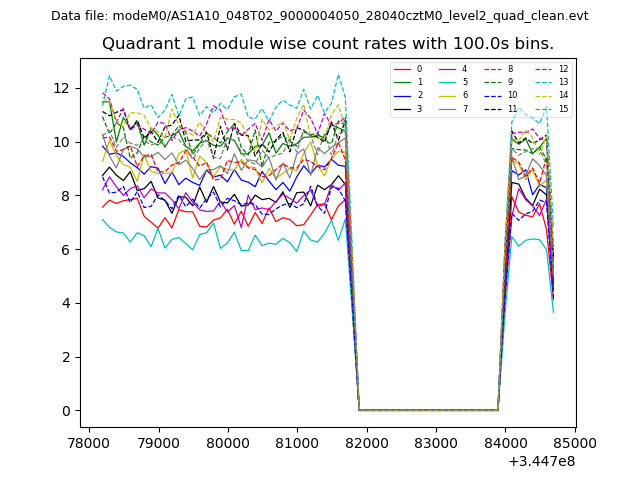
| Module-wise count rates for Quadrant A Data is divided into 100 sec bins |
 |
 |
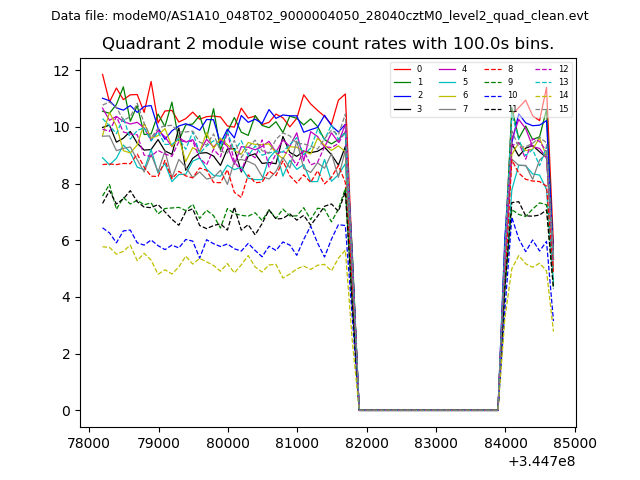
| Module-wise count rates for Quadrant B Data is divided into 100 sec bins |
 |
 |
| Module-wise count rates for Quadrant C Data is divided into 100 sec bins |
 |
 |
| Module-wise count rates for Quadrant D Data is divided into 100 sec bins |
 |
 |
| Parameter | Plot |
|---|---|
| CZT HV Monitor | 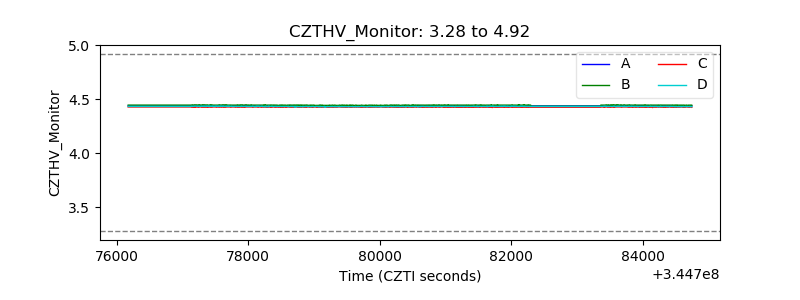 |
| D_VDD | 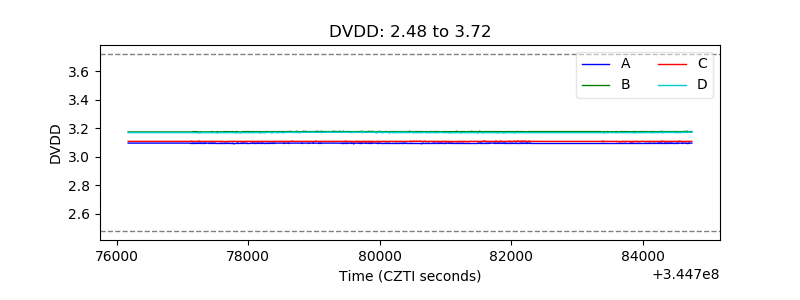 |
| Temperature 1 | 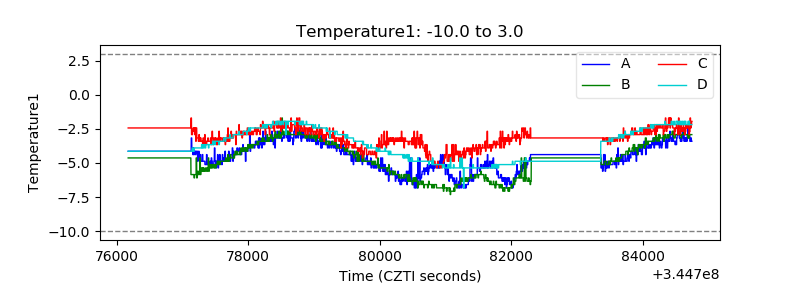 |
| Veto HV Monitor | 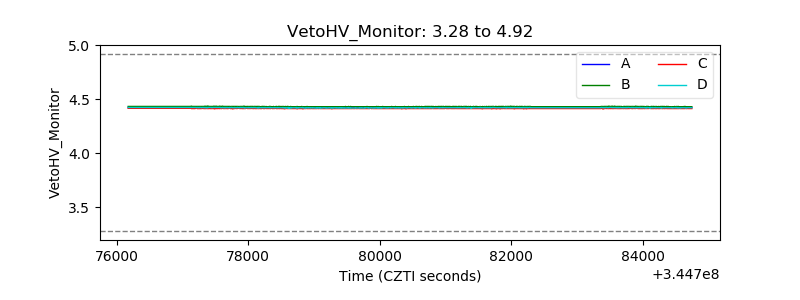 |
| Veto LLD | 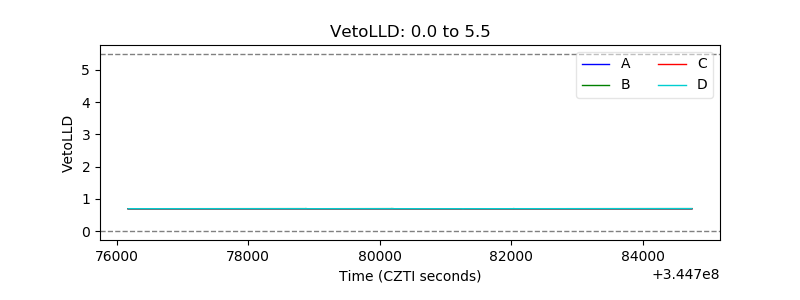 |
| Alpha Counter | 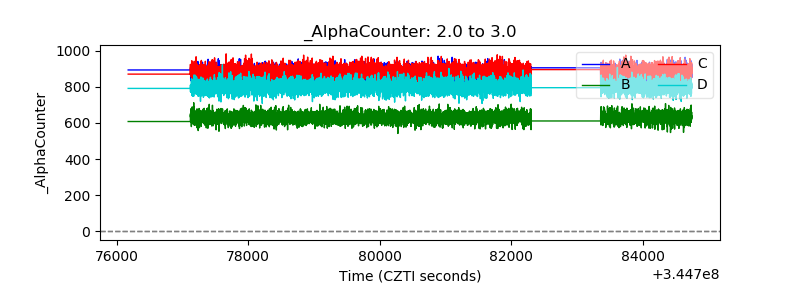 |
| _CPM_Rate | 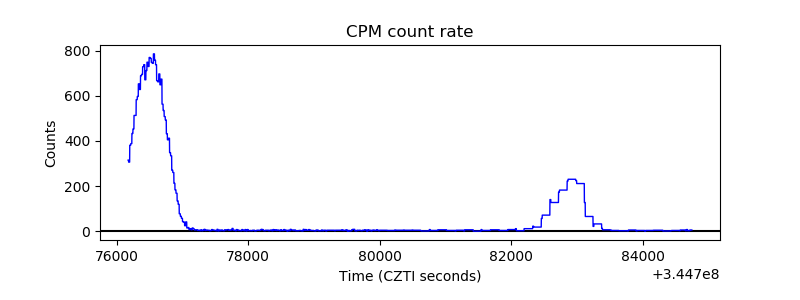 |
| CZT Counter | 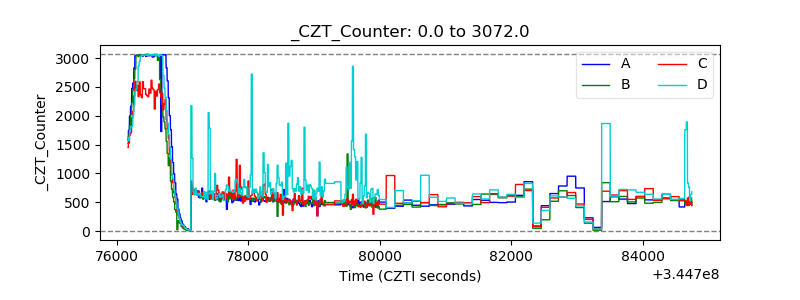 |
| +2.5 Volts monitor | 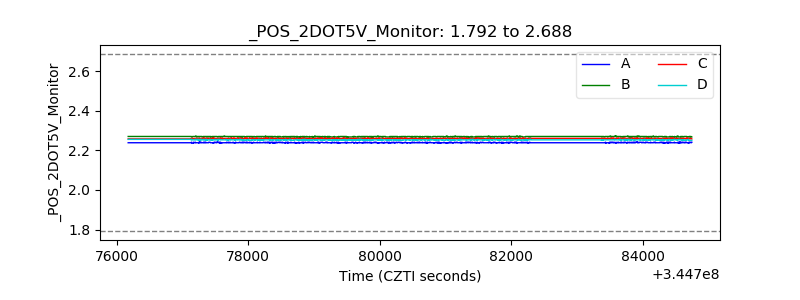 |
| +5 Volts monitor |  |
| _ROLL_ROT | 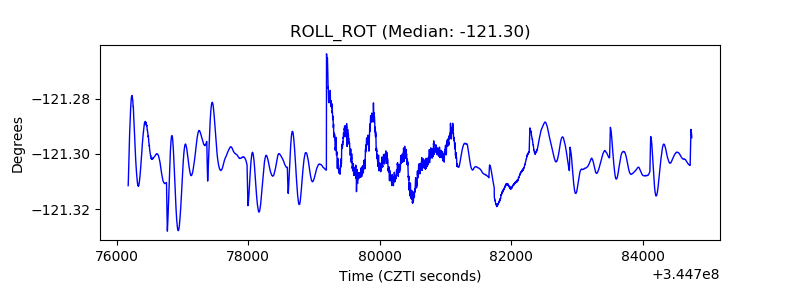 |
| _Roll_DEC |  |
| _Roll_RA | 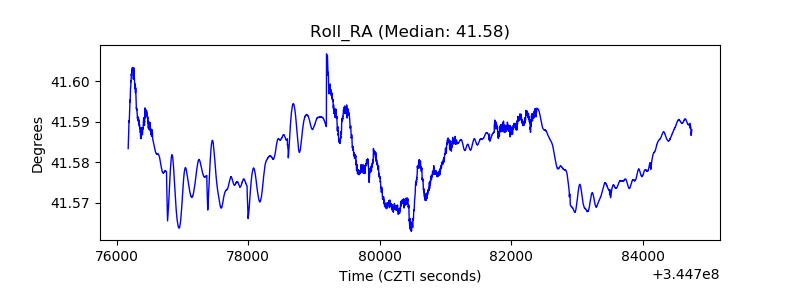 |
| Veto Counter | 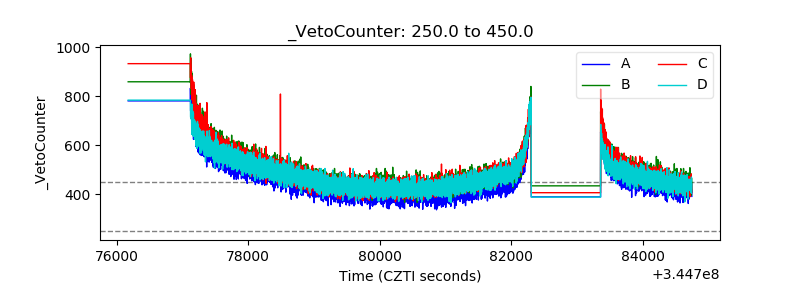 |