| Param | Original file | Final file |
|---|---|---|
| Filename | modeM0/AS1A10_048T02_9000004050_28041cztM0_level2.evt | modeM0/AS1A10_048T02_9000004050_28041cztM0_level2_quad_clean.evt |
| Size (bytes) | 560,044,800 | 98,415,360 |
| Size | 534.1 MB | 93.9 MB |
| Events in quadrant A | 3,466,626 | 648,885 |
| Events in quadrant B | 3,508,598 | 650,089 |
| Events in quadrant C | 3,644,122 | 617,435 |
| Events in quadrant D | 5,876,200 | 585,583 |
| Mode M0 | |||
|---|---|---|---|
| Quadrant | BADHDUFLAG | Total packets | Discarded packets |
| A | 0 | 14450 | 0 |
| B | 0 | 14556 | 0 |
| C | 0 | 15043 | 0 |
| D | 0 | 22271 | 0 |
| Mode M9 | |||
|---|---|---|---|
| Quadrant | BADHDUFLAG | Total packets | Discarded packets |
| A | 0 | 6 | 0 |
| B | 0 | 6 | 0 |
| C | 0 | 6 | 0 |
| D | 0 | 6 | 0 |
| Quadrant | Total seconds | Saturated seconds | Saturation percentage |
|---|---|---|---|
| A | 6869 | 132 | 1.921677% |
| B | 6869 | 138 | 2.009026% |
| C | 6870 | 164 | 2.387191% |
| D | 6870 | 520 | 7.569141% |
Noise dominated data is calculated using 1-second bins in cleaned event files. If a bin has >2000 counts, and if more than 50% of those come from <1% of pixels, then it is considered to be noise-dominated and hence unusable.
| Quadrant | # 1 sec bins | Bins with >0 counts | Bins with >2000 counts | High rate bins dominated by noise | Noise dominated (total time) | Noise dominated (detector-on time) | Marked lightcurve |
|---|---|---|---|---|---|---|---|
| A | 7454 | 6869 | 5 | 5 | 0.07% | 0.07% | 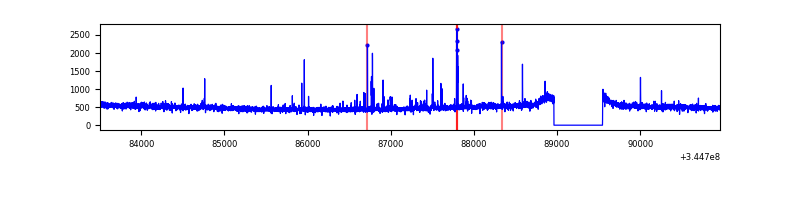 |
| B | 7454 | 6869 | 3 | 3 | 0.04% | 0.04% | 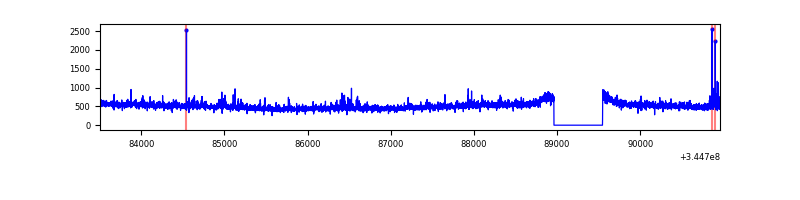 |
| C | 7455 | 6870 | 0 | 0 | 0.00% | 0.00% | 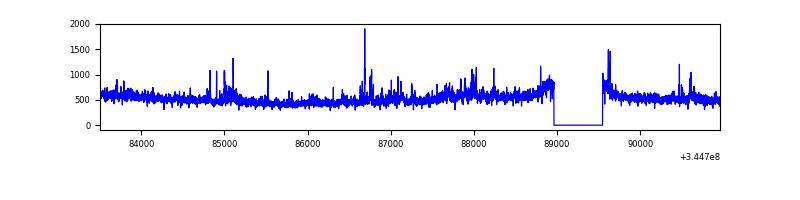 |
| D | 7455 | 6870 | 402 | 402 | 5.39% | 5.85% | 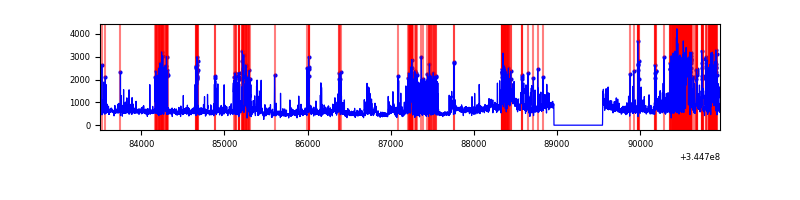 |
Top three noisy pixels from each quadrant. If the there are fewer than three noisy pixels in the level2.evt file, extra rows are filled as -1
| Pixel properties | Quadrant properties | ||||||
|---|---|---|---|---|---|---|---|
| Quadrant | DetID | PixID | Counts | Sigma | Mean | Median | Sigma |
| A | 6 | 16 | 73113 | 409.13 | 876 | 859 | 176.6 |
| A | 0 | 13 | 15670 | 83.87 | 876 | 859 | 176.6 |
| A | 13 | 254 | 10590 | 55.1 | 876 | 859 | 176.6 |
| B | 10 | 245 | 49456 | 295.35 | 864 | 842 | 164.6 |
| B | 0 | 190 | 24323 | 142.66 | 864 | 842 | 164.6 |
| B | 12 | 111 | 20382 | 118.72 | 864 | 842 | 164.6 |
| C | 3 | 233 | 259783 | 1330.64 | 832 | 840 | 194.6 |
| C | 14 | 238 | 133752 | 683.0 | 832 | 840 | 194.6 |
| C | 10 | 22 | 9607 | 45.05 | 832 | 840 | 194.6 |
| D | 1 | 52 | 1509719 | 7805.16 | 823 | 802 | 193.3 |
| D | 8 | 195 | 1159278 | 5992.44 | 823 | 802 | 193.3 |
| D | 7 | 80 | 51217 | 260.78 | 823 | 802 | 193.3 |
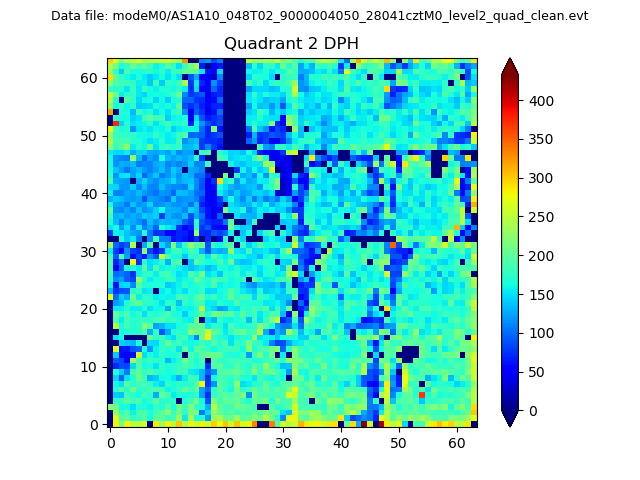
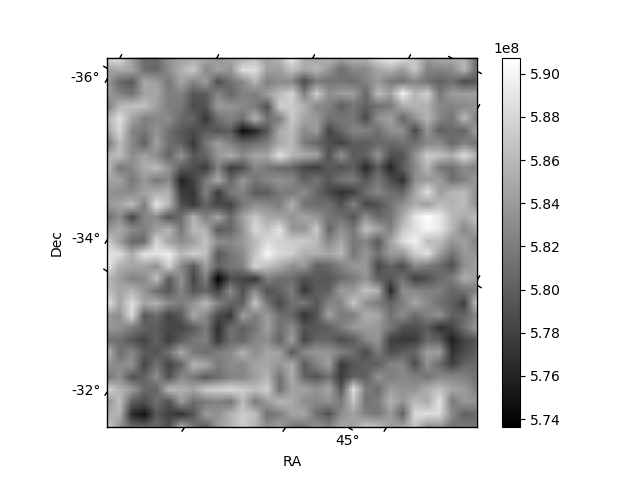
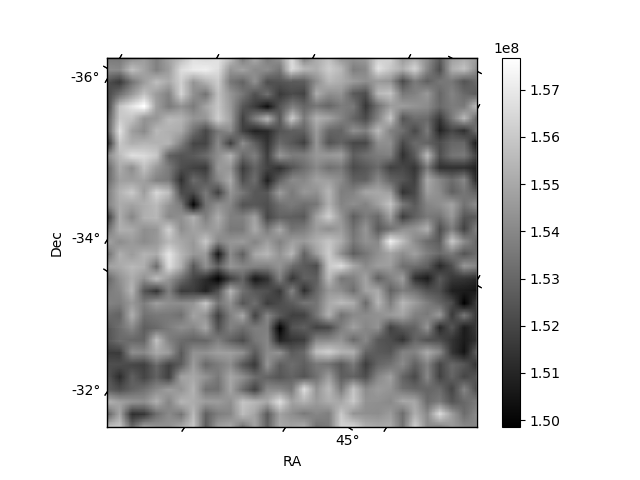
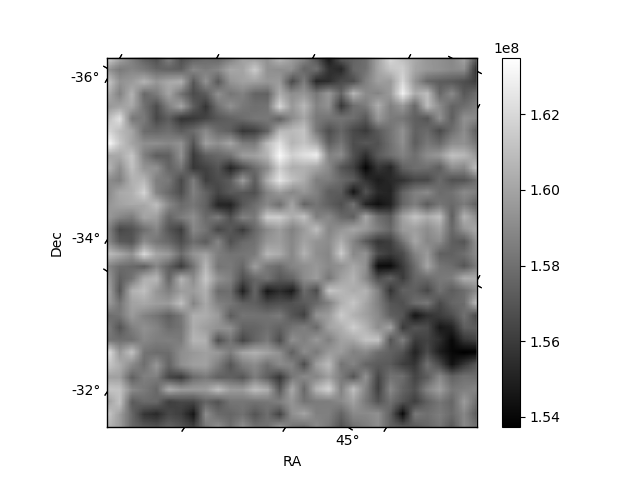
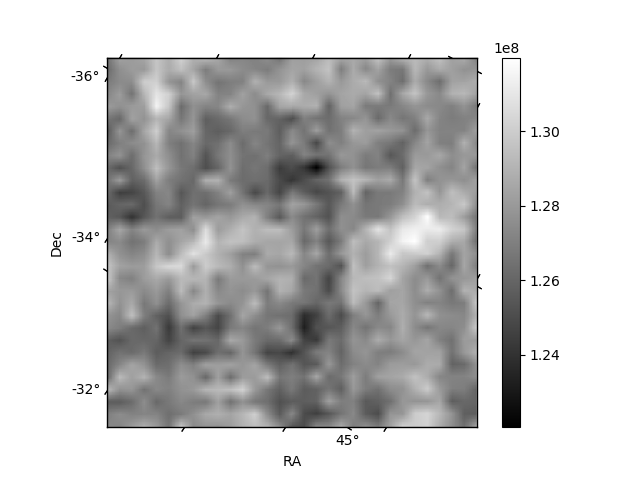
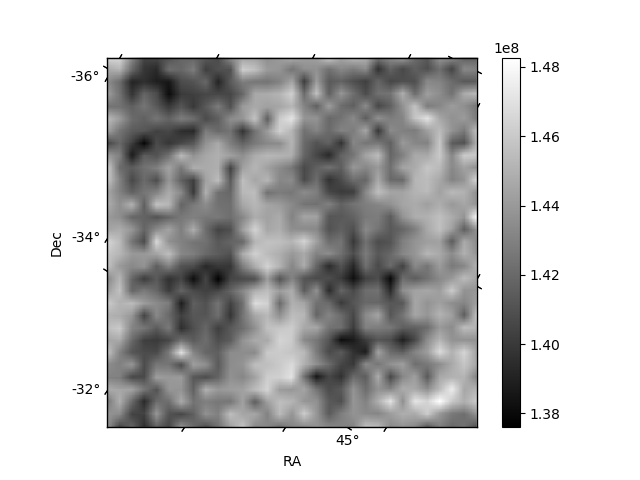
Histogram calculated using DETX and DETY for each event in the final _common_clean file
| Quadrant A | 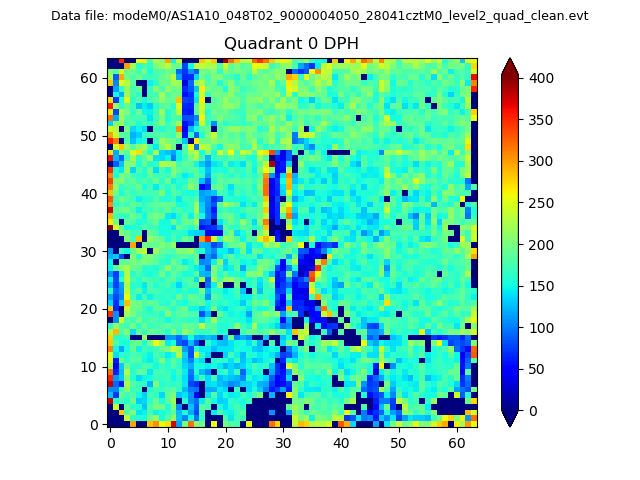 |
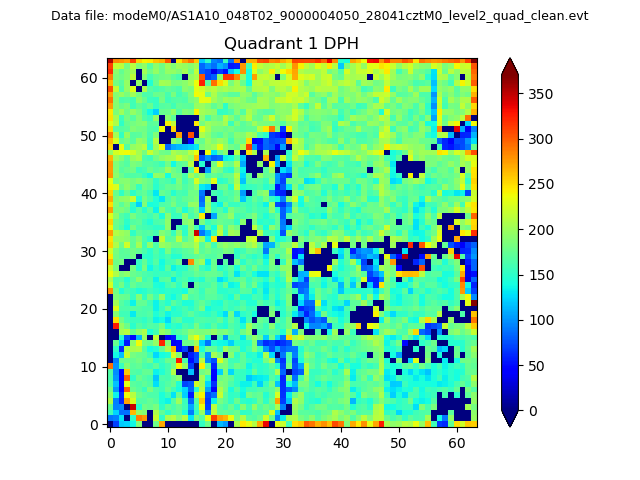 |
Quadrant B |
|---|---|---|---|
| Quadrant D | 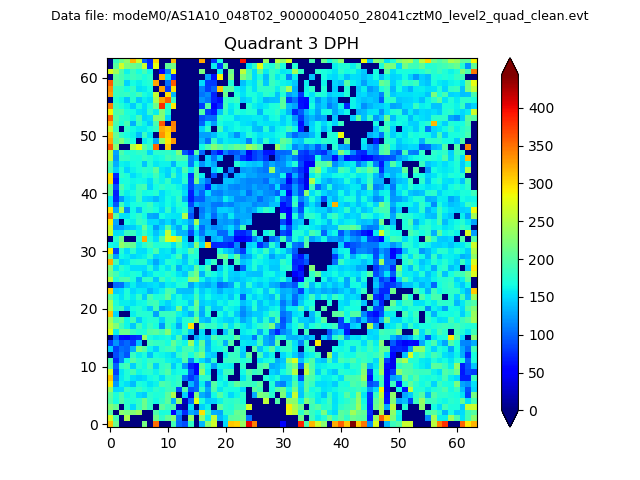 |
 |
Quadrant C |
| Plot type | Count rate plots | Images |
|---|---|---|
| Comparison with Poisson distribution Blue bars denote a histogram of data divided into 1 sec bins. Red curve is a Poisson curve with rate = median count rate of data. |
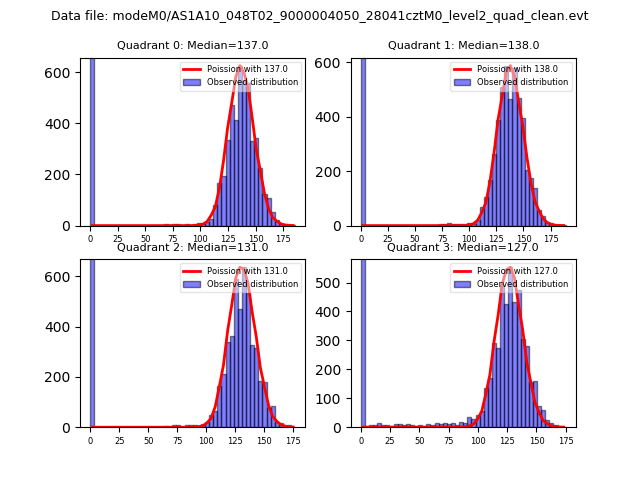 |
 |
| Quadrant-wise count rates Data is divided into 100 sec bins |
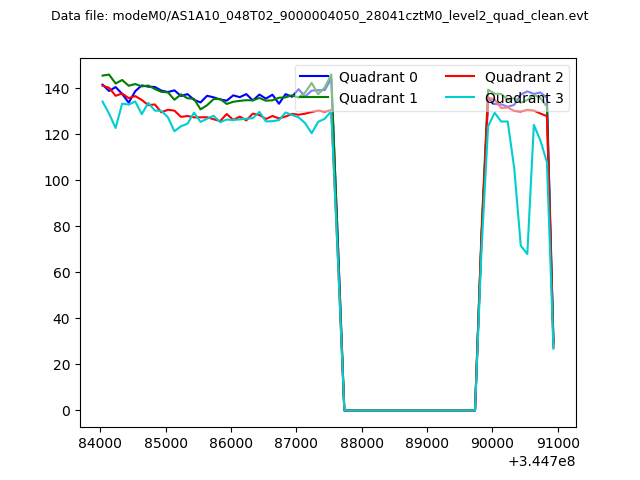 |
|
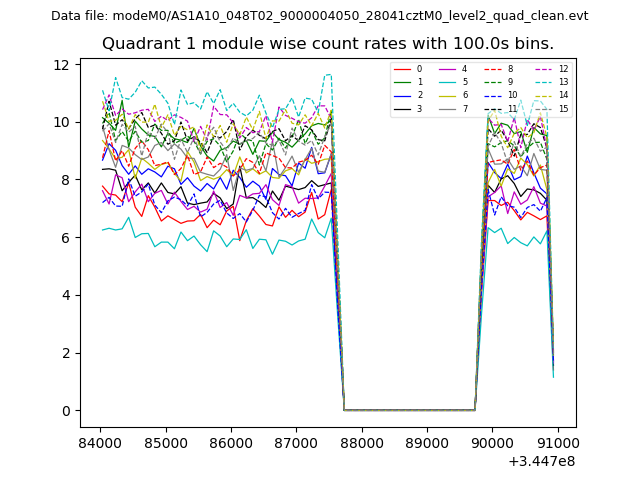
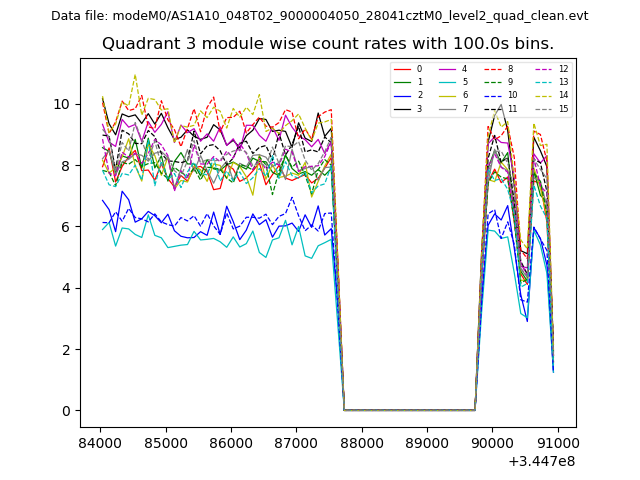
| Module-wise count rates for Quadrant A Data is divided into 100 sec bins |
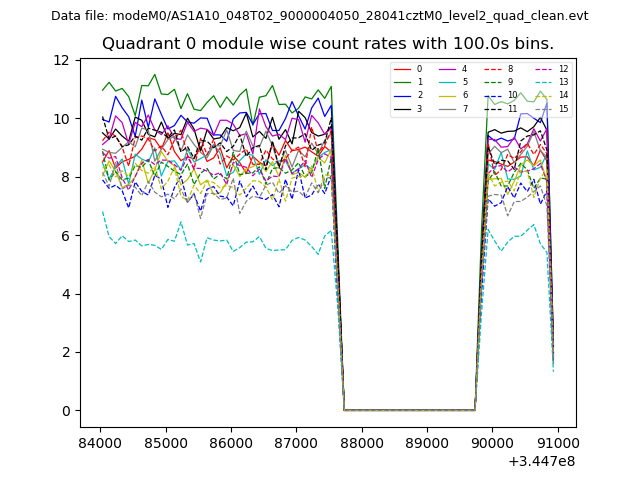 |
 |
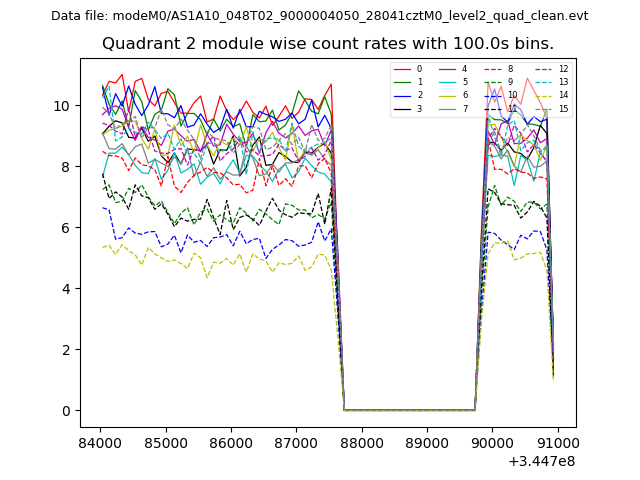
| Module-wise count rates for Quadrant B Data is divided into 100 sec bins |
 |
 |
| Module-wise count rates for Quadrant C Data is divided into 100 sec bins |
 |
 |
| Module-wise count rates for Quadrant D Data is divided into 100 sec bins |
 |
 |
| Parameter | Plot |
|---|---|
| CZT HV Monitor | 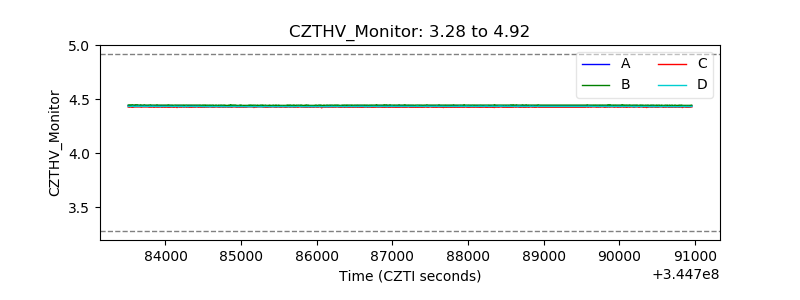 |
| D_VDD | 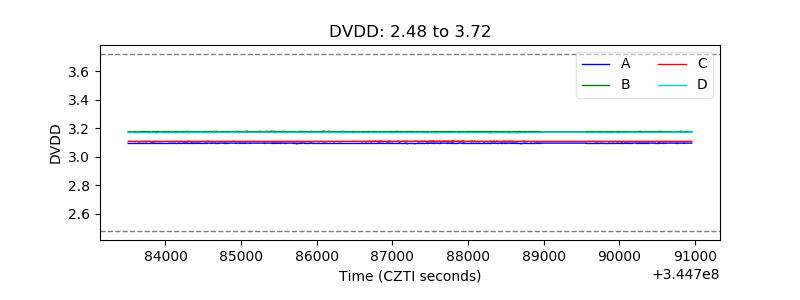 |
| Temperature 1 | 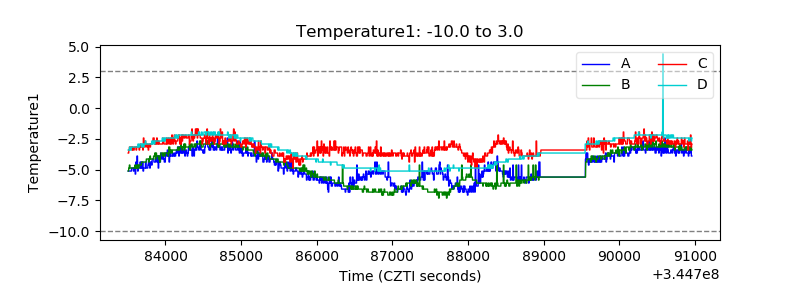 |
| Veto HV Monitor | 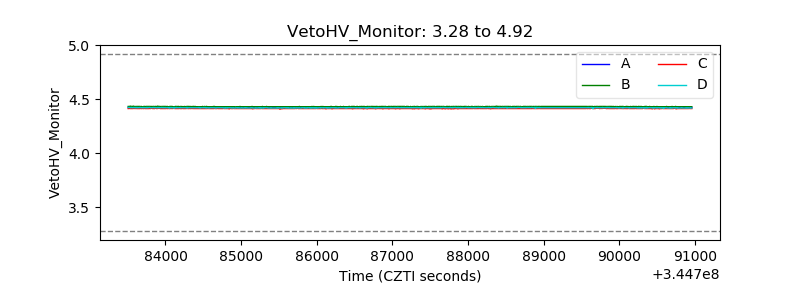 |
| Veto LLD | 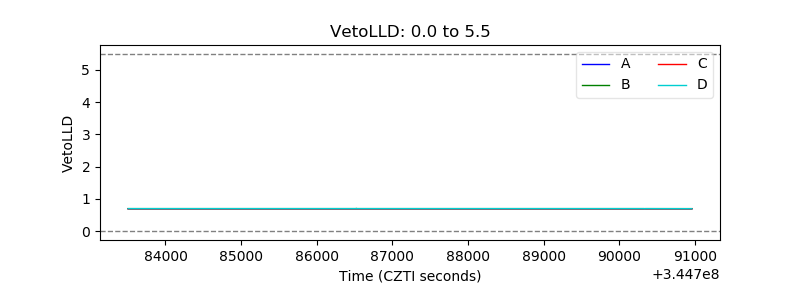 |
| Alpha Counter | 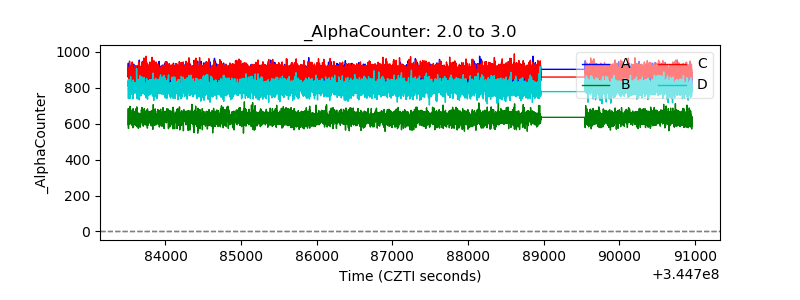 |
| _CPM_Rate | 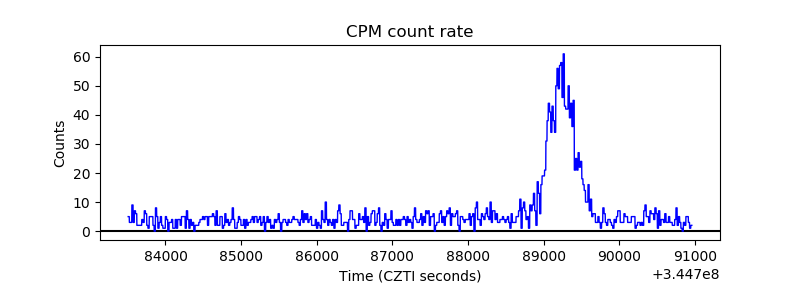 |
| CZT Counter | 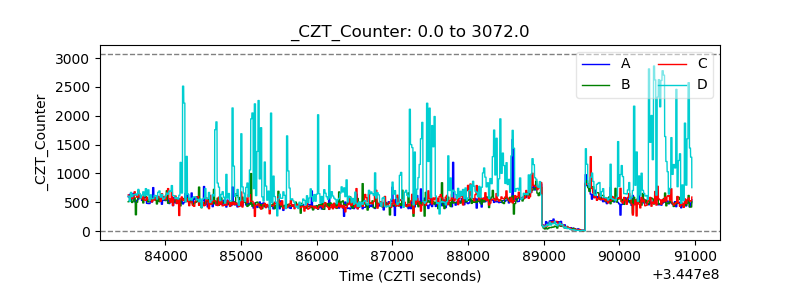 |
| +2.5 Volts monitor |  |
| +5 Volts monitor | 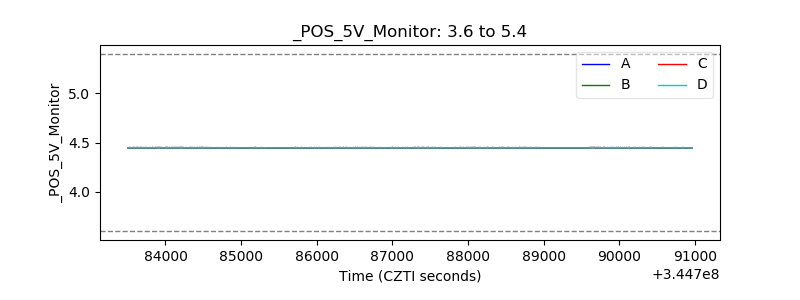 |
| _ROLL_ROT | 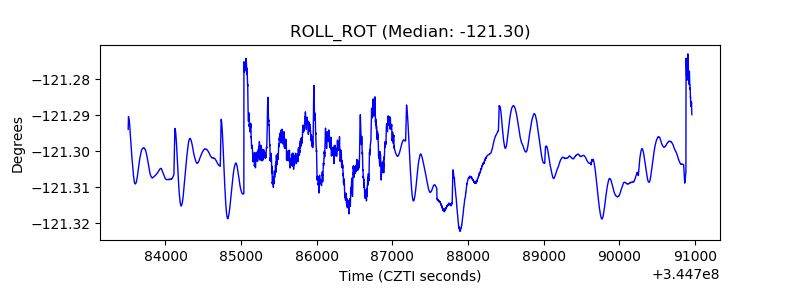 |
| _Roll_DEC | 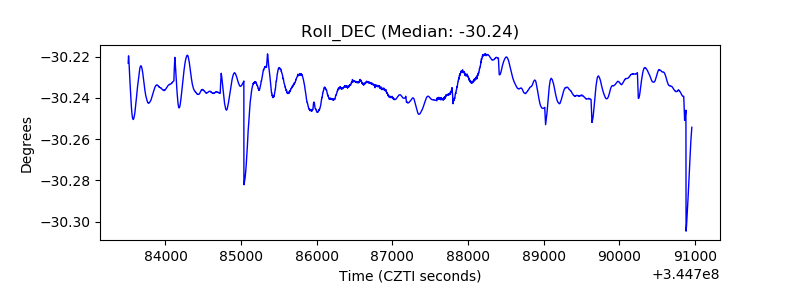 |
| _Roll_RA | 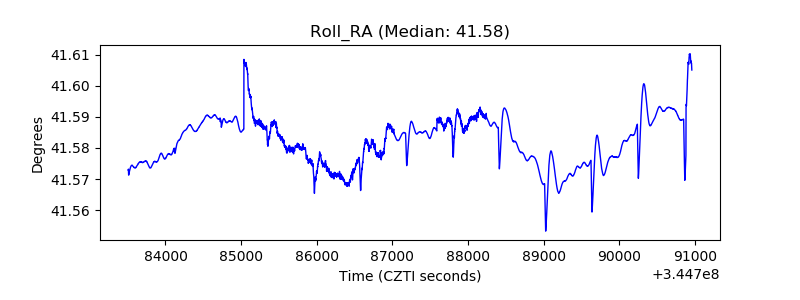 |
| Veto Counter | 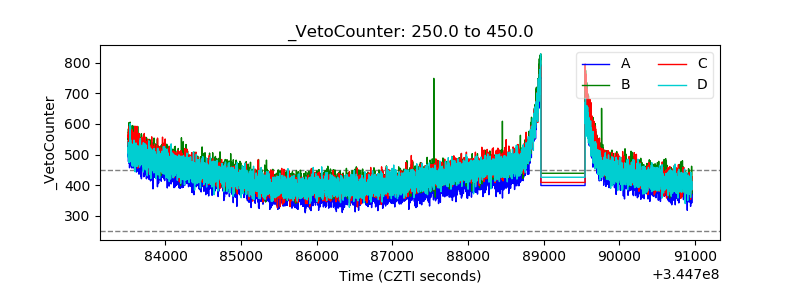 |