| Param | Original file | Final file |
|---|---|---|
| Filename | modeM0/AS1A10_048T02_9000004050_28043cztM0_level2.evt | modeM0/AS1A10_048T02_9000004050_28043cztM0_level2_quad_clean.evt |
| Size (bytes) | 146,174,400 | 38,347,200 |
| Size | 139.4 MB | 36.6 MB |
| Events in quadrant A | 897,823 | 263,814 |
| Events in quadrant B | 937,568 | 260,574 |
| Events in quadrant C | 884,345 | 247,264 |
| Events in quadrant D | 1,567,232 | 242,358 |
| Mode M0 | |||
|---|---|---|---|
| Quadrant | BADHDUFLAG | Total packets | Discarded packets |
| A | 0 | 4047 | 0 |
| B | 0 | 4151 | 0 |
| C | 0 | 4054 | 0 |
| D | 0 | 6069 | 0 |
| Quadrant | Total seconds | Saturated seconds | Saturation percentage |
|---|---|---|---|
| A | 2015 | 1 | 0.049628% |
| B | 2016 | 2 | 0.099206% |
| C | 2016 | 3 | 0.148810% |
| D | 2016 | 68 | 3.373016% |
Noise dominated data is calculated using 1-second bins in cleaned event files. If a bin has >2000 counts, and if more than 50% of those come from <1% of pixels, then it is considered to be noise-dominated and hence unusable.
| Quadrant | # 1 sec bins | Bins with >0 counts | Bins with >2000 counts | High rate bins dominated by noise | Noise dominated (total time) | Noise dominated (detector-on time) | Marked lightcurve |
|---|---|---|---|---|---|---|---|
| A | 2015 | 2015 | 0 | 0 | 0.00% | 0.00% | 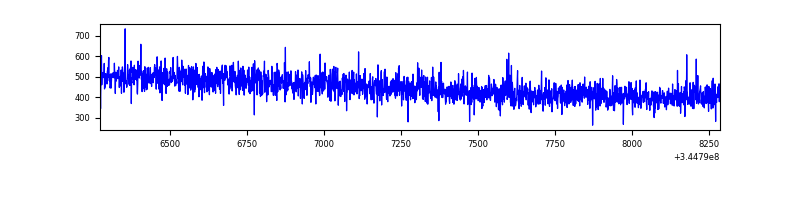 |
| B | 2016 | 2016 | 0 | 0 | 0.00% | 0.00% | 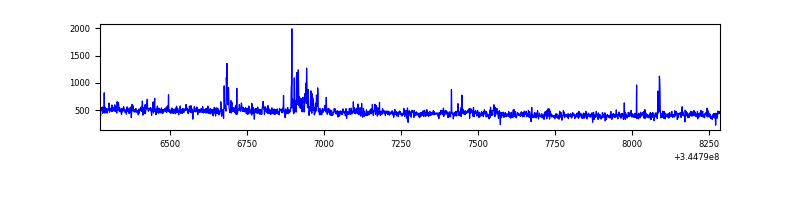 |
| C | 2016 | 2016 | 0 | 0 | 0.00% | 0.00% | 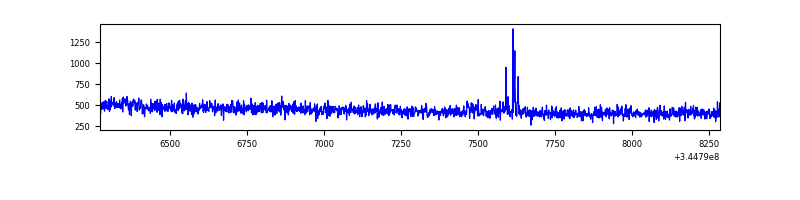 |
| D | 2016 | 2016 | 56 | 56 | 2.78% | 2.78% | 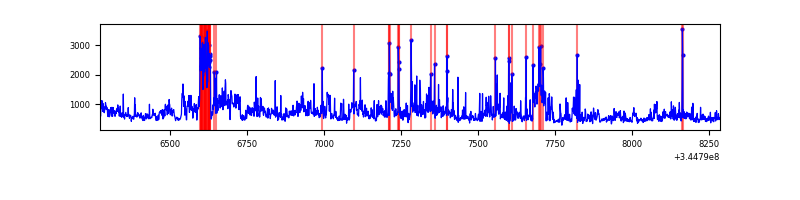 |
Top three noisy pixels from each quadrant. If the there are fewer than three noisy pixels in the level2.evt file, extra rows are filled as -1
| Pixel properties | Quadrant properties | ||||||
|---|---|---|---|---|---|---|---|
| Quadrant | DetID | PixID | Counts | Sigma | Mean | Median | Sigma |
| A | 0 | 13 | 3737 | 71.63 | 231 | 228 | 49.0 |
| A | 13 | 254 | 3065 | 57.91 | 231 | 228 | 49.0 |
| A | 3 | 137 | 2197 | 40.2 | 231 | 228 | 49.0 |
| B | 4 | 200 | 23996 | 516.85 | 227 | 222 | 46.0 |
| B | 10 | 245 | 7967 | 168.38 | 227 | 222 | 46.0 |
| B | 0 | 183 | 5667 | 118.38 | 227 | 222 | 46.0 |
| C | 14 | 238 | 34397 | 658.3 | 213 | 214 | 51.9 |
| C | 3 | 233 | 10797 | 203.81 | 213 | 214 | 51.9 |
| C | 10 | 22 | 7357 | 137.56 | 213 | 214 | 51.9 |
| D | 8 | 195 | 349302 | 6475.06 | 215 | 209 | 53.9 |
| D | 1 | 52 | 256579 | 4755.21 | 215 | 209 | 53.9 |
| D | 7 | 80 | 125307 | 2320.35 | 215 | 209 | 53.9 |
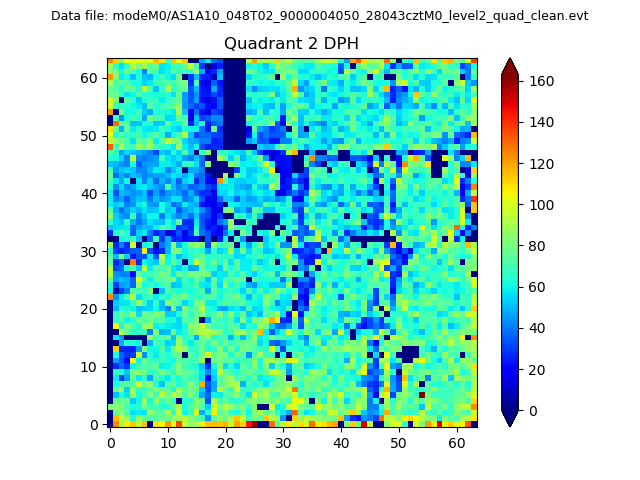
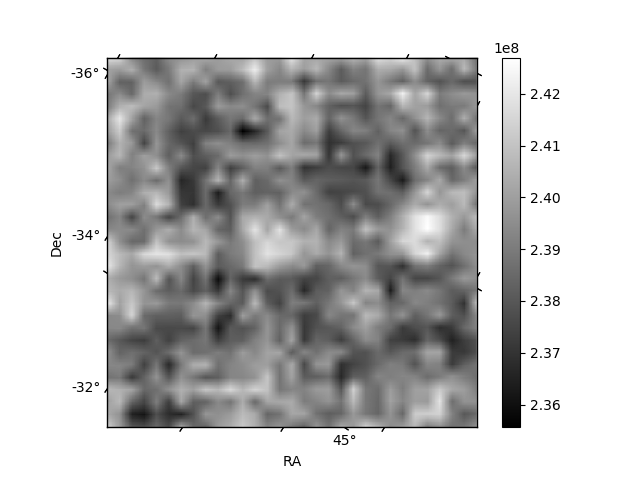
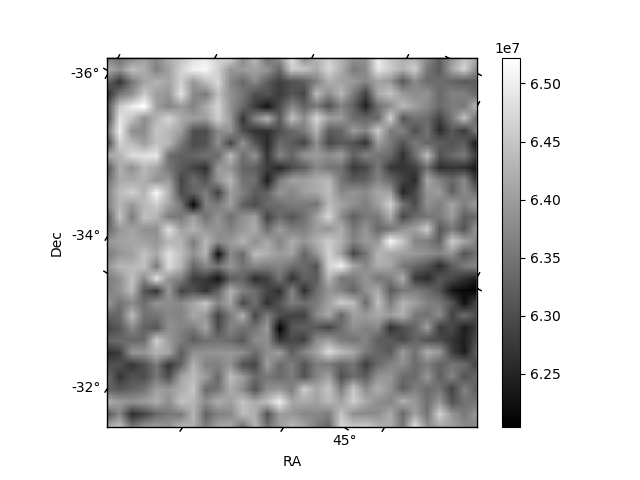
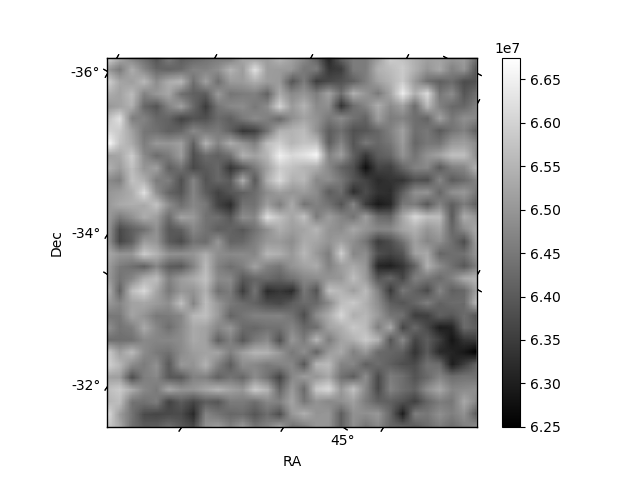
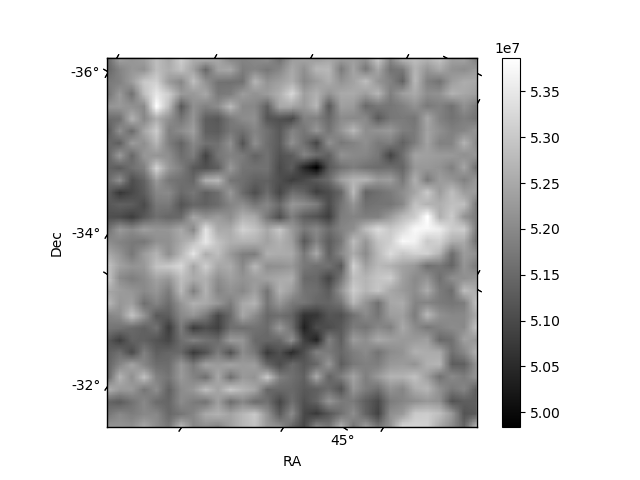
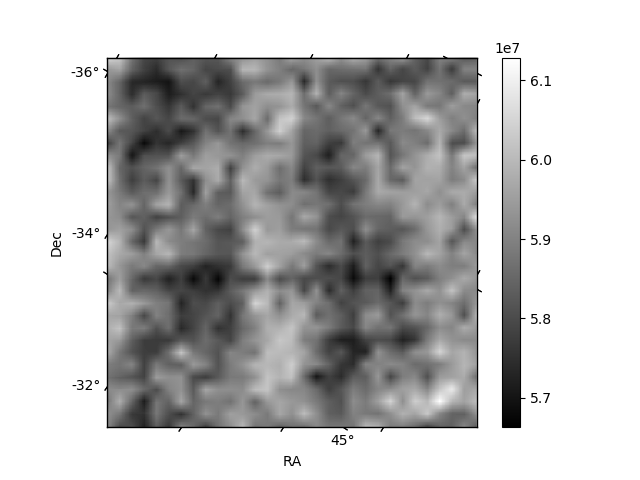
Histogram calculated using DETX and DETY for each event in the final _common_clean file
| Quadrant A | 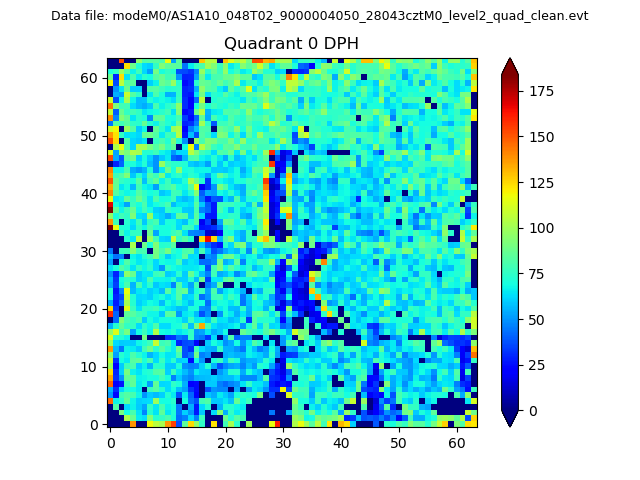 |
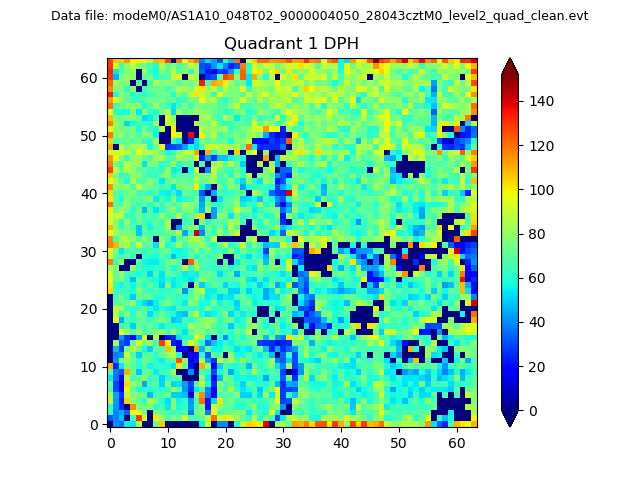 |
Quadrant B |
|---|---|---|---|
| Quadrant D | 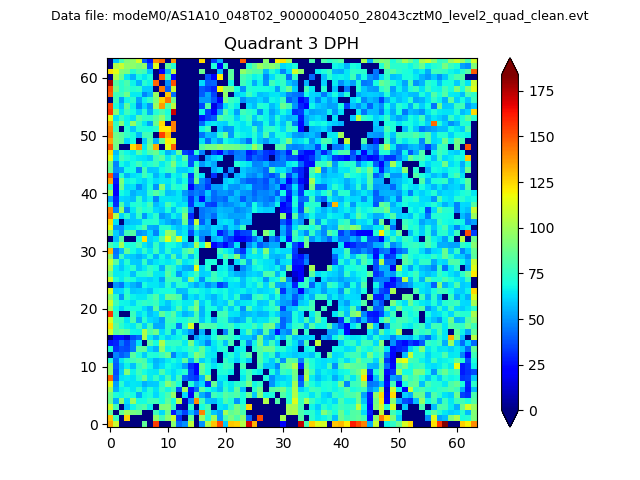 |
 |
Quadrant C |
| Plot type | Count rate plots | Images |
|---|---|---|
| Comparison with Poisson distribution Blue bars denote a histogram of data divided into 1 sec bins. Red curve is a Poisson curve with rate = median count rate of data. |
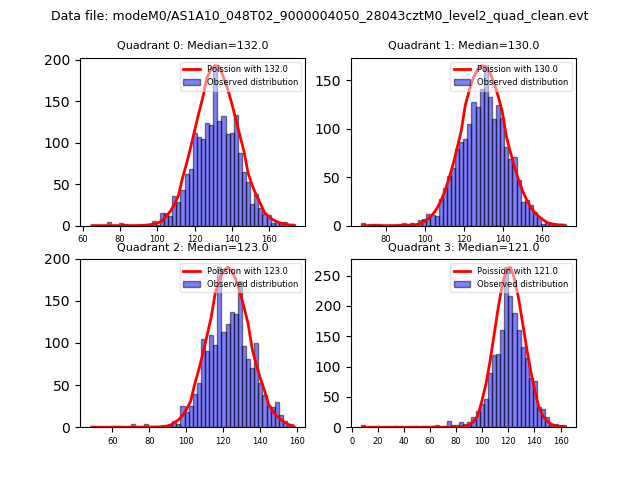 |
 |
| Quadrant-wise count rates Data is divided into 100 sec bins |
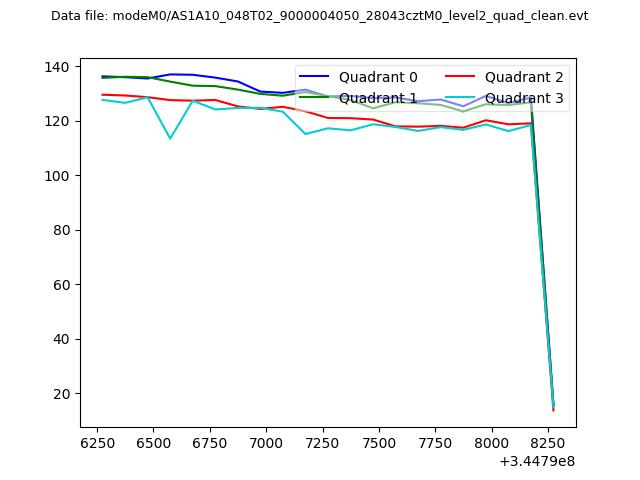 |
|
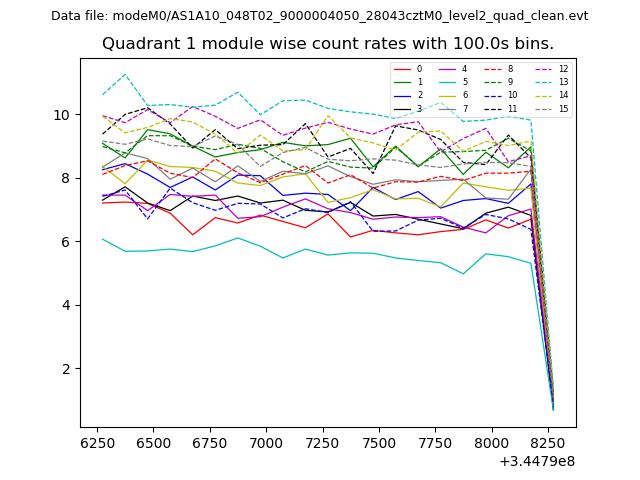
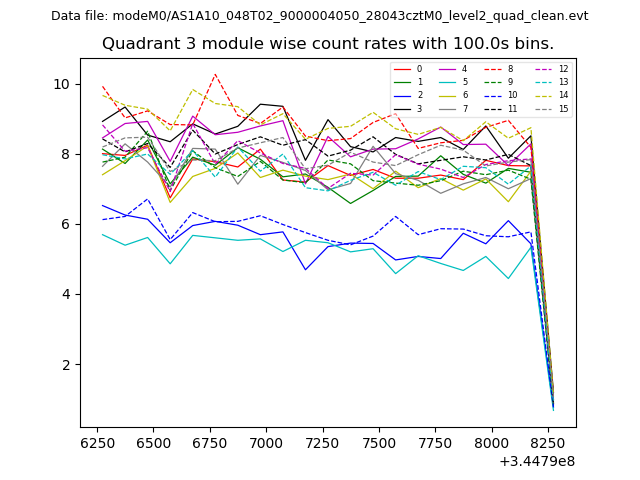
| Module-wise count rates for Quadrant A Data is divided into 100 sec bins |
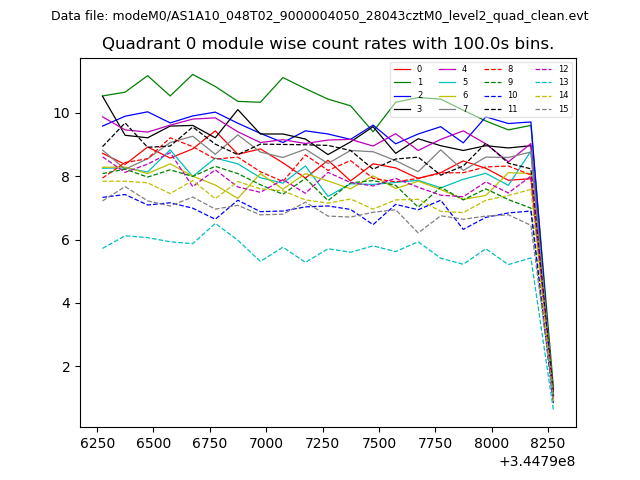 |
 |
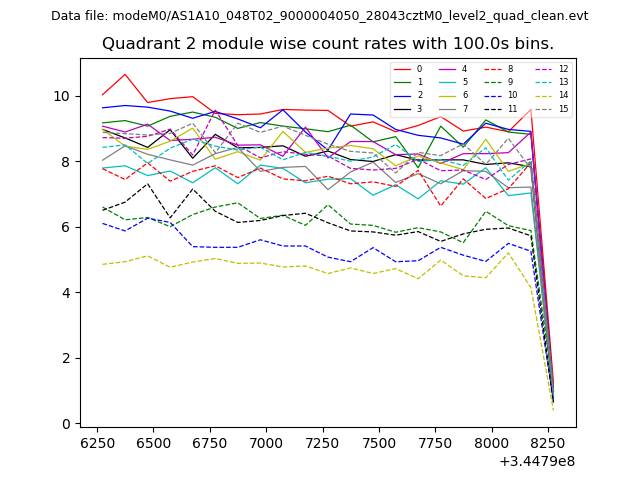
| Module-wise count rates for Quadrant B Data is divided into 100 sec bins |
 |
 |
| Module-wise count rates for Quadrant C Data is divided into 100 sec bins |
 |
 |
| Module-wise count rates for Quadrant D Data is divided into 100 sec bins |
 |
 |
| Parameter | Plot |
|---|---|
| CZT HV Monitor | 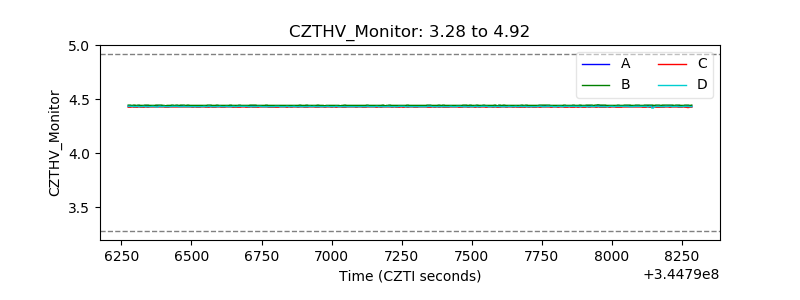 |
| D_VDD | 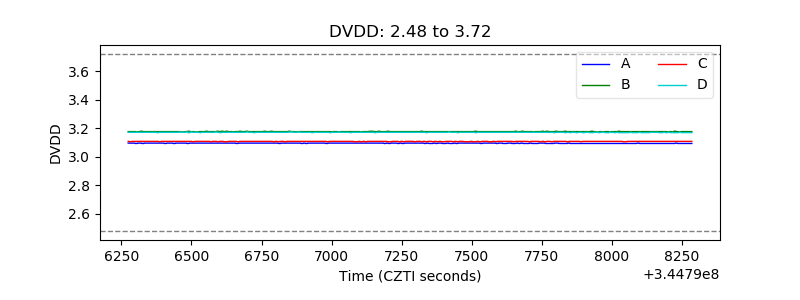 |
| Temperature 1 | 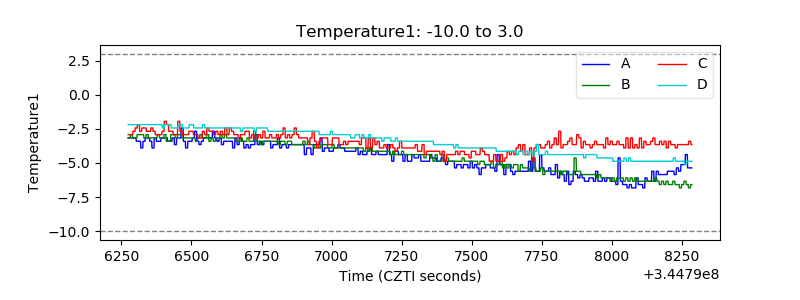 |
| Veto HV Monitor | 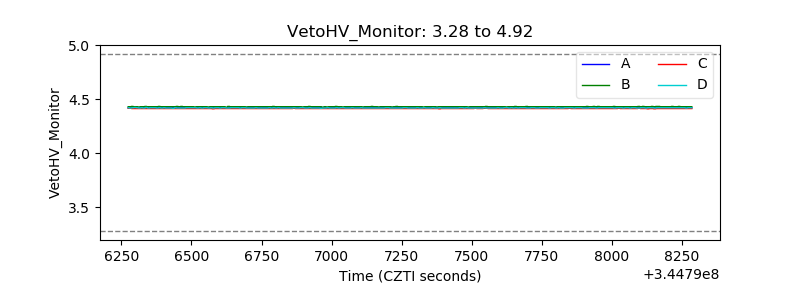 |
| Veto LLD | 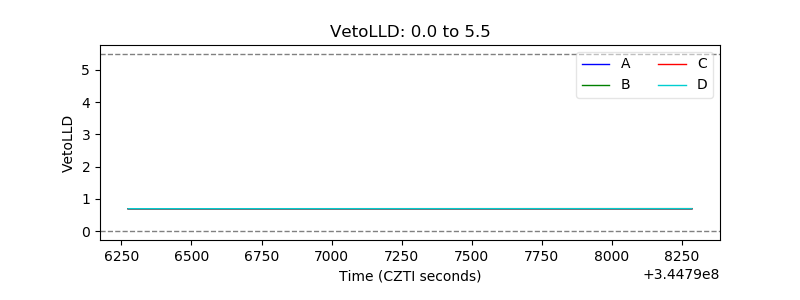 |
| Alpha Counter | 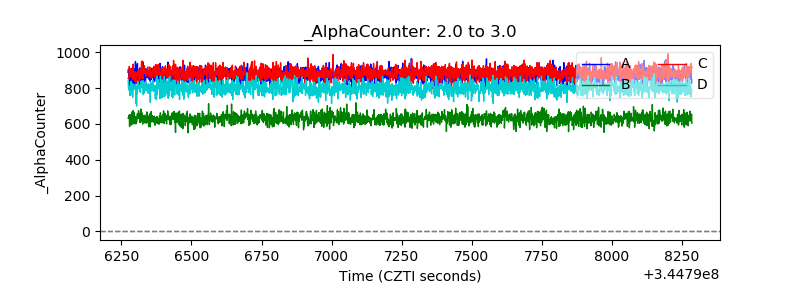 |
| _CPM_Rate | 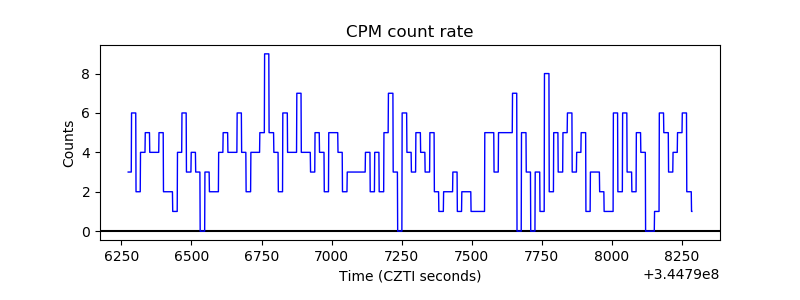 |
| CZT Counter | 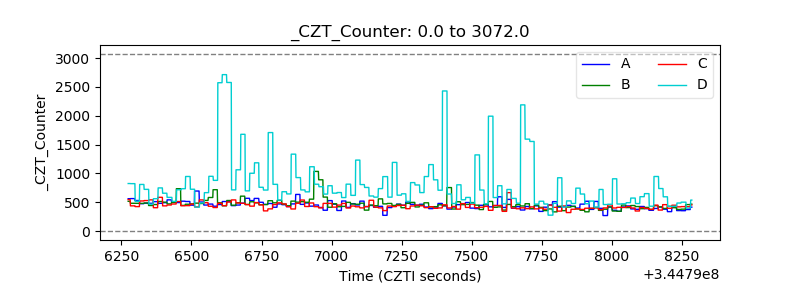 |
| +2.5 Volts monitor | 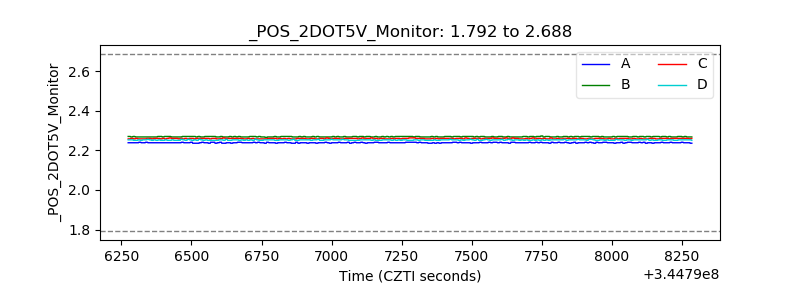 |
| +5 Volts monitor | 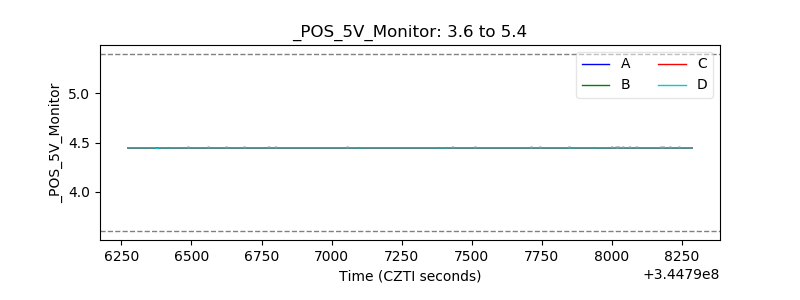 |
| _ROLL_ROT | 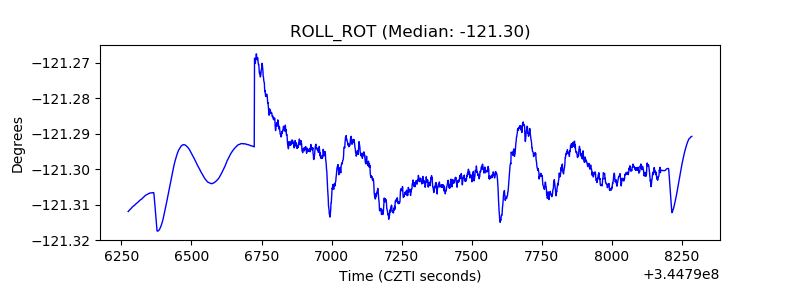 |
| _Roll_DEC |  |
| _Roll_RA | 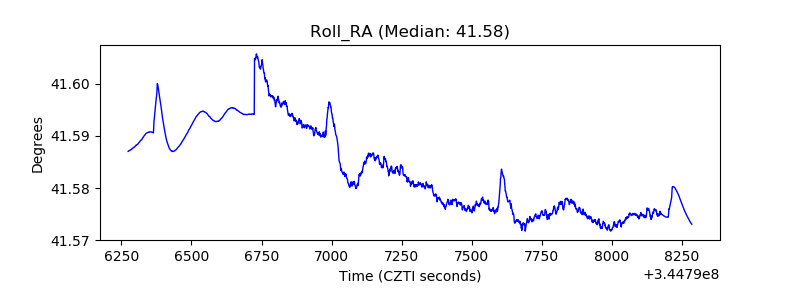 |
| Veto Counter | 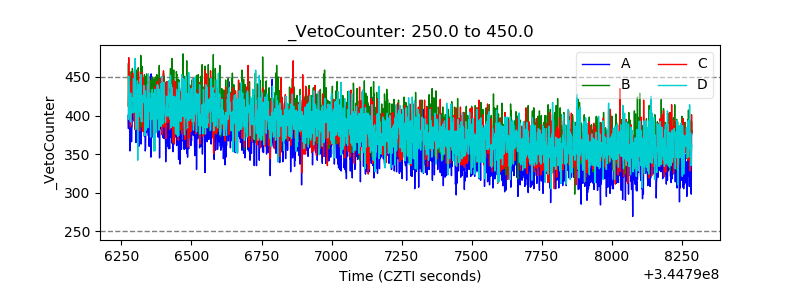 |