| Param | Original file | Final file |
|---|---|---|
| Filename | modeM0/AS1A10_045T03_9000004052cztM0_level2.fits | modeM0/AS1A10_045T03_9000004052cztM0_level2_quad_clean.evt |
| Size (bytes) | 356,034,240 | 353,649,600 |
| Size | 339.5 MB | 337.3 MB |
| Events in quadrant A | 2,222,136 | 2,179,073 |
| Events in quadrant B | 2,117,776 | 2,165,107 |
| Events in quadrant C | 2,137,082 | 2,044,490 |
| Events in quadrant D | 1,759,006 | 1,777,079 |
| Mode SS | |||
|---|---|---|---|
| Quadrant | BADHDUFLAG | Total packets | Discarded packets |
| A | 0 | 758 | 0 |
| B | 0 | 760 | 0 |
| C | 0 | 762 | 0 |
| D | 0 | 758 | 0 |
| Mode M0 | |||
|---|---|---|---|
| Quadrant | BADHDUFLAG | Total packets | Discarded packets |
| A | 0 | 76849 | 0 |
| B | 0 | 77393 | 0 |
| C | 0 | 81203 | 0 |
| D | 0 | 129194 | 0 |
| Mode M9 | |||
|---|---|---|---|
| Quadrant | BADHDUFLAG | Total packets | Discarded packets |
| A | 0 | 60 | 0 |
| B | 0 | 58 | 0 |
| C | 0 | 58 | 0 |
| D | 0 | 56 | 0 |
| Quadrant | Total seconds | Saturated seconds | Saturation percentage |
|---|---|---|---|
| A | 37098 | 273 | 0.735889% |
| B | 36974 | 418 | 1.130524% |
| C | 37097 | 683 | 1.841119% |
| D | 36973 | 4353 | 11.773456% |
Noise dominated data is calculated using 1-second bins in cleaned event files. If a bin has >2000 counts, and if more than 50% of those come from <1% of pixels, then it is considered to be noise-dominated and hence unusable.
| Quadrant | # 1 sec bins | Bins with >0 counts | Bins with >2000 counts | High rate bins dominated by noise | Noise dominated (total time) | Noise dominated (detector-on time) | Marked lightcurve |
|---|---|---|---|---|---|---|---|
| A | 41668 | 36635 | 0 | 0 | 0.00% | 0.00% |  |
| B | 41668 | 36617 | 0 | 0 | 0.00% | 0.00% |  |
| C | 41668 | 36642 | 0 | 0 | 0.00% | 0.00% | 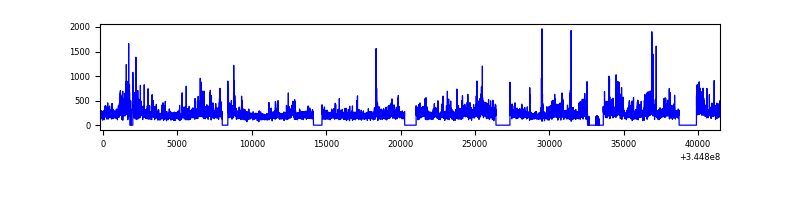 |
| D | 41668 | 36605 | 0 | 0 | 0.00% | 0.00% |  |
Top three noisy pixels from each quadrant. If the there are fewer than three noisy pixels in the level2.evt file, extra rows are filled as -1
| Pixel properties | Quadrant properties | ||||||
|---|---|---|---|---|---|---|---|
| Quadrant | DetID | PixID | Counts | Sigma | Mean | Median | Sigma |
| A | 0 | 29 | 1760 | 8.42 | 579 | 545 | 144.3 |
| A | 7 | 110 | 1725 | 8.18 | 579 | 545 | 144.3 |
| A | 9 | 19 | 1700 | 8.01 | 579 | 545 | 144.3 |
| B | 2 | 9 | 1738 | 10.98 | 559 | 536 | 109.4 |
| B | 2 | 8 | 1413 | 8.01 | 559 | 536 | 109.4 |
| B | 14 | 254 | 1413 | 8.01 | 559 | 536 | 109.4 |
| C | 3 | 187 | 1488 | 6.73 | 564 | 529 | 142.5 |
| C | 9 | 242 | 1448 | 6.45 | 564 | 529 | 142.5 |
| C | 9 | 209 | 1424 | 6.28 | 564 | 529 | 142.5 |
| D | 7 | 3 | 1282 | 6.24 | 501 | 458 | 132.0 |
| D | 3 | 14 | 1268 | 6.14 | 501 | 458 | 132.0 |
| D | 6 | 231 | 1259 | 6.07 | 501 | 458 | 132.0 |
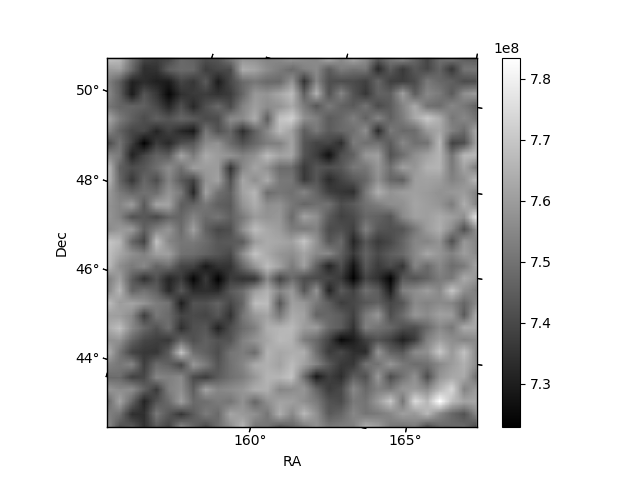
Histogram calculated using DETX and DETY for each event in the final _common_clean file
| Quadrant A |  |
 |
Quadrant B |
|---|---|---|---|
| Quadrant D |  |
 |
Quadrant C |
| Plot type | Count rate plots | Images |
|---|---|---|
| Comparison with Poisson distribution Blue bars denote a histogram of data divided into 1 sec bins. Red curve is a Poisson curve with rate = median count rate of data. |
 |
 |
| Quadrant-wise count rates Data is divided into 100 sec bins |
 |
|
| Module-wise count rates for Quadrant A Data is divided into 100 sec bins |
 |
 |
| Module-wise count rates for Quadrant B Data is divided into 100 sec bins |
 |
 |
| Module-wise count rates for Quadrant C Data is divided into 100 sec bins |
 |
 |
| Module-wise count rates for Quadrant D Data is divided into 100 sec bins |
 |
 |
| Parameter | Plot |
|---|---|
| CZT HV Monitor |  |
| D_VDD |  |
| Temperature 1 |  |
| Veto HV Monitor |  |
| Veto LLD |  |
| Alpha Counter |  |
| _CPM_Rate |  |
| CZT Counter |  |
| +2.5 Volts monitor |  |
| +5 Volts monitor |  |
| _ROLL_ROT |  |
| _Roll_DEC |  |
| _Roll_RA |  |
| Veto Counter |  |